文章信息
- 刘悦,高运苓,程吉,王杰,徐富强
- LIU Yue, GAO Yun-ling, CHENG Ji, WANG Jie, XU Fu-qiang
- 一种核磁共振波谱谱峰对齐及谱峰提取的方法
- A Processing Method for Spectrum Alignment and Peak Extraction for NMR Spectra
- 波谱学杂志, 2015, 32(2): 382-392
- Chinese Journal of Magnetic Resonance, 2015, 32(2): 382-392
- http://dx.doi.org/10.11938/cjmr20150220
-
文章历史
- 收稿日期:2015-03-10
- 收修改稿日期:2015-05-09
2. 波谱与原子分子物理国家重点实验室, 武汉磁共振中心(中国科学院 武汉物理与数学研究所), 武汉 430071;
3. 生命科学学院 武汉大学, 武汉 430072
2. State Key Laboratory of Magnetic Resonance and Atomic and Molecular Physics, National Center for Magnetic Resonance in Wuhan (Wuhan Institute of Physics and Mathematics, Chinese Academy of Sciences), Wuhan 430071;
3. College of Life Science, Wuhan University, Wuhan 430072
Nowadays,NMR (Nuclear Magnetic Resonance) spectra as a powerful tool of metabolomics,which aims at studying the metabolites in organisms,tissues or biofluids,is widely used in many research fields such as pharmacology,toxicology,nutriology and disease diagnosis[1, 2, 3, 4, 5].
The advantages on little,or without,sample preparation,and high-throughput analysis as well,make proton NMR spectroscopy (1H NMR) standing out in all analytical strategies[6, 7]. Ideally,the NMR spectra should have consistent chemical shifts and stable baseline. However,it always drifts due to uncontrolled factors,such as variation of pH value and temperature,intermolecular interactions in the samples,instabilities of the NMR apparatus (temperature and vibration of the probe,etc.),and other insuperable physicochemical interactions[6, 8]. Thus the NMR spectra post processing which mainly includes noise reduction,spectrum alignment (except for the microenvironment investigation) and peak extraction is an essential procedure for spectroscopy analysis[9]. Due to the huge data sets,especially with a high-throughput strategy,of 1H NMR spectra,the automatic batch spectrum alignment is a great challenge. Although a metabolic expert could carry out this tedious task manually,it has serious shortcomings because it is time consuming,highly subjective and often empirical on several fields,such as NMR spectroscopy,biochemistry and biology. The bias introduced by different users may affect the final experiment results. Hitherto,many methods have been employed in spectrum alignment,such as COW (correlation optimized warping),MSPA (multi-scale peak alignment) and GPA (Gaussian smoothing peak alignment). However,these algorithms have their limitations,and the utilizations are usually very complex,not suitable for common researchers[10, 11, 12].
Furthermore,the high-throughput data analysis has become an inevitable trend in the development of modern technology. Thus the variable extraction method of a parallel NMR spectra data is a crucial factor influencing the efficiency of the scientific research. Currently,there are two variable extraction methods commonly used in the high-throughput NMR data analysis process: subsection integration method and target analysis method[13, 14]. In the subsection integration method,the whole NMR spectrum is divided into a set of variables which are also called ‘bins’ or ‘buckets’ corresponding to the spectra regions. The bins have fixed chemical shift range (such as 0.002 or 0.005),and the area of the bins are calculated for the variable selection. It is simple and fast for most NMR spectra. Furthermore,it only needs a little NMR experience for the investigators. However,the results usually lack biological significance and are easily influenced by pH,ionic concentration,peak overlap or other factors. In addition,it is based on the sacrifice of data resolution. To overcome these drawbacks,the target analysis method was proposed. This approach is based on matching the peaks with the spectrum of the reference compounds from databases or libraries which are defined as a set of 1H NMR spectra,with one file per authentic compound. The variables have strong chemical meaning,since the resonance peaks are the finger prints of the chemical compounds. However,good prior knowledge with NMR spectra is required for the researcher,and databases or libraries for target chemical compounds are needed. Furthermore,this complex data analysis approach is very time consuming and highly demanding on researchers. To fulfill the aims of lower dependence on the prior knowledge concerning the composition of complex mixture and the reduction of time,the peak extraction approach should be a great choice after the spectrum is aligned accurately. Therefore,the present work proposes an efficient NMR spectra processing method for spectrum alignment and peak extraction.
Rat plasma and urine samples are widely used in animal metabolism research. Consequently,the efficiency of our approach was tested by applying to the NMR spectra of rat plasma and urine. The implementation Matlab code and the NMR spectra data of rat plasma and urine samples in this article are available upon request.
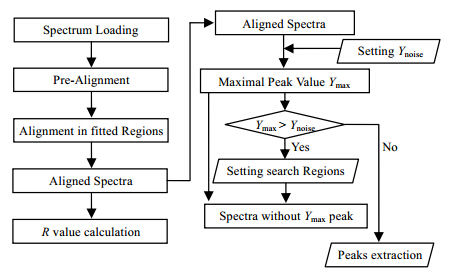
1 MethodsThe following sections include two steps of the method,spectrum alignment and peak extraction. The steps of the spectrum alignment and peak extraction are summarized in the flowchart (Fig. 1). In order to show it clearly,the detailed theories are described as follows.

|
| Fig. 1 The flowchart of NMR spectrum alignment and peak extraction |
Spectra preprocessing usually contains baseline correction and noise reduction,as well as artifacts removal in each spectrum. For baseline correction,the most commonly used method is MLR (multiple linear regression) provided by the commercial software,for example,Topspin,the software provided by Bruker. This step is always carried out by researchers manually,on each spectrum separately and independently from other spectra,which is efficient for a few spectra. In the current study,the spectra of both the urine and plasma samples were preprocessed in Topspin manually. Then the raw NMR data were analyzed in the following steps.
1.2 Spectrum alignmentIdeally,a one-to-one correspondence for each of NMR spectra across all samples should be established. However,it is generally not the case because of uncontrolled changes in chemical shifts of NMR peaks due to slight differences in the detection environment (samples and the NMR apparatus). Thus,the alignment step is essential[15]. Our processing method of spectrum alignment also offers a batch analysis for a set of NMR spectra. At first,a pre-alignment was completed according to the chemical shift of the internal standard substance or a characteristic peak of one target compound (such as NAA in the brain extracts). Then,a random spectrum of the spectra was chosen as the reference spectrum. It was divided into several consecutive searching intervals. In order to decrease the influence of the shift of the spectra during the alignment,the start and end points of the searching intervals were set to the flat region (very few NMR signals). The spectrum alignment was implemented in every interval.
In each interval,the highest peak value (Ymax) and the corresponding chemical shift of this peak (δref) were found at first. This peak value was set to the shift target of the other spectrum. Due to the different chemical environment and the chemical components in various samples,this peak should not be the highest value in the other spectra. Thus a search of rage (Δδ) of the chemical shift was set at first. According to the experience,the default value of Δδ' was 0.2. All the peaks were found in the range of $[{\delta _{ref}} - \Delta \delta ',\;\,{\delta _{ref}} + \Delta \delta ']$ of the spectra.
For searching the peak values,the following algorithm was employed. Between the searching region $[{\delta _{ref}} - \Delta \delta ',\;\,{\delta _{ref}} + \Delta \delta ']$ in the other spectra,if Ym > Ym-1 and Ym > Ym+1 $({\delta _{m - 1}} \ge \;{\delta _{ref}} - \Delta \delta '$ and ${\delta _{m - 1}} \le \;{\delta _{ref}} + \Delta \delta ')$,Ym was the peak value,and the corresponding chemical shift was δm. At the end,the number of peaks (pn) was found; all the peaks with the value ${Y_{p1}},\;{Y_{p2}},\; \cdots ,\;{Y_{pn}}$ and their reference chemical shift ${\delta _{p1}},\;{\delta _{p2}},\; \cdots ,\;{\delta _{pn}}$ were sought out.
Then,these peaks were moved to δref in succession,and the correlation coefficient Rpx (px =p1 - pn) between the spectrum and the reference spectrum in the search region $[{\delta _{ref}} - \Delta \delta ',\;\,{\delta _{ref}} + \Delta \delta ']$ was calculated. The correlation coefficient was described in the following section. Finally,the maximum of the correlation coefficient was chosen,Rmax,Ypx was the corresponding peak value,and δpx was the chemical shift for this peak. The step length of the shift was calculated from the difference δpx and δref. Tiny gap was generated after the shift of the spectrum,and it would be filled with the neighboring points. The same method was also applied to the other regions.
Here,the correlation coefficient R[16] was introduced,which was widely used in the evaluation of the efficiency of spectrum alignment. The method of calculating R is shown in the following:
| ${R_{(a,b)}} = \frac{{Cov(a,b)}}{{\sqrt {V(a)V(b)} }} = \frac{1}{n}\sum\limits_{i = 1}^n {\frac{{{a_i} - \bar a}}{{{S_a}}} \cdot \frac{{{b_i} - \bar b}}{{{S_b}}}} $ | (1) |
Peak extraction method provides a fast way of reducing the complexity of NMRS analysis task. It stands out compared to other two kinds of popular methods of analysis (segmented-direct-integration or target analysis) for enhancing sensitivity required in biologically meaningful areas and does not require the user to have strong NMR background[3, 17].
The peak extraction approach was applied to the whole spectrum. However,the former peak searching method would involve noise values. Thus a new peak-finding approach was introduced in this application. At first,the maximum value (Ymax1) was found in the whole spectrum,and δmax1 was the corresponding chemical shift of this peak. Then the whole region of this peak was found according to the following method: If ${Y_{\max 1 - i}} > {Y_{\max 1 - (i - 1)}},\;{\delta _{\max 1 - (i - 1)}}$ was the chemical shift of the start point of this peak,and if ${Y_{\max 1 + j}} > {Y_{\max 1 + (j - 1)}},\;{\delta _{\max 1 + (j - 1)}}$ was the chemical shift of the end point of this peak $(i,j = 1,\cdots ,n)$,then the first peak was obtained between the start point and the end points which was deducted from the whole spectrum. The maximum value of the new spectrum and the new peak were found based on the former description.
In order to avoid the influence of the noise,a noise value (Ynoise) should be defined at first. If Ymax was smaller than Ynoise,the peak extraction method was completed. However,some meaningless peaks would be included with this whole spectrum searching method,which had only a few points. Thus these tiny peaks were merged with the neighboring ones. Using this method all the peaks should be interested,and stand for one or a few chemicals. Fewer variables were selected at the end,and it could be better adapted for many statistical analyses.
1.4 Application of the methodIn order to validate the efficiency of the method,this new method was applied to align the NMR spectra of the wine samples,which were always used to evaluate the efficiency of the alignment[3, 4, 20]. Furthermore,the NMR spectra of the most popular bio-fluids samples (urine and plasma) were employed. During the metabolomics analysis,the spectrum of urine is the most difficult for peak alignment,as the pH value varies in various samples,while the spectrum of plasma is much easier. In order to save the space,the urine spectra (of 60 samples) were employed for peak alignment,and the blood spectra (of 23 samples) were used in peak extraction.
During the preparation of the samples,100 μL of pure urine/plasma mixture was transferred to a 5 mm NMR tube containing 60 μL D2O and 440 μL phosphate buffer (pH=7.2,5 mmol/L,formate as the internal standard compound). The spectra were acquired on a Bruker Avance 600 spectrometer (Bruker Biospin) operating at 600.13 MHz.
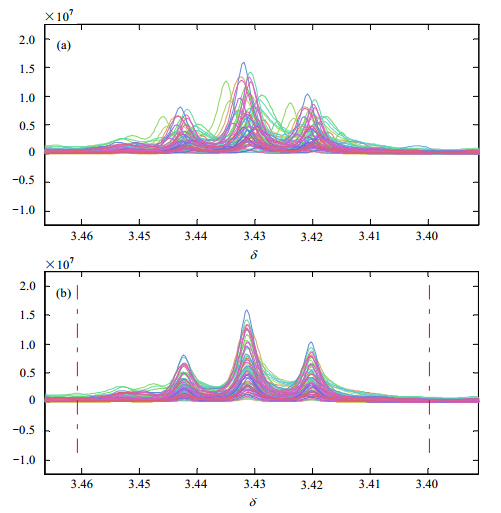
2 Results and discussion 2.1 Spectrum alignmentOwing to pH variation and complex components,it is very difficult to perform spectrum alignment for urine samples. Our spectrum alignment theory and algorithm lead to a remarkable improvement as shown in the results in Fig. 2 and Fig. 3.

|
| Fig. 2 Overview of the results of spectrum alignment in a typical local region for 60 rat urine samples: (a) and (b) show the result in the spectral region contains three reference peaks (from δ3.40 to 3.46). The x-axis is the chemical shift; the y-axis is the peak intensity |

|
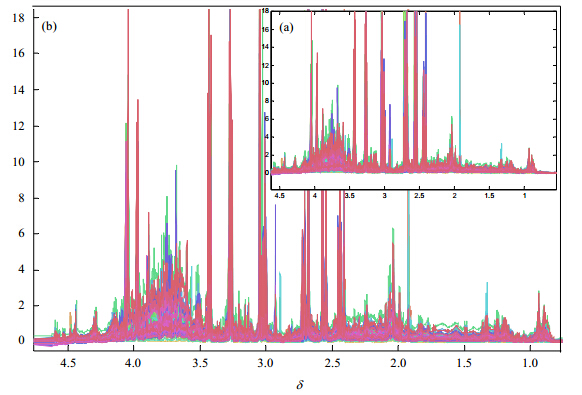
| Fig. 3 Overview of the whole 60 rat urine NMR spectra: (a) pre-alignment according to Formate δ-8.46; (b) the reconstruction after subsection alignment. The x-axis is the chemical shift; the y-axis is the peak intensity. The spectra cover 3.8 spectral region (from δ4.60 to 0.80) |
The correlation coefficient R only reached 0.634 4 after the pre-alignment based on the internal standard compound: Formate δ-8.46 [Fig. 3(a)]. According to the former description,one spectrum was selected as the reference spectrum. Then this spectrum was divided into several regions (Table 1). The peak alignment was completed in each region independently. If the default value Δδ' was not perfect for the alignment,it could be adjusted manually (Table 2). In order to demonstrate the efficiency,a typical region of the spectrum (from 3.384 2 to 3.538 3) was collected in Fig. 2 (zoom in from δ3.40 to 3.46). After the reconstruction of these 22 regions,the correlation coefficients R of these 60 spectra covering a 3.8 spectral region (from δ4.60 to 0.80) have been successfully achieved to 0.904 3 [Fig. 3(b)].
| No. | Align region δA (left) | Align region δB (right) | Searching range | R |
| 1 | 0.7897 | 1.0115 | 0.02 | 0.9485 |
| 2 | 1.0118 | 1.4666 | 0.02 | 0.9096 |
| 3 | 1.4669 | 1.8804 | 0.02 | 0.7775 |
| 4 | 1.8807 | 2.1624 | 0.02 | 0.8715 |
| 5 | 2.1627 | 2.3009 | 0.02 | 0.8542 |
| 6 | 2.3012 | 2.4225 | 0.02 | 0.9708 |
| 7 | 2.4228 | 2.4827 | 0.02 | 0.9665 |
| 8 | 2.4830 | 2.6291 | 0.02 | 0.9667 |
| 9 | 2.6294 | 2.7067 | 0.02 | 0.9640 |
| 10 | 2.7098 | 2.8562 | 0.02 | 0.8581 |
| 11 | 2.8565 | 2.9521 | 0.004 | 0.8853 |
| 12 | 2.9524 | 3.0288 | 0.01 | 0.9724 |
| 13 | 3.0291 | 3.0805 | 0.01 | 0.9615 |
| 14 | 3.0808 | 3.2152 | 0.01 | 0.6903 |
| 15 | 3.2155 | 3.3839 | 0.01 | 0.8992 |
| 16 | 3.3842 | 3.5383 | 0.01 | 0.8809 |
| 17 | 3.5386 | 3.6956 | 0.01 | 0.8475 |
| 18 | 3.6959 | 3.8072 | 0.01 | 0.6202 |
| 19 | 3.8075 | 3.9102 | 0.01 | 0.6901 |
| 20 | 3.9105 | 4.0040 | 0.01 | 0.9469 |
| 21 | 4.0043 | 4.2048 | 0.01 | 0.9058 |
| 22 | 4.2051 | 4.6216 | 0.01 | 0.7484 |
| In order to reconstruct these regions, an uninterrupted and non-repetitive region setting is needed. The correlation coefficient R is influenced by both interval size and searching range. | ||||
| Searching range | δA: 2.7098 dB: 2.8562 | δA: 2.6098 dB: 2.8562 | δA: 2.7598 dB: 2.8562 | |
| 0.005 | 0.7994 | 0.4632 | 0.7447 | |
| 0.01 | 0.8236 | 0.6742 | 0.8429 | |
| 0.02 | 0.8581 | 0.8493 | 0.8426 | |
| 0.04 | 0.7779 | 0.8517 | 0.7659 |
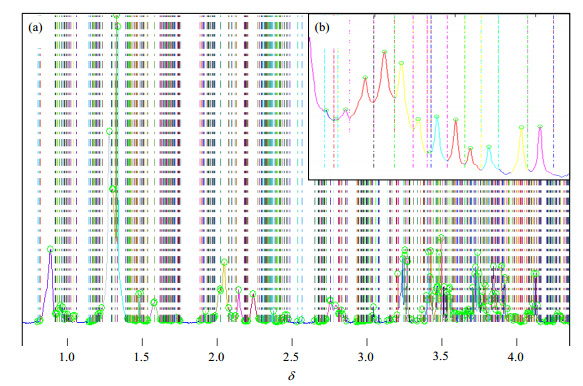
To generate relevant peaks with a meaningful characteristic corresponding to chemical compound or the overlapping of several compounds,the peak extraction processing method is extremely important[14, 18]. The original data always include a great deal of meaningless information (noise). Thus the crux of this step is to remove this information or combine it to the meaningful peaks. In the rat plasma spectrum,a region of 4.0 spectral region (from δ4.50 to 0.50) was selected. Using the upper peak extracting method,there were 1 162 peaks or noise peaks (mostly noise) selected. This should cause a tremendous burden for further data analysis. However,a noise value was set to 15 000,the total number of variables was dramatically decreased to 395 (Fig. 4). Here the noise value was set manually according to the characteristic of the spectra. The whole peak dataset contains the signal intensities,the reference chemical shift and the peak region. All these variables were exported to Excel,and could be converted to other formats,for adapting all kinds of further statistical analysis[19].

|
| Fig. 4 Results of the peak extraction of the rat plasma NMR spectra. (a) a 4.0 spectral region (from δ4.50 to 0.50); (b) the enlargement of the peaks information mainly centered at 1.00 in (a). The x-axis is the chemical shift; the y-axis is the peak intensity. The circle means the acme of a peak. And the dotted lines represent the peak regions |
The spectrum alignment method was also applied to the spectra of the wine samples which were used to evaluate the efficiency of the spectrum alignment before[3, 4, 20]. According to the literature retrieval,the best correlation coefficients for these spectra were 0.98 with the GPA (Gaussian smoothing algorithm) method[20]. The correlation coefficient was improved to 0.99 with this new method (data are not shown). Thus this method can be better than other algorithms.
3 LimitationsThe current study provides a new approach for spectrum alignment and peak extraction for one dimensional NMR spectroscopy. It is fast and efficient. However,it also has a limitation. The searching region was defined manually. As the NMR spectra are diverse,and the influence of the environment is unpredictable,we hope this can be set automatically in the further study.
4 ConclusionThe algorithm presented in this work provides a computationally efficient and versatile tool for the one-dimensional metabolomics NMR spectroscopy. Although there is a limitation in the procedure of the spectrum alignment,it has better alignment efficiency in various samples. Furthermore,the operator needs only little experience in data analysis or computer skills. It also provides a new variable selection method: peak extraction approach for NMR spectroscopy analysis. This method dramatically decreases the number of the variables for metabolomics study,and each variable has their own chemical information. This should be useful for data interpretation during the NMR analysis. Owing to open source Matlab environment,other researchers can write their personalized code for their own requirement,and establish a set of suitable methods for their own research areas easily.
Acknowledgement: The authors would like to thank all members of the Xu lab and the platform staff,Wuhan Institute of Physics and Mathematics,Chinese Academy of Science. The work was supported by National Natural Science Foundation of China (21105116).| [1] | Jacob D, Deborde C, Moing A. An efficient spectra processing method for metabolite identification from 1H NMR metabolomics data[J]. Anal Bioanal Chem, 2013, 405(15):5 049-5 061. |
| [2] | DeHaven C, Evans A M, Dai H, et al. Software techniques for enabling high throughput[J]. Metabolomics. InTech, Rijeka, 2012:167-192. |
| [3] | Larsen F H, van den Berg F, Engelsen S B. An exploratory chemometric study of 1H NMR spectra of table wines[J]. J Chemom, 2006, 20(5):198-208. |
| [4] | Nicholson J K, Lindon J C, Holmes E. 'Metabonomics':understanding the metabolic responses of living systems to pathophysiological stimuli via multivariate statistical analysis of biological NMR spectroscopic data[J]. Xenobiotica, 1999, 29(11):1 181-1 189. |
| [5] | Yao J W, An Y P, Long J, et al. NMR analysis of metabonomic fingerprints and footprints of HepG2 cells[J]. Chinese J Magn Reson, 2013, 30(4):488-498. |
| [6] | Chen L, Song K, Wang Y L. Effects of attenuated salmonella typhimurium infection on fecal metabonome in mice-comparison between WIPM and Bruker 500 MHz NMR spectrometers[J]. Chinese J Magn Reson, 2014, 31(3):349-363. |
| [7] | Savorani F, Tomasi G, Engelsen S B. icoshift:A versatile tool for the rapid alignment of 1D NMR spectra[J]. J Magn Reson, 2010, 202(2):190-202. |
| [8] | Brekke T, Kvalheim O M, Sletten E. Prediction of physical properties of hydrocarbon mixtures by partial-least-squares calibration of carbon-13 nuclear magnetic resonance data[J]. Anal Chim Acta, 1989, 223(0):123-134. |
| [9] | Wishart D S. Quantitative metabolomics using NMR[J]. TRAC Trends Anal Chem, 2008, 27(3):228-237. |
| [10] | Forshed J, Schuppe-Koistinen I, Jacobsson S P. Peak alignment of NMR signals by means of a genetic algorithm[J]. Anal Chim Acta, 2003, 487(2):189-199. |
| [11] | Zhang Z M, Liang Y Z, Lu H M, et al. Multiscale peak alignment for chromatographic datasets[J]. J Chromatogr A, 2012, 1 223:93-106. |
| [12] | Nielsen N P V. Aligning of single and multiple wavelength chromatographic profiles for chemometric data analysis using correlation optimised warping[J]. J Chromatogr A, 1998, 805:17-35. |
| [13] | Veselkov K A, Lindon J C, Ebbels T M D, et al. Recursive segment-wise peak alignment of biological 1H NMR spectra for improved metabolic biomarker recovery[J]. Anal Chem, 2009, 81(1):56-66. |
| [14] | Serkova N J, Niemann C U. Pattern recognition and biomarker validation using quantitative 1H NMR-based metabolomics[J]. Expert Rev Mol Diagn, 2006. 6(5):717-731. |
| [15] | Stoyanova R, Nicholls A W, Nicholsm J K, et al. Automatic alignment of individual peaks in large high-resolution spectral data sets[J]. J Magn Reson, 2004, 170(2):329-335. |
| [16] | Wong J W H, Durante C, Cartwright H M. Application of fast Fourier transform cross-correlation for the alignment of large chromatographic and spectral datasets[J]. Anal Chem, 2005, 77(17):5 655-5 661. |
| [17] | Pearce J T, Athersuch T J, Ebbels T M D, et al. Robust algorithms for automated chemical shift calibration of 1D 1H NMR spectra of blood serum[J]. Anal Chem, 2008, 80(18):7 158-7 162. |
| [18] | Serkova N. ANYL 208-Pattern Recognition and Biomarker Validation Using Quantitative 1H NMR Based Metabolomics[C]. Abstracts of Papers of the American Chemical Society, USA, 2006. 232. |
| [19] | Forshed J, Torgrip R J O, Aberg K M, et al. A comparison of methods for alignment of NMR peaks in the context of cluster analysis[J]. J Pharm Biomed Anal, 2005, 38(5):824-832. |
| [20] | He H, Ling L D, Ling Z, et al. New algorithm for peak alignment of nuclear magnetic resonance[J]. Electro-Optic Technology Application, 2013. |
 2015, Vol. 32


