文章信息
- 许美凤,方均建,董芳霆,颜贤忠
- XU Mei-feng, FANG Jun-jian, DONG Fang-ting, YAN Xian-zhong
- 基于NMR指纹谱相关分析的生物类似药高级结构评价
- Higher Order Structure Assessment of Biosimilars Based on the Correlation of NMR Spectral Fingerprints
- 波谱学杂志, 2015, 32(2): 342-353
- Chinese Journal of Magnetic Resonance, 2015, 32(2): 342-353
- http://dx.doi.org/10.11938/cjmr20150216
-
文章历史
- 收稿日期:2015-02-16
- 收修改稿日期:2015-05-08
Biosimilar is a quite hot concept in biopharmaceutical market in recent years. It is emerging with the approaching of patent expiration time of many originator biologic drugs. Many pharmaceutical companies are pursuing the opportunity to develop biosimilar drugs to substitute for original biologics. The development of biosimilar will build up a win-win situation both to patients and manufacturers. It will help manufacturers to save production time and cost, thus resulting in decreasing biological treatments cost and getting patients a better chance of surviving [1]. Regulatory guidelines and standards for biosimilars have been introduced around the world. The most recognized definition for biosimilar is described as “comparable or highly similar to reference products in terms of safety, purity and potency” which is proposed by European Medicines Agency (EMA) [2] and U.S. Food and Drug Administration (FDA) [3]. The quality comparison between the biosimilar and its originator is crucial for safety and efficacy. Within the large number of quality attributes, physicochemical characterization of biosimilars is still a difficult issue for biologics. It requires sophisticated analytical tools to detect the possible attribute differences between biosimilar and its originator. An array of state-of-the-art analytical techniques has been proposed, including mass spectrometry, Fourier transformed infrared spectroscopy, capillary electrophoresis, size-exclusion chromatography, circular dichroism, fluorescence, ultraviolet spectroscopy and peptide mapping [4, 5, 6]. All these methods are trying to develop a comprehensive fingerprinting of a biosimilar product. However, unlike chemically synthesized small-molecule drugs, the complex nature of biologics requires an assessment of their higher order structure as an essential part of similarity verification in the absence of skeletal structural changes. The higher order structure of biotherapeutics, especially monoclonal antibodies of large molecular weight, directly affects the way thatbiotherapeutics function.
Two kinds of analytical techniques have been applied to higher order structure comparison. Hydrogen deuterium exchange MS (H/DX-MS) has been demonstrated in the biopharmaceutical comparability studies with advantages of high-resolution, high sensitivity with only picomoles of protein needed [7] . However, this technology merely interrogates molecule with peptide level resolution and requires high dilution or other conditions that are different from the original environment of the formulated product, which will cause conformational changes in the analyzed protein. Therefore, analytical characterization techniques that do not significantly alter the formulation matrix of a therapeutic protein are highly valued. NMR spectroscopy is a technique with a long history in protein structural and dynamics studies. It can give three-dimensional structure of proteins at atomic level and is exquisitely sensitive to subtle changes in protein structure because the proton chemical shifts and line shapes are sensitive to the spatial arrangement of amino acids [8, 9]. With the advances in instruments, software and methodologies, NMR spectroscopy is providing more information than ever on the higher order structure of proteins. One advantage of NMR measurement is reflected in detecting biopharmaceutical samples at formulated state without any complicated sample pretreatment. Only a few microliters of deuterated oxide are added for the internal lock signal. This could be of high value especially for protein samples. Several researches have been carried out to compare higher order structure of biosimilar proteins, such as insulins [10, 11], interferon [12], rhGM-CSF [13], Rituximab [14], antibody domains [15], human monocl onal antibodies [16] utilizing 1D and 2D NMR methods. However, most studies of biosimilars based on NMR method are so far limited to qualitative comparison. If a quantitative method for similarity calculation is developed, NMR spectroscopy could be more useful in biosimilar structure study.
Amezcua and Szabo introduced a simple statistical method in the similarity comparison of the higher order structures of biopharmaceuticals based on their NMR fingerprints [8]. The coefficient of determination R2 of regression model was used as a measure of spectral similarity. This parameter is a statistical measure of the goodness of fit in regression analysis and the explanative capability of regression line to the total Y data. In fact, the similarity between two sets of spectral data should be subject to correlation analysis first, and judged by correlation coefficient r. In the present study, this method was applied to the similarity assessment of higher order structure of a small lipopeptide antibiotic daptomycin and a formulated antibody Trastuzumab based on their 1H NMR fingerprints, with the combined use of correlation analysis and regression analysis to construct a reliable and comprehensive similarity assessment system. 1 Experimental method 1.1 Instruments and reagents
All experiments were performed on a Varian INOVA600spectrometer operating at 599.62 MHz for proton frequency using a 5 mm triple resonance probe. Deionized water was obtained from Millipore Milli-Q water device. Deuterium oxide and 3-(trimethylsilyl) propionic-2, 2, 3, 3-d4 acid (TSP) were bought from Sigma-Aldrich Corporation. The originator Cubicin (daptomycin injection), its biosimilar API and injection samples were from a provider. Both originator drug and biosimilars were provided as lyophilized powder. Herceptin and its biosimilar (4 lots) were from another provider and provided as formulated and lyophilized powder. 1.2 NMR sample preparation
Three daptomycin samples were used in this study. The daptomycin injection samples contained peptide active ingredient and minor quantity of excipient NaOH, while API sample
had only peptide active ingredient. Test solutions were prepared by dissolving 6.4 mg daptomycin powder in 4 mL H2O/D2O (95:5) with the peptide final concentration atapproximately 1 mmol/L, and then 500 μL solution was transferred into 5 mm NMR tube. For antibody drug comparison, Herceptin (Roche) and 4 lots of biosimilar samples were used. For each sample, 20 mg lyophilized powder was directly dissolved in 500 μL H2O/D2O(95:5) without any further treatment, the resulting formulation solution contained 0.15 mmol/L Trastuzumab, 4.65 mmol/L histidine, 54.4 mmol/L a, a-trehalose dihydrate, 0.08 mmol/L polysorbate 20. 1.3 NMR spectroscopy
All experiments were acquired with 1D NOESY pulse sequence (RD-90°-t1-90°-tm-90°-acquisition) with a relaxation delay of 2.0 s, a fixed t1 of 11 μs and a mixing time (tm) of 100 ms. On-resonance saturation was used to suppress the water signal during the relaxation delay and mixing period. For daptomycin samples, the spectra were recorded at 27 ℃ with a 90° pulse width of 6.8 μs, a spectral width of 8 625 Hz, the data points of 64 k, and a number of scans of 256, resulting in a total acquisition time of 26 min. For the Herceptin samples, the experiments were carried out at 40 ℃. All 1H NMR spectra were recorded with acquisition parameters of a 90° pulse width of 7.25 μs, a spectral width of 9 000 Hz, the data points of 32 k and a number of scans of 512, resulting in a total acquisition time of 34 min. The 1D NOESY 1H NMR spectra were manually phased and baseline corrected. TSP was used as internal chemical shift reference standard at δH 0.0. All spectra were processed using the VNMR 6.1C software package. 1.4 Spectral binning and similarity calculation
Spectral binning was carried using VNMR 6.1C software package. The integrated data of all bins were normalized to the total integrals of the spectra. The statistical analysis of spectral similarity was carried out by using in-house written in the MATLAB R2010a environment (The Mathworks, Inc.). 2 Results and discussion
Biotherapeutics encompass a wide range of molecule type and size. Here we examined two kinds of molecules ranging from small peptide of 1 620 up to monoclonal antibody of 145 423. 1D NOESY 1H NMR spectra were recorded and NMR data was exported to a similarity calculation program for further quantitative assessment of spectral similarity between biosimilar and its originator product. 2.1 Daptomycin
Daptomycin is a cyclic lipopeptide of 13 amino acids with a molecular weight of 1 620. Three daptomycin samples, denoted as originator injection, biosimilar injection and biosimilar API, were used for comparison. The injection samples contained peptide active ingredient and a minimal quantity of excipient NaOH, whereas the API sample only consisted of peptide active ingredient. 1D NOESY 1H NMR was used to assess the spectra and structural similarity between daptomycin biosimilars and its originator product.
Fig. 1 shows the 1H NMR spectra of three daptomycin samples: (a) originator injection, (b) biosimilar injection and (c) biosimilar API. Each spectrum can be divided into three typical regions: exchangeable amide and aromatic protons (δH 6.5-10.5), a-protons of amino acids (δH 3.5--4.5) and aliphatic side-chain protons (δH 0.5-3.5). Apparent differences in all three proton regions of these spectra can be found by direct comparison. The originator injection provided the best signal-to-noise ratio and spectral resolution, whereas the biosimilar API gave the poorest. Linewidths of both biosimilar samples are much larger than originator injection, which might be an indication of higher degree of aggregation in solution.

|
| Fig. 1 11H NMR spectra of daptomycin samples: (a) originator injection, (b) biosimilar injection, and (c) biosimilar API |
Visual examination of structural similarity of the 1H NMR spectra showed that the biosimilar injection has higher similarity to the originator injection than biosimilar API; this is reasonable since both injection samples contain excipient, while the API doesn’t. The pH values of originator injection, biosimilar injection and biosimilar API were measured to be 5.2, 4.6 and 3.1 respectively. Lower pH value makes peptide prone to aggregate in the biosimilar API sample. It is necessary to compare higher order structure of biotherapeutics under the same condition.
In order to quantitatively describe the degree of similarity between biosimilar and originator products, the spectra of amide proton region (δH 6-10.6) and aliphatic proton region (δH 0.6-3.7) were binned and normalized for statistical analysis. The width of each bin is 0.004. a-proton region was disturbed seriously by water signal and thus was excluded. The exchangeable amide protons and side-chain protons were sensitive to structure variations and were used as a fingerprint of peptides.
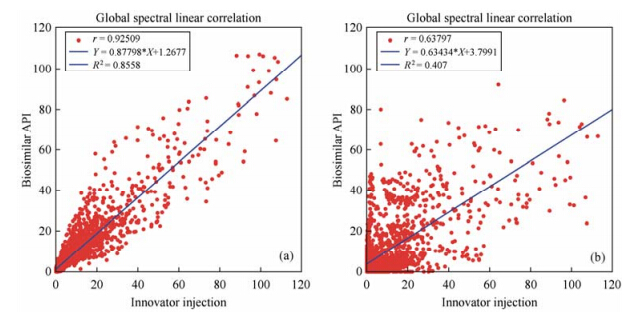
Fig. 2 shows correlations of the normalized 1H NMR data between originator injection and biosimilar injection (a) and originator injection and biosimilar API (b). The scatter plots showed that the distribution of data points in Fig. 2(a) is much more concentrated than that in Fig. 2(b), which indicates the correlation between biosimilar injection and originator injection is much better than that of biosimilar API and originator injection. The correlation coefficients (r) of the two series data were calculated with values of 0.925 and 0.638, further demonstrating that the spectra data of biosimilar injection is more similar to originator injection. Linear regression analysis was used to fit the data and the coefficients of determination (R2) which are commonly used to describe the goodness of linear regression were calculated. The R2 value between biosimilar injection and originator injection is 0.856, while R2 value between biosimilar API and originator injection is only 0.407. Higher R2 value indicates better explanative capability of regression line to the total Y data, further supports the above result. The higher r and R2 values are, the more similar the spectra and peptide structures are. Therefore, by analyzing the relationship of NMR spectrum with the two coefficients, one can quantitatively describe the similarity between two spectra, which make comparison results more comprehensive and reliable.
|
| Fig. 2 Linear correlation plots based on normalized 1H NMR data for (a) biosimilar vs. originator injection and (b) biosimilar API vs. originator injection of daptomycin |
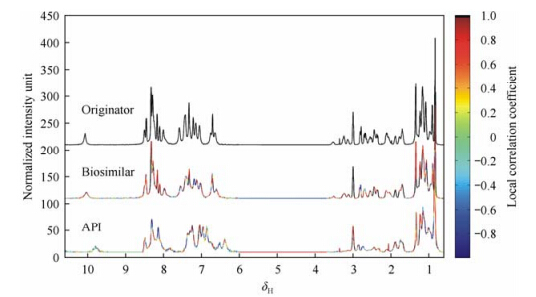
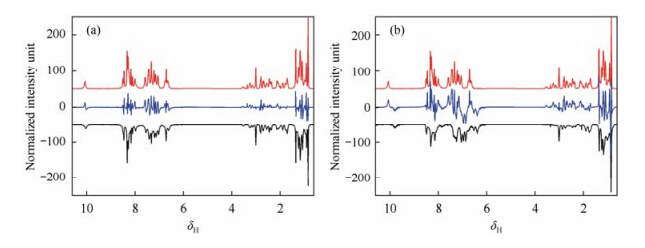
To further identify the minor differences between biosimilars and originator and to specify the regions that contribute to these differences, a local spectral correlation method is applied by comparison of the binned data of biosimilar and originator section-by-section. Fig. 3 shows the stacked spectra of biosimilar and originator daptomycin samples with colors coding the local correlation coefficients. Many spectral regions from biosimilar injection have high local correlation coefficients with the originator, while only a small part of spectral regions from biosimilar API have high local correlation coefficients, demonstrating their different similarities to the originator. Although both injection samples have excipients, and thus have similar pH values and similar structures, lower pH value for biosimilar injection sample still resulted in broader linewidth, which might be caused by aggregation. Therefore, few regions have low local coefficients. However, the biosimilar API sample has much larger pH difference from the originator injection sample due to its lack of excipients, resulting in some major differences in structure and thus a wide range distribution of lower local coefficients. Through these local correlation comparisons, signals that contribute to minor differences between biosimilar and originator can be found out. These signal regions can also be presented in the form of difference spectra between the originator and the biosimilars as shown in Fig. 4.
|
| Fig. 3 Local linear correlation graphs of normalized 1H NMR data of daptomycin samples |
|
| Fig. 4 Difference spectra (blue) between (a) originator injection (red) and biosimilar injection (black) and (b) originator injection (red) and biosimilar API (black) |
Herceptin with active ingredient Trastuzumab is used to treat patients with metastatic breast cancer. Trastuzumab is a recombinant humanized monoclonal antibody with a molecular weight of 145 423, which is considered as a large protein for traditional NMR structural characterization analyses. The excipients include L-histidine HCl, L-histidine, a, a-trehalose dihydrate and polysorbate 20. In this part, one Herceptin sample and four lots of biosimilar samples were analyzed. As a control, the Herceptin sample was measured three times, denoted as con-1, con-2 and con-3.The four biosimilar samples were marked as biosimilar lot-1, lot-2, lot-3 and lot-4. Lyophilized powder of each sample was directly dissolved as its formulated state without any further sample extraction or purification that may affect the integrity of the sample.
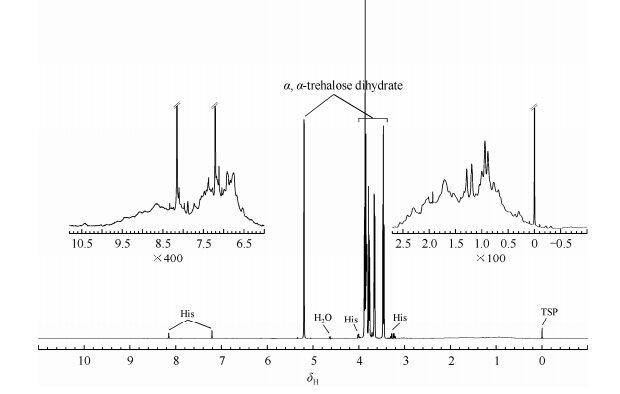
Fig. 5 shows the 1D NOESY 1H NMR spectrum of Herceptin. Stabilizing excipients, especially a, a-trehalose, have very strong NMR signals. The inserts show two enlarged regions of NMR signals of the protein. Comparing to NMR signals of small molecular weight excipients, protein signals seem to be too broad and crowded to be assigned. In order to analyze the similarity between the biosimilar and the originator, signals from excipients should be excluded. Pulsed field gradient stimulated echo (PGSTE) experiment based on the difference in translational diffusion coefficients of molecules can be used to eliminate signals originating from excipients in formulated drugs [16]. Therefore, 1D PGSTE experiment was carried out on Herceptin formulated solution. However, the residue signals from a, a-trehalose could not be sufficiently suppressed even when the protein signals were almost completely attenuated at very strong gradient (data not shown). This might be due to the much higher excipient concentration (trehalose accounts for more than 45% of the content) than that as reported in other biotherapeutics [16]. Therefore, PGSTE experiment was not used in the final analysis of Herceptin and its biosimilars.
|
| Fig. 5 1H NMR spectrum of Herceptin originator sample |
Fig. 5 shows that the protein signals of a-proton region (δH 3.5-4.5) as well as amide and aromatic proton region (δH 6-11) are covered by the signals of a, a-trehalose and histidine, making them unsuitable for similarity calculation. However, the signals of the aliphatic proton region (δH 0.07-2.7) were unaffected and can be chosen as reporters of protein conformation. They can provide fingerprint information on local conformational perturbations in a background of broad and unassigned signals. The spectra of the aliphatic proton region (δH 0.07-2.7) were binned and normalized for further statistical analysis.
Table 1 shows correlation coefficients (r) pairwise calculated from all Herceptin and biosimilar samples. For the Herceptin sample, three data sets were compared to each other to establish a coefficient baseline. The r values of three originator data sets are all 1 000, further demonstrating that 1H NMR is an analytical method of high reproducibility and is reliable for spectral comparison of molecules not only with small molecular weight but also with large molecular weight like monoclonal antibody. Instrument error contributes little to the change of correlation coefficient. Any factor making correlation coefficient deviating from baseline might be due to the changes of the molecular structural characteristics or its microenvironment.
For the biosimilar samples, one can see from Table 1 that biosimilar lot-2 shows the highest r value of 0.990 and R2 value of 0.978, indicating that the fingerprint of the sidechain of biosimilar lot-2 is almost indistinguishable from that of the originator. However, r and R2 values of biosimilar lot-4 are much lower than that of the others, indicating some possible conformational difference from the originator.
| r | R2 | ||||||||
| Originator | Biosimilar | ||||||||
| con-1 | con-2 | con-3 | lot-1 | lot-2 | lot-3 | lot-4 | |||
| Originator | con-1 | 1.000 | 1.000 | 1.000 | 0.909 | 0.979 | 0.964 | 0.739 | |
| con-2 | 1.000 | 1.000 | 1.000 | 0.909 | 0.979 | 0.964 | 0.738 | ||
| con-3 | 1.000 | 1.000 | 1.000 | 0.909 | 0.979 | 0.964 | 0.739 | ||
| Biosimilar | lot-1 | 0.954 | 0.954 | 0.954 | 1.000 | 0.942 | 0.979 | 0.917 | |
| lot-2 | 0.990 | 0.990 | 0.990 | 0.971 | 1.000 | 0.988 | 0.778 | ||
| lot-3 | 0.982 | 0.982 | 0.982 | 0.990 | 0.994 | 1.000 | 0.852 | ||
| lot-4 | 0.859 | 0.859 | 0.859 | 0.958 | 0.882 | 0.923 | 1.000 | ||
The local spectral correlation method was also applied to the analysis of subtle differences between Herceptin and its biosimilar samples. Fig. 6 shows the stacked spectra of the aliphatic proton region (δH 0.07-2.7) of four biosimilars as well as the originator with color coded local correlation coefficients. Almost all signals, except a triplet at δH 1.19 (J = 7.01 Hz) and a singlet at δH 1.93, from biosimilars have very high local correlation coefficients with the originator. These two signals, which may come from the residual solvents ethanol and acetic acid during production process, have lower local correlation coefficients with the originator, especially in the spectrum of biosimilar lot-4. This is reasonable since the concentration of residual solvents may vary from lot to lot. The high local coefficients of other signals from protein itself just demonstrate that these proteins have almost identical conformations in solution. The differences of global correlation coefficients mainly come from the different contents of residual solvents in these lots. This is also clearly shown in the difference spectra between Herceptin and its biosimilars (Fig. 7). For these biosimilar samples, their global correlation coefficients are reversely proportional to the intensities of these solvent signals. Through this local correlation analysis, subtle differences in the global correlation coefficients between biosimilar and originator can be attributed to specific spectral regions. This method also provides a potential procedure for discovering unknown impurities in biopharmaceuticals.

|
| Fig. 6 local linear correlation graphs of normalized 1H NMR data of Herceptin and it biosimilar samples |
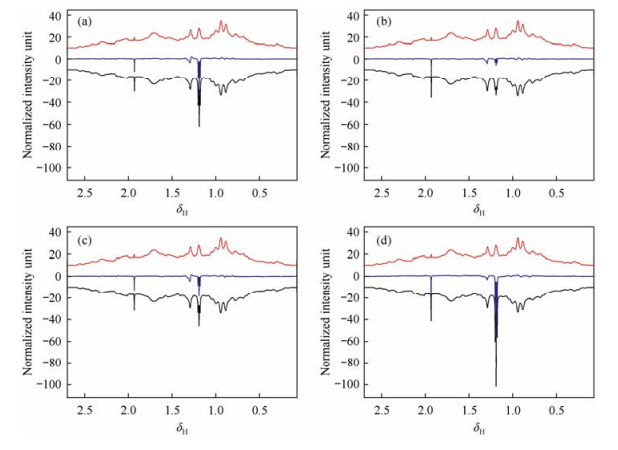
|
| Fig. 7 Difference spectra (blue) between originator Herceptin (red) and biosimilar (black) (a) lot-1, (b) lot-2, (c) lot-3, and (d) lot-4 |
The 1H NMR spectral characteristics of daptomycin peptide and Herceptin monoclonal antibody and their biosimilars have been studied. The results show that 1H NMR can be used as an efficient fingerprint method for characterizing protein conformations in solution. Statistical analysis was applied to compare spectra of biosimilar and its originator. Both r and R2 values from binned NMR data provide information about the global spectral similarity. A local correlation method was used to help find out subtle difference even for highly similar samples. With these ideas, the similarity of biosimilars and their originators of daptomycin peptide and Herceptin monoclonal antibody were analyzed. We successfully distinguished biosimilar with its originator and found differences between them. The quantitative comparison of NMR spectra can provide a powerful assessment of the high order structure of biopharmaceuticals. Although 1H NMR is “sensitivity challenged” as compared to a number of other analytical techniques, it remains a powerful and reliable tool for similarity assessment by proper spectrum analysis. The combination of spectral fingerprint with statistical analysis makes NMR an ideal tool for similarity analysis of biosimilar and its originator, or quality control of lot-to-lot biosimilar in production process.
Acknowledgement: The authors are grateful for the financial support from National Science and Technology Major Project (2014ZX09304311-001, 2012ZX09301003-001-010). We also thank all the suppliers for providing samples used in this study.| [1] | Walsh G. Biopharmaceutical benchmarks 2014[J]. Nat Biotech, 2014, 32(10):992-1 000. |
| [2] | European Medicines Agency, Committee for Medicinal Products for Human Use. Guideline on similar biological medicinal products containing monoclonal antibodies-non-clinical and clinical issues[OL]. London:European Medicines Agency;2012. http://www.ema.europa.eu/docs/en_GB/document_library/Scientific_guideline/2012/06/WC500128686.pdf. |
| [3] | Food and Drug Administration, Center for Drug Evaluation and Research (CDER). Guidance for Industry. Scientific considerations in demonstrating biosimilarity to a reference product[OL]. Rockville:Food and Drug Administration;2012. http://www.fda.gov/downloads/Drugs/GuidanceComplianceRegulatoryInformation/Guidances/UCM291128.pdf. |
| [4] | Berkowitz S A, Engen J R, Mazzeo J R, et al. Analytical tools for characterizing biopharmaceuticals and the implications for biosimilars[J]. Nat Rev Drug Discov, 2012, 11(7):527-540. |
| [5] | Falconer R J, Jackson-Matthews D, Mahler S M. Analytical strategies for assessing comparability of biosimilars[J]. J Chem Technol Biotechnol, 2011, 86(7):915-922. |
| [6] | Federici M, Lubiniecki A, Manikwar P, et al. Analytical lessons learned from selected therapeutic protein drug comparability studies[J]. Biologicals, 2013, 41(3):131-147. |
| [7] | Houde D, Berkowitz S A, Engen J R. The utility of hydrogen/deuterium exchange mass spectrometry in biopharmaceutical comparability studies[J]. J Pharm Sci, 2011, 100(6):2 071-2 086. |
| [8] | Amezcua C A, Szabo C M. Assessment of higher order structure comparability in therapeutic proteins using nuclear magnetic resonance spectroscopy[J]. J Pharm Sci, 2013, 102(6):1 724-1 733. |
| [9] | Wishart D S. Characterization of biopharmaceuticals by NMR spectroscopy[J]. TrAC-Trends Anal Chem, 2013, 48:96-111. |
| [10] | Quinternet M, Starck J P, Delsuc M A, et al. Heteronuclear NMR provides an accurate assessment of therapeutic insulin's quality[J]. J Pharm Biomed Anal, 2013, 78/79:252-254. |
| [11] | Jin X, Kang S, Kwon H, et al. Heteronuclear NMR as a 4-in-1 analytical platform for detecting modification-specific signatures of therapeutic insulin formulations[J]. Anal Chem, 2014, 86(4):2 050-2 056. |
| [12] | Panjwani N, Hodgson D J, Sauve S, et al. Assessment of the effects of pH, formulation and deformulation on the conformation of interferon alpha-2 by NMR[J]. J Pharm Sci, 2010, 99(8):3 334-3 342. |
| [13] | Sauve S, Gingras G, Aubin Y. Assessment of the three-dimensional structure of recombinant protein therapeutics by NMR fingerprinting:demonstration on recombinant human granulocyte macrophage-colony stimulation factor[J]. Biomol NMR Assign, 2008, 2(1):5-7. |
| [14] | Visser J, Feuerstein I, Stangler T, et al. Physicochemical and functional comparability between the proposed biosimilar Rituximab GP2013 and originator Rituximab[J]. Biodrugs, 2013, 27(5):495-507. |
| [15] | Vu B K, Walsh J D, Dimitrov D S, et al. Dynamics of antibody domains studied by solution NMR[J]. Methods Mol Biol, 2009, 525:533-543, xv. |
| [16] | Poppe L, Jordan J B, Lawson K, et al. Profiling formulated monoclonal antibodies by 1H NMR spectroscopy[J]. Anal Chem, 2013, 85(20):9 623-9 629. |
 2015, Vol. 32


