文章信息
- 肖婷,姚叶锋
- XIAO Ting, YAO Ye-feng
- 半晶聚乙烯局部和整体分子链运动的固体核磁共振研究
- Local and Collective Chain Motions in Semi-Crystalline Polyethylenes-A Solid-State NMR Approach
- 波谱学杂志, 2015, 32(2): 208-227
- Chinese Journal of Magnetic Resonance, 2015, 32(2): 208-227
- http://dx.doi.org/10.11938/cjmr20150206
-
文章历史
- 收稿日期:2015-02-12
- 收修改稿日期:2015-05-11
Molecular dynamics is ofrelevance to the macroscopic mechanical properties of polymeric material like semi-crystalline polyethylenes (PEs)[1]. For example, the origin of the g-relaxation process of PE is considered to be related to the conformation transitions in the non-crystalline regions[2, 3]; the chain diffusion between crystalline and non-crystalline regions of semi-crystalline PE is related to the crystal thickening, ultra-high drawability and the crystalline a-relaxation process of semi-crystalline PE[4]. Understanding the relationship between the microscopic molecular dynamics and the macroscopic property has been of great interest in the past decades and has been reviewed extensively[5, 6, 7, 8, 9, 10]. On probing the chain dynamics in polymer systems, solid state NMR has been proved to be a pa rticularly useful technique[11, 12, 13]. The merit of solid state NMR lies on its capability of monitoring the molecular motions over a wide frequency range from less than Hz to over MHz[14, 15]. Moreover, by utilizing advanced solid-state NMR spectroscopic methods, the molecular dynamics in a polymer system can be studied in a group-/site-selective fashion, providing a “close”/“in-site” view of molecular motion[16]. This is a unique advantage of solid state NMR technique compared with the other analytical techniques such as mechanical or viscoelastic measurements which often even suffer difficulty in resolution of the contributions among the different phase components.
In this review paper, we will briefly survey recent results on the solid state NMR study of chain motions in semi-crystalline PEs. We will demonstrate that the state-of-the-art solid state NMR now can provide very detailed knowledge about the local and collective chain motions in a polymer system which will greatly deepen our understanding of the mechanical behaviors of polymeric material in the microscopic level. The discussion in this paper is arranged as the following: First, we will give a short introduction of the microstructure of semi-crystalline PE. Then follows a review of recent progresses in the solid state NMR study of the local chain motions in the non-crystalline and crystalline regions of semi-crystalline PE. The morphological influence on the chain dynamics will be focused in this part. Afterwards, the solid state NMR study of the collective chain diffusion between crystalline and non-crystalline regions of PE will be reviewed. In the final part of this paper, the correlation between the local motions and the chain diffusion will be discussed. 1 Microstructures of semi-crystalline PE
As a typical semi-crystalline polymer, the microstructure of semi-crystalline PE is often described by a two-component model of crystalline components embedded in a matrix of non-crystalline part[17, 18, 19]. In this model, non-crystalline chains are usually believed to approach random coil conformations and crystalline chains take regular conformations and align parallel to each other to fulfill the requirement of crystal lattice. Beside the non-crystalline regions and regular crystalline regions, a third component with intermediate order has been proposed to explain some special physical properties of polymers, such as the unexpected high density of non-crystalline regions[20]. Because of the simple chemical nature, the PE chains have no special interactions such as H-bonding[21], p-pstacking[22]. The partially ordered component in non-crystalline regions thus is believed to be present only in the crystalline/non-crystalline boundary[23, 24]. This component thus is often called as the interfacial component referring to its location. The introduction of this partially ordered non-crystalline component is necessary, because this component can avoid the discontinuity in molecular order at the crystalline/non-crystalline i nterface. The presence of the interfacial component also means that a sharp demarcation line between crystalline and non-crystalline regions is very unlikely. In literatures, the existence of partially ordered component in non-crystalline regions of PE has been proven from both theoretical[25, 26, 27] and experimental work[28, 29, 30, 31, 32].
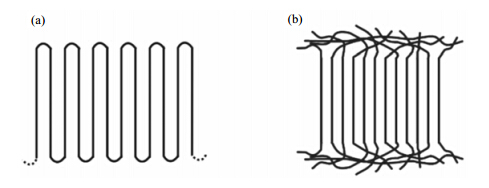
The microstructure of semi-crystalline PE strongly depends on the crystalline conditions. It is a well-established and proven fact that when a linear PE sample is crystallized from dilute solution, it forms thin crystalline lamellae with the chain axis, i.e. the crystallographic c axis in the lattice, approximately perpendicular to the lamellar surfaces[33]. The lamellar thickness is found to be in the range of 10-30 nm, which is usually much smaller than the length of a fully extended chain. Formation of such crystals invoked the concept known as chain folding, that is, long chains fold back and forth to form crystalline lamellae and folded regions give rise to non-crystalline regions. Concerning the way how PE chains fold back from non-crystalline regions and re-entry into crystalline lamellae, people have proposed two models, which are illustrated in Fig. 1.
|
| Fig. 1 Schematic representation of models of PE morphologies: (a) adjacent reentry with sharp folds; (b) the switchboard model |
The model (a) in Fig. 1 is called the adjacent re-entry mode, which means that the chains travel from the crystalline lamellae to the non-crystalline region and then fold back with a re-entry into the same crystallite through the neighboring exit point. This model is usually used to describe the morphology of PE crystallized from dilute solution, where the fully disentangled chains can easily organize themselves to make regular chain folding during the crystallization process. The non-crystalline regions are formed by the chain folding in this case.
The model (b) in Fig. 1 usually is supposed to be close to the morphology of PE developed from melt crystallization[34]. In melt crystallization, crystals are formed from completely random and highly entangled molecular chains. Due to the kinetic reason it is almost impossible for the chains to get disentangled and form the regular folds as occurring in solution crystallization process. Therefore, if crystallized from melt, polymer chains are most likely to either fold back with a random re-entry or traverse the non-crystalline region between the different crystallites. The morphologies developed in melt crystallization thus are close to the switchboard model (b)[35]. 2 The local chain motions in semi-crystalline PEs 2.1 Segmental motions in non-crystalline regions
As mentioned above, the chain packing arrangement in the noncrystalline regions of PE may vary significantly, depending on the crystallization condition of the materials. Reflecting the influence from the chain packing arrangements, the segmental motions are likely to be different in the non-crystalline regions of the PE materials developed from different crystallization conditions. In literature, the non-crystalline segmental motions of semi-crystalline PE have been probed by 13C NMR in various ways, where all are based on the fact that conformational motions with correlation times below 10 ms also average the local interactions determining the NMR spectrum:
i. The presence of different local conformers and exchange between them is reflected in the isotropic chemical shift accessible in 13C MAS NMR spectra[36, 37, 38].
ii. Geometrical restrictions of the conformational transitions are probed via anisotropic NMR interactions, i.e. 13C-1H dipole-dipole couplings[39, 40], which yield similar information as 2H NMR[11, 13, 41] and 13C chemical shift anisotropy (CSA)[31, 42, 43, 44]. Since they are averaged out under MAS, recoupling techniques must be applied to yield sideband patterns or quasi static NMR spectra, from which residual anisotropies can be determined.
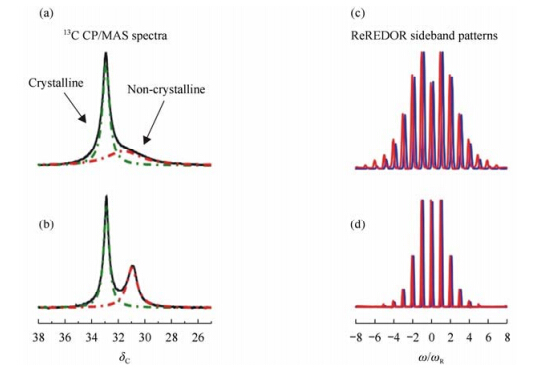
Fig. 2(a) and (b) respectively show 13C CP/MAS spectra of the solution and melt crystallized PE samples at T = 320 K, which is above the static glass transition temperature of PE[47]. In the spectra, the signals observed at ~d 33 with identical line width are assigned to all-trans conformations in the crystalline regions of the samples[37]. In contrast, chain segments in non-crystalline regions of PE are able to adopt various conformations and the molecular dynamics present in these areas leads to a fast exchange between these conformations. The NMR signal thus shows a peak at about d 31, the position and width of which depend on the conformation statistics and the accessibility of the conformational space to dynamic processes present in the non-crystalline areas[36]. Comparison of the spectra of the samples shows clear differences of the non-crystalline signals. The spectrum of the solution crystallized sample shows a broad non-crystalline peak (ΔFWHH = 2.46) at d 31.1, whereas the non-crystalline signal of the melt crystallized sample exhibits a sharper peak (ΔFWHH = 0.99) at d 30.9. Thus, conformation statistics and, in particular, the dynamic behavior of chain segments in these regions show a strong dependence on the crystallization procedure and the resultant morphology. The local dynamics of chain segments in the non-crystalline regions of the solution crystallized sample are apparently more restricted than those in the melt crystallized sample.
|
| Fig. 2 The 13C CP/MAS spectra (6 kHz MAS, 2 ms CP contact) of PEs and ReREDOR[45, 46] sideband patterns (25 kHz MAS, 3 rotor periods recoupling) from the non-crystalline regions, recorded at T = 320 K. The 13C CP/MAS spectra of (a) solution crystallized and (b) melt crystallized PE show two components, the non-crystalline signal (~d 31, red dashed line) and the crystal peak (~d 33, green dashed line). The ReREDOR sideband pattern of non-crystalline, [(c), red line] solution crystallized and of non-crystalline [(d), red line] melt crystallized PE. The underlying blue pattern are simulations with a dipole-dipole coupling constant of DIS/2p = 9.1 kHz for the solution crystallized sample and 6.3 kHz for the melt crystallized sample[40(b)] |
A more quantitative way to study the local chain dynamics in the non-crystalline regions of PE is to monitor the 1H-13C heteronuclear dipole-dipole coupling. The heteronuclear dipole-dipole coupling may differ due to different segmental mobility caused by dynamic processes of the polymer chains in the non-crystalline areas. To quantify the heteronuclear dipole-dipole coupling, the rotor encoded REDOR recoupling sequence has been applied[46]. The resulting ReREDOR sideband patterns for the two samples taken at the isotropic chemical shift of the non-crystalline signals are shown in Fig. 2(c) and (d). The broad profile of the ReREDOR sideband pattern of non-crystalline region of the solution crystallized sample compared to the melt crystallized sample is indicative of stronger dipole-dipole coupling in the solution crystallized sample[40, 48]. The quantitative analysis of the recoupled sideband patterns yields an effective residual heteronuclear coupling constant of 9.1 kHz for the non-crystalline components of the solution crystallized sample compared to 6.3 kHz for the melt crystallized sample. These values correspond to dynamic local order parameters[49] of 0.43 and 0.30, respectively. The higher dynamic local order parameter of the solution crystallized sample results from a more anisotropic molecular motion and thus is indicative of a more restricted local chain dynamics in the non-crystalline region of the sample.
More detailed geometrical information on the dynamic processes can be obtained from the static powder line shape of the 13C chemical shift anisotropy (CSA). Fig. 3 shows the 13C CSA patterns of the two samples recorded at T = 320 K. The patterns of the crystalline components [Fig. 3(a)] are very similar for the two samples, whereas significant differences are observed for the non-crystalline components [Fig. 3(b)]. The 13C CSA powder line shape of the non-crystalline region of the solution crystallized sample shows features of an axially-symmetric tensor, whereas the 13C CSA pattern of the non-crystalline region of the melt crystallized sample is lacking the typical features of a tensorial powder line shape rather resembles a broadened isotropic line. These results indicate that the chains in the non-crystalline regions of the solution crystallized sample undergo a more restricted anisotropic motion close to a locally axial rotation around the chain backbone, whereas the chains in the melt crystallized sample show a more isotropic motion. Note that the 13C CSA tensor of the non-crystalline regions of solution crystallized sample has $\sigma {\kern 1pt} {}_{||}\, \approx {\sigma _{33}}$${\sigma _ \bot } \approx ({\sigma _{11}} + {\sigma _{22}})/2$ .

|
| Fig. 3 The 13C chemical shift anisotropy (CSA) static powder line shape of the two PEs: (a) the crystalline pattern and (b) the non-crystalline pattern. These patterns are taken from the slices of SUPER experiments[50], measured at 3 kHz MAS and T = 320 K. Spectra given in solid black lines were measured with 1H-13C cross-polarization, those given in dashed gray lines were measured via 13C single pulse excitation[40(b)] |
In literature, the presence of an interphase of intermediate order between the non-crystalline and the crystalline phases has been proposed based on both theoretical as well as experimental considerations. In solid state NMR, this aspect can be addressed by varying the initial source of polarization for the CSA recoupling experiment. If the experiment is started with an initial cross polarization (CP) step using a short contact time, the acquired signal predominantly results from sites with a stronger heteronuclear dipole-dipole coupling and thus, in the case of PE, immobile sites are in close proximity to crystalline areas. In contrast, the signals in single pulse experiments with short relaxation delay (2 s) result from more mobile areas of the sample, due to the long 13C T1 relaxation time of crystalline polyethylene (T1 > 1 000 s)[51]. The powder line shapes of the non-crystalline areas of the solution crystallized sample acquired with both experimental approaches match very well, indicating that the observed restricted anisotropic dynamics of the non-crystalline areas of the solution crystallized sample is characteristic of these regions as a whole. In the case of the melt crystallized sample, the Lorentzian line shape obtained from the CP method is somewhat broader than that obtained from single pulse excitation, however, the line shape stays Lorentzian and does not show any features of a powder line shape resulting from an axial-symmetric averaged CSA tensor as observed in the case of the solution crystallized sample. Combining the results from heteronuclear dipole-dipole and CSA recoupling experiments, we conclude that at ambient temperature the conformational exchange in the non-crystalline areas of the solution crystallized sample is highly restricted whereas the conformational space of the polymer chain of the melt crystallized sample seems largely accessible leading to a more isotropic segmental dynamic. 2.2 Segmental motion in crystals — the 180° helical jump
The presence of helical jump in PE crystals was first realized from the so-called a-relaxation process in the dynamic-mechanical relaxation measurements[4, 52]. However, although being proposed for a long time, the direct experimental observation of such a motion has not been achieved until recently. The difficulty lies on the nature of the helical jump motion in PE crystals: It is a 180° helical jump that just inverts the chemical shift, germinal 1H-1H dipolar, 13C-1H dipolar, and 2H quadrupolar tensors without changing the corresponding NMR frequencies. Therefore, the simple exchange NMR is not capable for the detection of the helical jump in PE crystals.
By 2D exchange spectrum of the 13C-13C dipolar coupling in 13C-13C pair labeled PE, the helical jump in PE was first directly observed by Schmidt-Rohr’s group[53], where they monitered the 180° helical jump in terms of the reorientation of 13C-13C internuclear vectors in the crystallites of 5% 13C-13C pair labeled PE. The cartoon picture in Fig. 4(a) illustrates the C-C bonds reorientation process from q1 to q2. During this reorientation process, the dipolar coupling of 13C-13C pair will change the orientation angle and thus the dipolar frequency. The correlation function of the chain reorientation thus can be measured directly in terms of the mixing time dependence of stimulated echoes of the dipolar coupling by the pulse sequence in Fig. 4(b).

|
| Fig. 4 (a) General scheme of a 180° flip in an unoriented sample, producing a great change in the 13C-13C bond orientation from q1 to q2; (b) 2D pulse sequence to detect reorientations of 13C-13C dipolar tensors[53] |
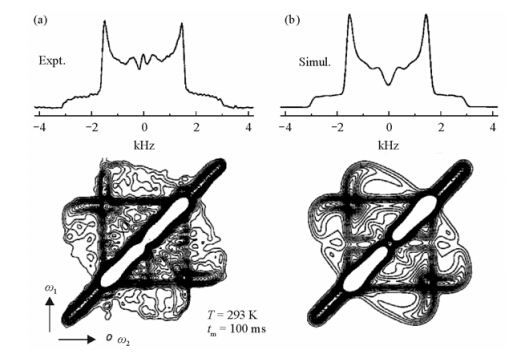
Fig. 5(a) exhibits the experimental dipolar exchange spectrum using the mixing time tm=100 ms. It exhibits intensity far from the diagonal, which indicates large changes in frequency and orientation due to the helical jumps during tm. Fig. 5(b) is the simulated spectrum of the above experiment with a 180° jump rate of 15 s-1. As one can see, this simulated spectrum is very similar to the experimental one. The slightly difference in the asymmetry of the spectra is attributed to the double quantum filtering.
|
| Fig. 5 2D exchange spectrum of the 13C-13C dipolar coupling in 13C-13C pair labeled HDPE. (a) Experimental spectrum, T = 293 K, tm = 100 ms. (b) Corresponding simulation for 180° flips. Thirty contour lines are plotted between 0.8% and 20% of the maximum intensity. The slight asymmetry of the spectrum is due to the double-quantum filter, which does not excite equally the signals for all 13C-13C orientations. Integral projections onto the w2axis are shown at the top[53] |
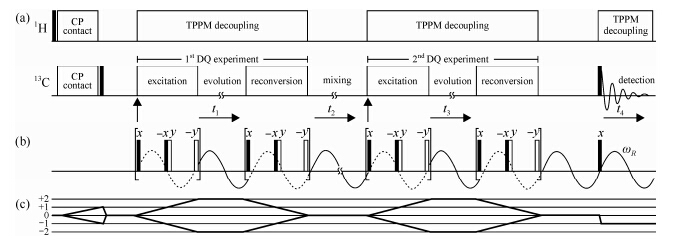
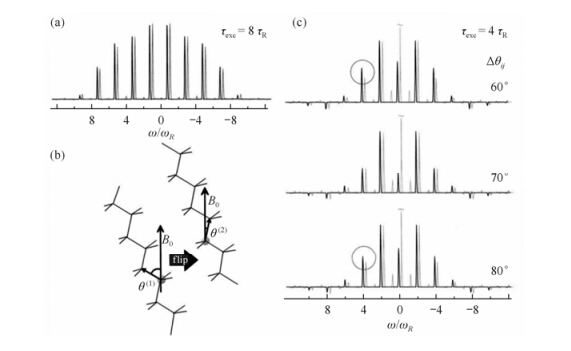
Using the same labeled PE sample, Schnell et al. demonstrated another NMR technique for directly monitoring the 180° jump in PE crystals[54]. The pulse sequence used is exhibited in Fig. 6, which actually is a reduced 3D experiment consisting of two dipolar double-quantum (DQ) MAS experiment blocks. The dipolar coupling between the13C-13C spin pairs is used to generate the DQ coherences in the first and second dimension. The jump motion occurring during the mixing time thus can be monitored via probing the 13C-13C dipolar coupling tensors because of its orientation dependence. Fig. 7(a) shows the 13C-13C DQ MAS sideband pattern from the rotor encoded DQ sideband experiment. Simulation yields a 13C-13C dipolar coupling strength of Dij = 2p (1.89 ± 0.01) kHz. Fig. 7(c) exhibits the sideband patterns obtained using the pulse sequence in Fig. 8. In these sideband patterns, the center band reflects moieties which have remained in, or returned to, their initial position during the mixing time, whereas the sidebands predominantly contain the contributions from the moieties which have undergone a reorientation during the mixing time. Simulation shows that the 13C-13C reorientation angle in the PE crystallites is 70 ± 5°, similar as that observed by Schmidt-Rohr.
|
| Fig. 6 (a) Scheme of a DQ-DQ MAS exchange experiment performed on 13C after a 1H-13C Hartmann-Hahn CP. (b) BaBa recoupling pulse scheme used for the excitation and reconversion of the 13C-13C DQCs under MAS conditions. (c) Coherence transfer pathway of the DQ-DQ MAS exchange experiment, as experimentally selected by a phase cycling procedure[54] |
|
| Fig. 7 (a) Calculated (black) and experimental (gray) 13C-13C DQ MAS sideband pattern for the crystalline phase of polyethylene, yielding a 13C-13C dipolar coupling strength of Dij = 2p ·(1.89 ± 0.01) kHz. (b) 180° chain flip in the crystallites, giving rise to a reorientation of 112° (or 68°) of the 13C-13C dipolar tensor. (c) Calculated (black) and experimental (gray) MAS sideband patterns of “referenced” DQ-DQ exchange experiments. The experimental pattern is recorded for a mixing time of tm = 600 ms at T = 300 K and yields a reorientation angle of (70 ± 5)° for the 13C-13C dipolar tensor. The circles mark the deviations from the patterns calculated for 60° and 80°, respectively, in the sensitive spectral region[54] |
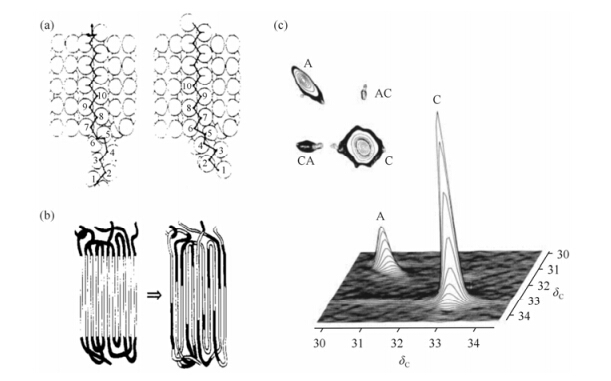
Concerning the chain connectivity, the helical jump in polymer crystals can be considered as good indicative of the presence of chain diffusion between amorphous and crystalline regions. In literature, the first direct experimental evidence for the chain diffusion between amorphous and crystalline regions of semi-crystalline polymer was demonstrated in high molecular weight PE by Schmidt-Rohr and Spiess[55]. Using 2D 13C MAS exchange NMR, they showed a clear exchange process present between the local conformations in the amorphous and crystalline regions of PE at elevated temperatures. Fig. 8(c) is the 2D MAS exchange spectrum of UHMW-PE given in the work (acquired at 363 K with an exchange time of 1 s). The appearance of off-diagonal peak in the spectrum indicates that the large scale chain diffusion between crystalline and amorphous regions occurs on the time scale of several seconds.
|
| Fig. 8 13C CP/MAS 2D exchange spectrum of UHMWPE at 363 K, with a mixing time of 1 s. The intensity of the cross peak (CA) is 2.5% of that of the diagonal peak (C), while the (AC) peak intensity makes up 6% of that in the diagonal peak (A). The former ratio is more decreased by T1 relaxation, so the effect due to exchange amounts to roughly 5%[55] |
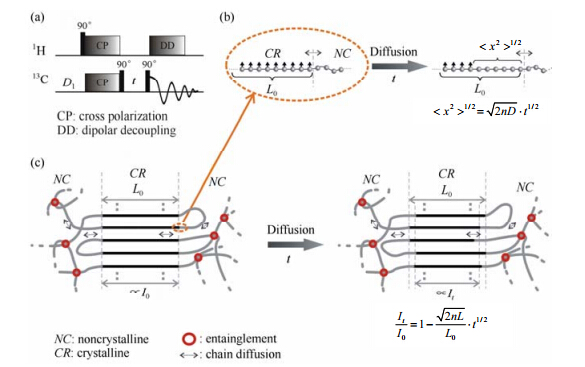
Recent works on the study of the chain diffusion in semi-crystalline PEs have shown that this motion could be easily studied by employing 1D 13C exchange NMR[56]. The pulse sequence used is the same as the “Torchia” pulse sequence[57] [see Fig. 9(a)]. Provided that chain diffusion is the only possible way to depolarize 13C in the crystalline regions of PE for short times t, the decay of crystalline signal monitors directly the chain diffusion. The relation between the change of 13C polarization and chain diffusion in the experiment is illustrated in Fig. 9(b) and 9(c). Eq. (1) describes the relationship between the normalized signal intensity and the diffusion time:
where I0 and It represent the intensity of crystalline signal at the exchange time equal to 0 and t respectively; L0 is the lamellar thickness of crystallite; n is the dimensionality factor of the diffusion and D is the diffusion coefficient. Compared to the previous method, the main advantage of this method is its easiness for quantifying the signal intensity and thus the chain diffusion coefficient.
|
| Fig. 9 (a) Demonstration of the 1D 13C exchange pulse sequence. (b) The cartoon pictures mimic the change of polarization during the experiment, where the small arrows are the representation of polarization and the spheres are the coarse grain representation of the chain segments. The polarization in the crystalline regions is exaggerated for convenience of understanding. (c) Illustration of the polarization decrease resulting from the chain diffusion in solid PE. At one time point, the chain segments in the crystalline regions are fully polarized (marked as black). Then, through the chain diffusion the chain segments gradually lose the polarization[56] |
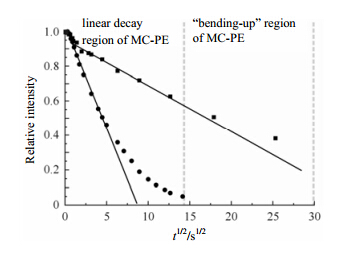
Fig. 10 compares the decays of the crystalline signal of solution crystallized PE (SC-PE) and that of melt crystallized PE (MC-PE), acquired by using the 1D 13C exchange pulse sequence shown in Fig. 9(a). The signal in SC-PE decays much faster than that in MC-PE. Since both samples have similar lamellar thicknesses, this indicates different chain diffusion coefficients D for the two samples. Using Eq. (1) with n = 1 we calculate D = 1.4 × 10⁻¹⁸ m2×s-1 for SC-PE and D = 4.7 × 10⁻²⁰ m2×s-1 for MC-PE. The apparent difference in the diffusion coefficients can be attributed to the different transition entropy that the chain has to overcome when it diffuses between crystalline and non-crystalline regions. According to this, the rapid decay of the signal in MC-PE (≈ 8%) at very early times is ascribed to the chain segments in the interphase between crystalline and non-crystalline regions. There the local chain orientation is preferentially along the normal to the lamella.
|
| Fig. 10 The decay of crystalline signal intensity in SC-PE (●) and MC-PE (■), plotted against the square-root of the exchange time t for two different temperatures. The experimental temperatures were 320 K[56] |
When the polymer segments have diffused through long distances, or equivalently for long times, the decay curves in Fig. 10 are bending-up. This curvature cannot be attributed to 13C T1 relaxation in the PE crystallites, since the relaxation process would speed up the decay, leading to bending-down. Instead, the bending-up in Fig. 10 indicates slowing down of chain diffusion, and thus is rather indicative of additional constraints imposed on this process. The origin of this feature may be related to chain entanglements, which can retard the chain diffusion. Moreover, the chain diffusion itself could lead to bending-up at long times, if considered as curvilinear diffusion[58]. 4 The correlation between the segmental motions and the chain diffusion 4.1 The non-crystalline segmental motions and the chain diffusion
In the above sections, we have shown that the chain dynamics present in the non-crystalline regions of solution crystallized UHME-PE is relative rigid and close to a locally axial rotation around the chain backbone, while the chain dynamics in the non-crystalline regions of melt crystallized sample is more like a fast isotropic motion. But interestingly, the fast isotropic dynamics in the non-crystalline regions of melt crystallized sample does not facilitate the chain diffusion. In contrast, the fast chain diffusion was observed in the solution crystallized sample. The coexistence of the local restricted chain mobility with the enhanced chain diffusion in the solution crystallized sample then is explained by the facilitation effect of the locally axial rotation around the chain backbone on the chain diffusion. The chain folding structure present in the non-crystalline regions is considered to give rise to the spatial restriction, which results in the locally axial rotation.
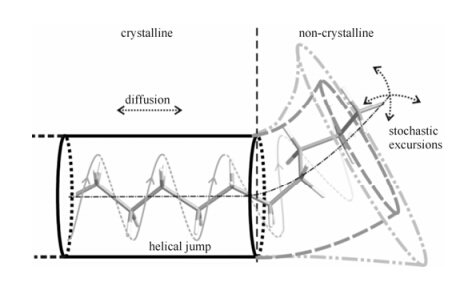
The influence of interfacial components on the chain diffusion can be realized from the cartoon picture of the chain dynamics shown in Fig. 11. In this picture, a chain stem is moving between the non-crystalline region (right side) and the crystalline region (left side). The tube represents spatial and dynamic restrictions of the PE chain from its environment and the diameter of tube indicates the degree of restriction. In this model the chain diffusion is achieved by the sliding of the chain stem in the tube. Due to the chain connectivity, the motion of the non-crystalline chain portion is connected with that of the chain portion in the crystallite. Taking into account that the chain diffusion in the crystal is always along the chain backbone, it is easy to imagine that motions in non-crystalline regions involving extended trans segments rotating around the local backbone are very effective for the chain diffusion, whereas random motions such as almost isotropic fluctuations of chain segments are not compatible with and may even be an obstacle for chain diffusion. Following this idea, one can deduce that reducing the motional degree of freedom of the non-crystalline chain motion, i.e. from random motion to the motion along the extended chain conformations can favor chain diffusion. In thermodynamics terms, the reduction of the motional degrees of freedom of the chain motion in fact is lowering the entropy change involved in the translation motion from the crystalline to the non-crystalline environment. This explains why local restricted chain mobility can coexist with the fast chain diffusion in the solution crystallized sample. The influence of interfacial components on the chain diffusion thus can be understood along this line.
|
| Fig. 11 Illustration of chain motions in PE. The individual helical jump generates the translation of chain stem by one CH2 unit. These initial translation steps evolve in the course of time into a diffusive motion between crystalline and non-crystalline regions, which is observed in the NMR experiments. The tubes represent spatial and dynamic restrictions of the PE chain due to its local environment[40(b)] |
The abovementioned works exhibit uncontroverted proofs for the presence of the large amplitude helical jump in PE crystals. However, it is not logical to expect that every helical jump inevitably leads to a diffusion stem, as the jumps might be reflected by some obstacle in the crystals or annihilated by the jumps from the opposite direction. The correlation between helical jump and the chain diffusion, namely, if one helical jump inevitably results in a diffusion step of a chain stem, becomes a quite intriguing question. The above experiments monitoring the helical jump, the chain diffusion, or as well as dielectric and mechanical relaxation separately cannot tell one the relation between the movements of whole stems and local jumps of segments, which might or might not be coupled each other.
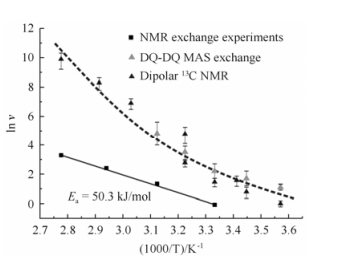
The temperature dependence of the local jump rates sheds light on this issue. Fig. 12 shows the local jump rates in PE crystals measured by 13C-13C dipole-dipole couplings (the black triangle) and double quantum MAS exchange NMR (the gray triangle). Using the chain diffusion coefficient D obtained from the 1D 13C exchange experiment, one is also able to calculate the effective jump rate, which is directly associated with the chain diffusion. These effective jump rates are plotted as the squares in Fig. 12.
|
| Fig. 12 Arrhenius plots of local and effective jump rates in melt crystallized PE samples[40(a)] |
At a given temperature the local jump rates taken from literature are always higher than the effective jump rates derived from chain diffusion. This indicates that a local motion of a CH2 group in PE crystallites does not always lead to a translation of the whole polymer chain. Since the PE samples studied in these works may have slightly different properties, like different molecular weight, degree of chain branching or crystallinity, which might influence the chain dynamics, the direct comparison of the absolute values for the jump rates should not be over-emphasized. However, the different temperature dependence for the local and effective jump rates, where the former exhibit an increasing apparent activation enthalpy with increasing temperature, whereas the latter exhibit a simple Arrhenius behavior, cannot be attributed to possible minor differences in the chemical properties of the samples. In fact the increasing difference, between the effective jump rate determined here and the local jump rates, indicates that with increasing temperature the local jump motions observed via anisotropic NMR interactions and by mechanical relaxation become more and more ineffective for the translation motion of the chain.
This phenomenon can be explained taking a closer look at the mechanism of the chain diffusion process. In literature, defect-driven mechanisms[4] have been proposed to explain the translation of an extended all-trans chain through a PE crystallite, although the nature of defect may still be under debate in the different models. In the defect-driven scenario, a defect is created, e.g., at one side of the crystal and the translation motion is accomplished, when the defect has moved to the other side and finally left the crystallite. If, however, the defect only travels inside the crystallite, and is reflected back or annihilated, it will not lead to translation motion of the stem, but will still cause local reorientation of the CH2 units. Thus, local jump rates may differ from the effective jump rate responsible for chain diffusion. Moreover, it should be noted, that the defects have to leave the crystallites and thus must pass through the interphase between the crystallite and the non-crystalline region, in order to generate an overall translation of the extended all-trans chain segments. Therefore, the conformations in the interphase and their dynamic modes become essential for the chain translation motion. The influence of the interphase on the chain diffusion will be discussed in the next section.
Based on the defect model, the nonlinear behavior of local jump rates in the Arrhenius plot of Fig. 12 can readily be understood. As the lattice of the PE crystallites expands with increasing temperature, the number of defects in the crystals increases. Apparently, however, the likelihood of defects which are not effective for chain diffusion will also increases. It should be noted that at lower temperatures the temperature dependence of local and effective jump rates is very similar, indicating that the relative amount of effective jumps is almost constant in this regime. It should be noted that dynamic mechanical measurements of relaxation processes in PEs show a similar temperature dependence of the activation enthalpy. The above findings on a molecular thus provide a microscopic picture of the macroscopic behavior of the material. 4.3 The segmental motions in the crystal defects and the chain diffusion
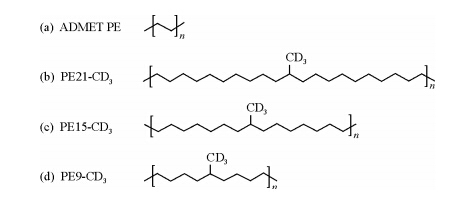
The defect-driven mechanism provides good explanation for the temperature dependence of the apparent and effective jump rates in PE crystals. But concerning the nature of the crystal defects, very few works can be found in literature. Problems lie in analytical difficulty caused by the complicated combination of limited content, unstable state, varied types, and the unclear demarcation between the defects and the normal crystal components. To deepen the understanding of the nature of the crystal defects, Spiess et al. have performed a detailed NMR study on the crystals of a series of deliberately designed polyolefins[59]. These interesting polyolefin samples have precisely spaced methyl branches in the primary chain backbone (see Fig. 13). The formed crystals thus can contain significant amount of defects induced by the precisely spaced branches. To facilitate the study of segmental mobility via 2H NMR, the fully deuterated methyl branches were introduced into the samples.
|
| Fig. 13 Precisely branched polymers: (a) ADMET PE, with no branching, (b-d) PEn-CD3, with deuterated methyl groups on each and every nth carbon |
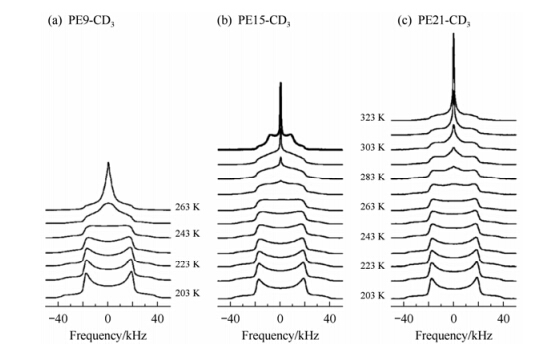
Fig. 14 shows the 2H spectra of the samples at different temperatures. As indicated by the trend of line shape with temperature, the three samples all show the gradual build-up of molecular dynamics with increasing temperature. The most interesting phenomenon in these spectra, however, is a regular Pake pattern (h = 0) with half the static line width in the 2H NMR spectrum observed only for PE15-CD3 at T = 303 K, indicating that the axial rotation in this sample is sufficiently fast to average the 2H line shape. Because this kind of regular Pake pattern is not observed in linear PE, the axial rotation is attributed to the motions of methyl groups embedded in the crystalline regions. Accordingly, the highly asymmetric 2H line shape observed in all cases thus probably is resultant from ill-defined rotations around the local chain axis. Computer simulation shows that such a lineshape can be formed by the rotation of all-trans conformer with amplitude of about 40°.
|
| Fig. 14 Temperature dependence of 2H NMR spectra for (a) PE9-CD3, (b) PE15-CD3, and (c) PE21-CD3. The special line shape of PE15-CD3 at T = 303 K (bold) indicates the presence of fast axial rotational dynamics[59] |
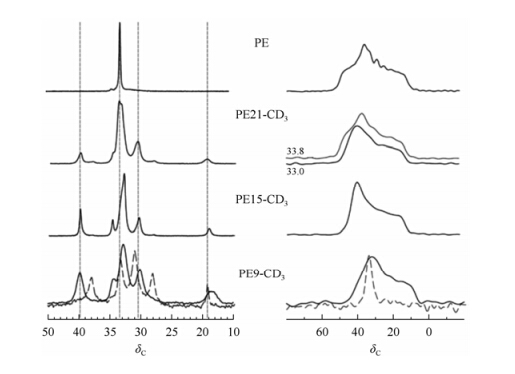
The dynamic information of chain backbone in the crystal defects of these samples is provided by the 13C CSA powder patterns obtained from the 2D CSA recoupling experiment (SUPER)[50]. Taking the advantage of the separation of isotropic CS and CSA in the SUPER experiments, the information of the local reorientations of CH2 groups of the polymer backbone can be site-selectively monitored. Fig. 15 exhibits the isotropic and anisotropic 13C chemical shifts of the samples. A remarkable finding is that the anisotropic 13C chemical shifts of the backbone CH2 groups in PE21-CD3 vary with the distance to the neighbored branching site. The NMR signal at d 33.2, which is likely from the backbone CH2 groups close to the methyl branch, is associated to the CSA powder pattern with the lineshape of an almost axially symmetric CSA tensor, where the principal value of d 13 along the crystalline c axis persists and the two other values are largely averaged. Whereas, the CSA line shapes for the MAS NMR signal at d 33.6 shows a CSA tensor line shape similar to that of PE. This variation on the lineshape of the 13C powder pattern indicates the presence of the rotation of all-trans conformer with different amplitudes. Different from PE21-CD3, the CH2 signals in the crystalline regions of PE15-CD3 areobserved at d 32.9 with a shoulder at about half the signal height at d 33.5. Remarkably, all 13C signals in the NMR spectrum of PE15-CD3 show the powder line shape of well-defined axially symmetric CSA tensors; even at d 33.5, the isotropic chemical shift characteristic of undistorted all-trans units. Thus, whereas in PE21-CD3 the CH2 groups in proximity to the lattice-perturbing methyl branches perform local motions as found in pinned defects, the rotation in PE15-CD3 at T = 303 K involves all the CH2 groups along a given polymer chain and thus shows collective behavior as in a rotator phase, which was also deduced from X-ray data[60].
|
| Fig. 15 Isotropic (a) and anisotropic (b) 13C NMR chemical shifts for precise polymers. From top to bottom: ADMET PE at 300 K, PE21-CD3 at 300 K, PE15-CD3 at 300 K, PE9-CD3 at 235 K (—) and 245 K (---)[59] |
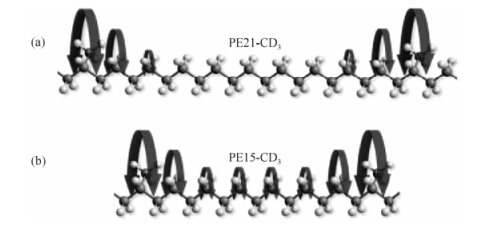
Combining the results for PE15-CD3 and PE21-CD3 obtained from 2H and 13C NMR, which probe the branch and the neighboring chain defect separately, a simple model for the molecular dynamics of regular methyl branched polyethylene in the crystalline regions has been proposed as depicted in Fig. 16. In the crystalline regions of PE15-CD3 and PE21-CD3, the lattice-perturbing methyl branches undergo axial oscillations around the polymer backbone. In both samples, this motion of the methyl branches increases in amplitude and rate with increasing temperature. For PE15-CD3, all the sites along the chain show similar rotational dynamics, indicating that the rotation has become a collective behavior. In the case of PE21-CD3, however, this rotational dynamic mode is restricted to CH2 groups in close proximity to the methyl branch in a twist-like defect, whereas the CH2 groups remote from the methyl branches are not involved in this motion as demonstrated by the regular PE CSA pattern observed at d 33.6, but may undergo 180° flips, as known for crystalline PE. By comparing the intensities of signals at d 33.2 and d 33.6, the size of the defect in PE21-CD3 has been estimated, which is 3-4 CH2 units on each side of the branch. The molecular dynamics in PE21-CD3 thus clearly favors the twist propagation model, while the different molecular dynamics in PE15-CD3 and PE21-CD3 exhibits the localized rotational motion in PE21-CD3 turning into collective dynamics owing to the higher density of defect sites in PE15-CD3.
|
| Fig. 16 Models for rotational dynamics in (a) PE21-CD3 and (b) PE15-CD3[59] |
| [1] | Sperling L H. Introduction to Physical Polymer Science (4th ed)[M]. New York:John Wiley & Sons, 1992. |
| [2] | Stehling F C, Mandelkern L. The glass temperature of linear polyethylene[J]. Macromolecules, 1970, 3(2):242-252. |
| [3] | McBrierty V J, McDonald I R. Nuclear magnetic relaxation in linear and branched polyethylene[J]. Polymer, 1975, 16(2):125-133. |
| [4] | Strobl G. The Physics of Polymers (2nd ed)[M]. Berlin:Springer-Verlag, 1997. |
| [5] | Boyd R H. Relaxation processes in crystalline polymers:molecular interpretation-a review[J]. Polymer, 1985, 26(8):1 123-1 133. |
| [6] | Boyd R H. Relaxation processes in crystalline polymers:experimental behaviour-a review[J]. Polymer, 1985, 26(3):323-347. |
| [7] | Mansfield M, Boyd R H. Molecular motions, the α relaxation, and chain transport in polyethylene crystals[J]. J Polym Sci Pol Phys, 1978, 16(7):1 227-1 252. |
| [8] | Ward I M, Hadley D W. An introduction to the Mechanical Properties of Solid Polymers (2nd ed)[M]. London:John Wiley & Sons, 1993. |
| [9] | Long Y, Shanks R A, Stachurski Z H. Kinetics of polymer crystallisation[J]. Prog Polym Sci, 1995, 20(4):651-701. |
| [10] | Lu J, Mirau P A, Tonelli A E. Chain conformations and dynamics of crystalline polymers as observed in their inclusion compounds by solid-state NMR[J]. Prog Polym Sci, 2002, 27(2):357-401. |
| [11] | Spiess H W. Deuteron NMR-a new tool for studying chain mobility and orientation in polymers[J]. Adv Polym Sci, 1985, 66:23-58. |
| [12] | Spiess H W. Structure and dynamics of solid polymers from 2D and 3D NMR[J]. Chem Rew, 1991, 91(7):1 321-1 338. |
| [13] | Schmidt-Rohr K, Spiess H W. Multidimensional Solid-State NMR and Polymers[M]. London:Academic Press, 1994. |
| [14] | Spiess H W. Interplay of structure and dynamics in macromolecular and supramolecular systems[J]. Macromolecules, 2010, 43(13):5 479-5 491. |
| [15] | Levitt M H. Spin Dynamics:Basics of Nuclear Magnetic Resonance[M]. New York:John Wiley & Sons, 2001. |
| [16] | Hansen M R, Graf R, Spiess H W. Solid-state NMR in macromolecular systems:insights on how molecular entities move[J]. Acc Chem Res, 2013, 46 (9):1 996-2 007. |
| [17] | Flory P. Principle of Polymer Chemistry[M]. New York:Cornell University Press, 1953. |
| [18] | Mandelkern L. Crystallization in Polymers[M]. New York:McGraw-Hill, 1964. |
| [19] | Mandelkern L. An Introduction to Macromolecules[M]. New York:Springer-Verlag, 1983. |
| [20] | Robertson R E. Polymer Order and Polymer Density[J]. J Phys Chem, 1965, 69(5):1 575-1 578. |
| [21] | Schnell I, Spiess H W. High-resolution 1H NMR spectroscopy in the solid state:very fast sample rotation and multiple- quantum coherences[J]. J Magn Reson, 2001, 151(2):153-227. |
| [22] | Brown S P, Spiess H W. Advanced solid-state NMR methods for the elucidation of structure and dynamics of molecular, macromolecular, and supramolecular systems[J]. Chem Rev, 2001, 101(12):4 125-4 156. |
| [23] | Baker A M E, Windle A H. Evidence for a partially ordered component in polyethylene from wide-angle X-ray diffraction[J]. Polymer, 2001, 42(2):667-680. |
| [24] | Rastogi S, Terry A E. Morphological implications of the interphase bridging crystalline and amorphousregions in semi-crystalline polymers[J]. Adv Polym Sci, 2005, 180:161-194. |
| [25] | Balijepalli S, Rutledge G C. Molecular simulation of the intercrystalline phase of chain molecules[J]. J Chem Phys, 1998, 109(16):6 523-6 526. |
| [26] | Flory P J, Yoon D Y, Dill K A. The interphase in lamellar semicrystalline polymers[J]. Macromolecules, 1984, 17(4):862-868. |
| [27] | Gautam S, Balijepalli S, Rutledge G C. Molecular simulations of the interlamellar phase in polymers: effect of chain tilt[J]. Macromolecules, 2000, 33(24):9 136-9 145. |
| [28] | Axelson D E, Russell K E. Characterization of polymers by means of 13C NMR spectroscopy:(a) Morphology by solid-state NMR (b) End-group studies[J]. Prog Polym Sci, 1985, 11(3):221-282. |
| [29] | Kitamaru R, Horii F, Hyon S H. Proton magnetic resonance studies of the phase structure of bulk-crystallized linear polyethylene[J]. J Polym Sci Pol Phys, 1977, 15(5):821-836. |
| [30] | Mandelkern L, Alamo R G, Kennedy M A. The interphase thickness of linear polyethylene[J]. Macromolecules, 1990, 23(21):4 721-4 723. |
| [31] | Mowery D M, Harris D J, Schmidt-Rohr K. Characterization of a major fraction of disordered all-trans chains in cold-drawn high-density polyethylene by solid-state NMR[J]. Macromolecules, 2006, 39(8):2 856-2 865. |
| [32] | Uehara H, Yamanobe T, Komoto T. Relationship between solid-state molecular motion and morphology for ultrahigh molecular weight polyethylene crystallized under different conditions[J]. Macromolecules, 2000, 33(13):4 861-4 870. |
| [33] | Organ S J, Keller A. Solution crystallization of polyethylene at high temperatures[J]. J Mater Sci, 1985, 20(5):1 571-1 585. |
| [34] | Flory P J. On the morphology of the crystalline state in polymers[J]. J Am Chem Soc, 1962, 84(15):2 857-2 867. |
| [35] | Billmeyer F W. Textbook of Polymer Science (3rd ed)[M]. New York:Wiley, 1984. |
| [36] | Earl W L, Vanderhart D L. Observations in solid polyethylenes by Carbon-13 nuclear magnetic resonance with magic angle sample spinning[J]. Macromolecules, 1979, 12:762-767. |
| [37] | Vanderhart D L. Influence of molecular packing on solid-state 13C chemical shifts:the n-alkanes[J]. J Magn Reson, 1981, 44(1):117-125. |
| [38] | Perez E, Vanderhart D L. Morphological partitioning of chain ends and methyl branches in melt-crystallized polyethylene by 13C NMR[J]. J Polym Sci Pol Phys, 1987, 25(8):1 637-1 653. |
| [39] | Yao Y F. Influence of spatial constraints in non-crystalline regions on the polymer dynamics in semi-crystalline polyethylene:a solid state NMR study[D]. German:Johannes Gutenberg-Universitaet Mainz, 2007. |
| [40] | (a) Yao Y F, Graf R, Spiess H W, et al. Morphological differences in semicrystalline polymers:Implications for local dynamics and chain diffusion[J]. Phys Rev E, 2007, 76(6):060801-060804;(b) Yao Y F, Graf R, Spiess H W, et al. Restricted segmental mobility can facilitate medium-range chain diffusion:A NMR study of morphological influence on chain dynamics of polyethylene[J]. Macromolecules, 2008, 41(7):2 514-2 519. |
| [41] | Spiess H W. Molecular dynamics of solid polymers as revealed by deuteron NMR[J]. Colloid Polym Sci, 1983, 261(3):193-209. |
| [42] | Yao Y F, Rastogi S, Xue H J, et al. Segmental mobility in the noncrystalline regions of nascent polyethylene synthesized using two different catalytic systems with implications on solid-state deformation[J]. Polymer, 2013, 54(1):411-422. |
| [43] | Yao Y, Jiang S, Rastogi S. 13C solid-state NMR characterization of structure and orientation development in the narrow and broad molar mass disentangled UHMWPE[J]. Macromolecules, 2014, 47(4):1 371-1 382. |
| [44] | VanderHart D L. Characterization of the methylene 13C chemical shift tensor in the normal alkane n-C20H42[J]. J Chem Phys, 1976, 64(2):830-834. |
| [45] | Schnell I. Dipolar recoupling in fast-MAS solid-state NMR spectroscopy[J]. Prog Nucl Mag Res Spectrosc, 2004, 45(1-2):145-207. |
| [46] | Saalwachter K, Schnell I. REDOR-based heteronuclear dipolar correlation experiments in multi-spin systems:rotor-encoding, directing, and multiple distance and angle determination[J]. Solid State Nucl Magn Reson, 2002, 22(2-3):154-187. |
| [47] | Davis G T, Eby R K. Glass transition of polyethylene:Volume relaxation[J]. J Appl Phys, 1973, 44(10):4 274-4 281. |
| [48] | Cho T Y, Shin E J, Jeong W, et al. Effects of comonomers on lamellar and noncrystalline microstructure of ethylene copolymers[J]. Macromol Rapid Commun, 2006, 27(5):322-327. |
| [49] | Demus D, Goodby J W, Gray G W, et al. Handbook of Liquid Crystals[M]. New York:Wiley-VCH, 1998. |
| [50] | Liu S F, Mao J D, Schmidt-Rohr K. A robust technique for two-dimensional separation of undistorted chemical-shift anisotropy powder patterns in magic-angle-spinning NMR[J]. J Magn Reson, 2002, 155(1):15-28. |
| [51] | Axelson D E, Mandelkern L, Popli R, et al. 13C NMR of polyethylenes:Correlation of the crystalline component T1 with structure[J]. J Polym Sci Pol Phys, 1983, 21(11):2 319-2 335. |
| [52] | Hu W G, Schmidt-Rohr K. Polymer ultradrawability:the crucial role of α-relaxation chain mobility in the crystallites[J]. Acta Polym, 1999, 50(8):271-285. |
| [53] | Hu W G, Boeffel C, Schmidt-Rohr K. Chain flips in polyethylene crystallites and fibers characterized by dipolar 13C NMR[J]. Macromolecules, 1999, 32(5):1 611-1 619. |
| [54] | Schnell I, Watts A, Spiess H W. Double-quantum double-quantum MAS exchange NMR spectroscopy:dipolar-coupled spin pairs as probes for slow molecular dynamics[J]. J Magn Reson, 2001, 149(1):90-102. |
| [55] | Schmidt-Rohr K, Spiess H W. Chain diffusion between crystalline and amorphous regions in polyethylene detected by 2D exchange carbon-13 NMR[J]. Macromolecules, 1991, 24(19):5 288-5 293. |
| [56] | Yao Y F, Graf R, Spiess H W, et al. Influence of crystal thickness and topological constraints on chain diffusion in linear polyethylene[J]. Macromol Rapid Commun, 2009, 30(13):1 123-1 127. |
| [57] | Torchia D A. The measurement of proton-enhanced carbon-13 T1 values by a method which suppresses artifacts[J]. J Magn Reson, 1978, 30(3):613-616. |
| [58] | Doi M, Edwards S F. The Theory of Polymer Dynamics[M]. Oxford:Oxford University Press, 1986. |
| [59] | Wei Y, Graf R, Sworen J C, et al. Local and Collective motions in precise polyolefins with alkyl branches:a combination of 2H and 13C solid-state NMR spectroscopy[J]. Angew Chem Int Edit, 2009, 48(25):4 617-4 620. |
| [60] | Lieser G, Wegner G, Smith J A, et al. Morphology and packing behavior of model ethylene/propylene copolymers with precise methyl branch placement[J]. Colloid Polym Sci, 2004, 282(8):773-381. |
 2015, Vol. 32


