2. 吉林农业大学资源与环境学院,长春 130118;
3. 中国农业科学院衡阳红壤实验站/祁阳农田生态系统国家野外试验站,湖南祁阳 426182
2. College of Resource and Environmental Science, Jilin Agricultural University, Changchun 130118, China;
3. Red Soil Experimental Station of Chinese Academy of Agricultural Sciences in Hengyang / National Observation and Research Station of Farmland Ecosystem in Qiyang, Hunan 426182, China
红壤是我国南方丘陵区主要的土壤类型,具有酸性强、盐基高度不饱和、肥力水平低的特点[1]。在高强度的人为活动下,大量外源质子会进入土壤,引起红壤酸化,使土壤物理、化学和生物学性质发生一系列变化,进而导致生产力及生态系统的演变和退化[2–3]。同时,红壤酸化会引起铝、锰和氢对植物的毒害及红壤中营养元素磷、钾、钙、镁的缺乏,从而使作物减产[4–5]。由于其本身物理化学特性及受热带亚热带气候的影响,土壤对人为土地利用导致酸性物质的输入特别敏感,加快了土壤的进一步酸化[3]。因此,红壤酸化对农业和生态环境保护产生了严重威胁[6],明确不同土地利用方式下红壤酸化现状,可采取有效措施减缓酸化进程,减少因土壤酸化造成的经济损失及生态环境的恶化。
有研究表明[7],不仅粮田土壤存在酸化现象,果园和菜园的土壤酸化问题也很突出。张桃林等[8]在江西省余江县进行的研究表明,不同土地利用方式对红壤pH的影响程度为旱地 > 菜地 > 水田。姬钢等 [9]研究表明,在人工林中0—40cm土层红壤pH大小顺序为茶园 > 湿地松林 > 板栗 > 柑橘园。由此可见,不同土地利用方式影响土壤pH变化 [10]。因此,可以通过不同土地利用方式的调控,稳定土壤pH值,减缓酸化,进而保持土壤的持续生产力。
土地利用方式可以直接影响土壤的酸化状况,前人的研究大多集中在表层或耕层土壤pH的变化特征[11–12],关于土壤酸度特征在剖面上分布差异性的研究尚较缺乏。因此,本研究对红砂岩母质发育的红壤在4种利用方式 (水田、旱地、果园、林地) 下,土壤pH、交换性酸、交换性盐基总量以及盐基饱和度等酸性相关指标在不同土层 (0—20、20—40、40—60、60—80和80—100 cm) 的变化特征进行了分析,为我国南方丘陵区红壤酸化特性和改良提供理论依据。
1 材料与方法 1.1 研究区概况研究区位于江西省鹰潭市余江县 (28°04′~28°37′N、116°41′~117°09′E),该地区年平均温度17.6 ℃,年降水量1757.9 mm,年平均日照1777.6 h,年日照百分率为41%,无霜期270天左右,属于亚热带湿润季风气候,主要种植制度是双季稻,土壤类型为红砂岩母质发育的红壤。
1.2 试验设计于2016年1月采用网格布点法 (2 km × 2 km) 在余江县均匀采集了4种不同利用类型 (水田、旱地、果园、林地) 共26个土壤剖面样品,在每一点位所在的样地随机选取3个点位,用土钻进行样品采集,取样层次分别为0—20、20—40、40—60、60—80和80—100 cm共5个土层,同一土层深度3个样品混合均匀后,按照四分法分取1 kg土样,分拣出石砾、根系等杂物,磨细分别依次过2 mm、1 mm和0.25 mm筛备用。不同利用类型的红壤剖面基本状况见表1。
| 表1 样品采集点土地基本状况 Table 1 General information of lands for soil sampling |
 |
根据采样期间的农户调查,截至2016年,水田和林地利用年限超过30年,由于1997—2000年土地利用方式发生变化,旱地利用年限为5~10年,由于1985年没有采集果园利用方式下的土壤样品,因此数据缺省。1985年不同利用方式下红壤基本化学性质见表2。
| 表2 1985年不同利用方式下红壤基本化学性质 Table 2 Basic chemical properties of red soil under different land use patterns in 1985 |
 |
土壤pH值采用电极电位法测定 (水土比2.5∶1);有机质用重铬酸钾外加热法;全氮采用凯氏定氮法;土壤交换性酸(EA)采用 1 mol/L氯化钾交换—中和滴定法测定;阳离子交换量(CEC)采用乙酸铵交换法[13];交换性盐基离子(EB)用乙酸铵震荡浸提法[14];盐基饱和度(BC= EB/CEC * 100%)通过计算获得[13]。
1.4 数据处理采用SPSS 19软件进行数据统计分析,用 Duncan 法检验不同利用方式和不同土壤层次间酸度指标的差异显著性 (P < 0.05) ;采用Excel 2016软件作图。
2 结果与分析 2.1 不同利用方式下红壤剖面pH变化特征由图1可以看出,红壤pH随着利用方式和土层深度呈现不同程度的变化趋势,变化范围在4.27~6.27之间。在不同利用方式下,红壤剖面pH大小依次为水田 (5.69) > 旱地 (4.71)和果园 (4.74) > 林地 (4.49);在不同土层上,随着土层的增加,红壤剖面pH逐渐升高[80—100 cm (5.39) > 60—80 cm (5.27) > 40—60 cm (5.11) > 20—40 cm (4.81) > 0—20 cm (4.68)];在水田利用方式下,随着土层深度的增加,红壤pH逐渐升高,为60—100 cm (6.17) > 40—60 cm (5.84) > 20—40 cm (5.29) > 0—20 cm (4.94);在旱地利用方式下,不同土层红壤pH无显著差异 ( P > 0.05);在果园利用方式下,红壤pH在80—100cm土层最高,为4.92;在林地利用方式下,红壤pH在20—80 cm随着土层的增加而逐渐升高,其大小顺序为 60—100 cm (4.67) > 40—60 cm (4.49) > 0—40 cm (4.30)。
 |
| 图1 不同利用方式红壤剖面pH Fig. 1 pH of red soil profiles under different land use [注(Note):L—土地利用Land use;S—土壤深度Soil depth;柱上不同小写字母表示同一利用方式下不同层次间差异达P < 0.05显著水平,不同大写字母表示在剖面上不同利用方式间差异达P < 0.05显著水平。Different lowercases above the bars mean significant difference at the P < 0.05 level among soil depths for the same land use,and different capitals above the bars mean significant difference at the P < 0.05 level among different land uses patterns in whole profile.] |
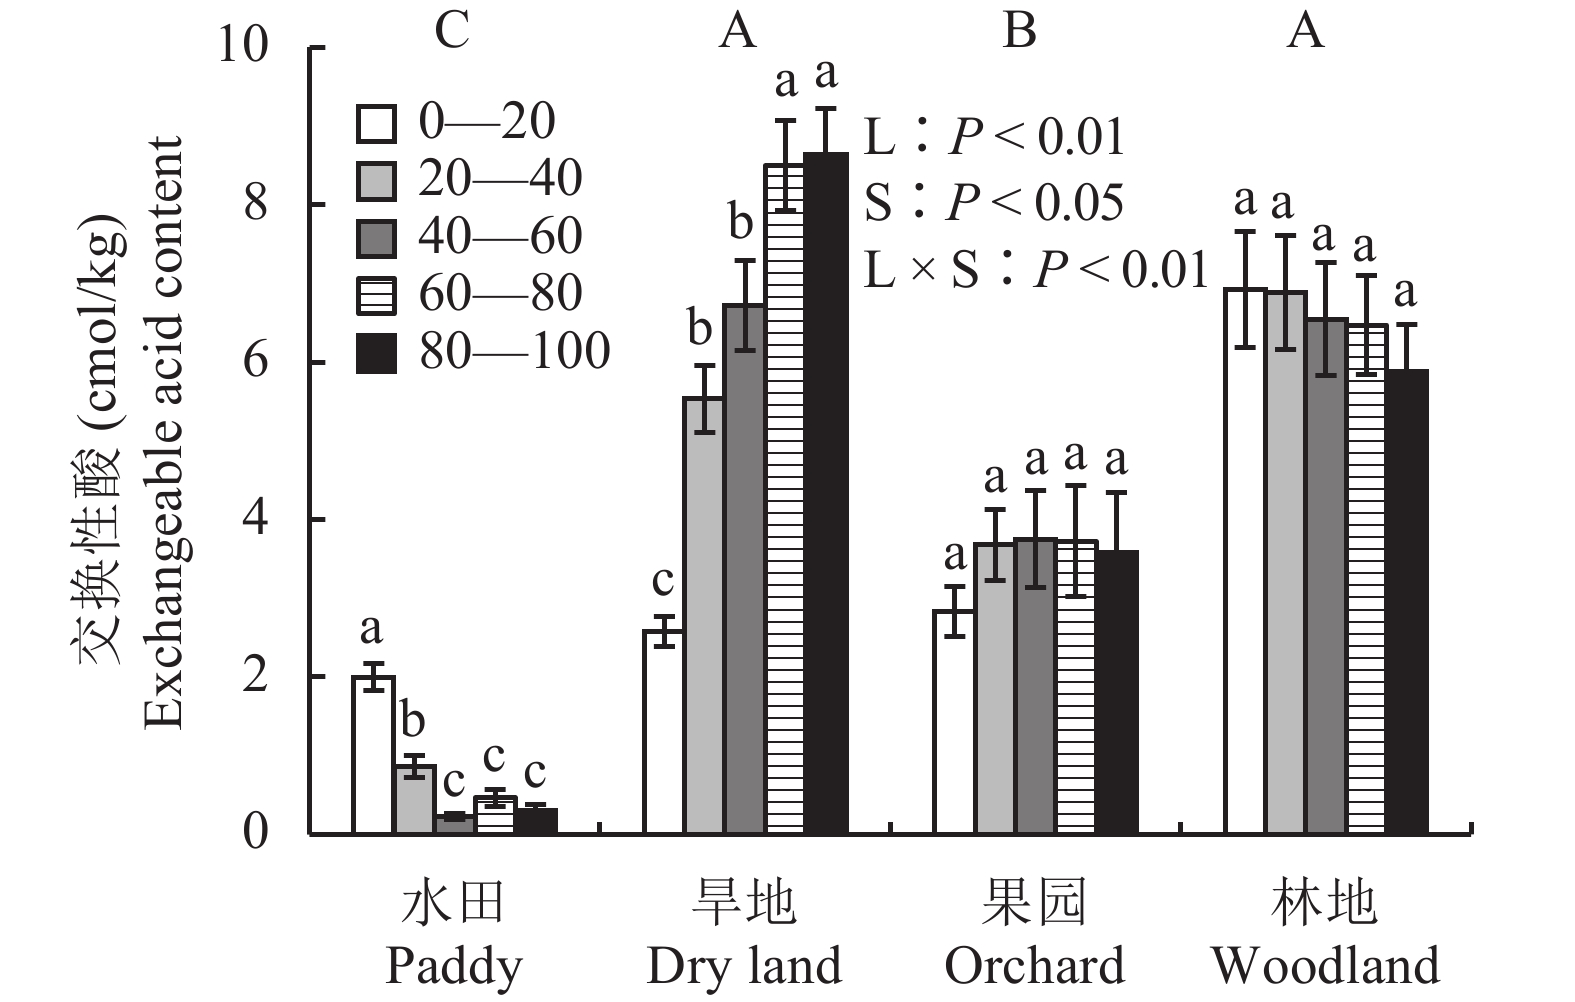
由图2可以看出,在不同利用方式下,红壤剖面交换性酸含量大小顺序为林地 (6.54 cmol/kg) > 旱地(6.52 cmol/kg) > 果园 (3.51 cmol/kg) > (0.79 cmol/kg)。在水田利用方式下,红壤交换性酸含量在0—60 cm随着土层深度的增加而逐渐降低,其大小顺序为0—20 cm (2.00 cmol/kg) > 20—40 cm (0.86 cmol/kg) > 40—60 cm (0.23 cmol/kg),80—100 cm土层与40—60 cm土层间无显著差异;在旱地利用方式下,红壤交换性酸含量随着土层深度的增加而逐渐升高,其大小顺序为60—100 cm (8.57 cmol/kg) > 20—60 cm (6.12 cmol/kg) > 0—20 cm (2.57 cmol/kg);在果园和林地利用方式下,红壤交换性酸含量在不同土层间无显著差异。
 |
| 图2 不同利用方式下红壤剖面交换性酸 Fig. 2 Exchangeable acid of red soil profiles under different land use patterns [注(Note):L—土地利用Land use;S—土壤深度Soil depth;柱上不同小写字母表示同一利用方式下不同层次间差异达P < 0.05显著水平,不同大写字母表示在剖面上不同利用方式间差异达P < 0.05显著水平。Different lowercases above the bars mean significant difference at the P < 0.05 level among soil depths for the same land use,and different capitals above the bars mean significant difference at the P < 0.05 level among different land uses in whole profile.] |
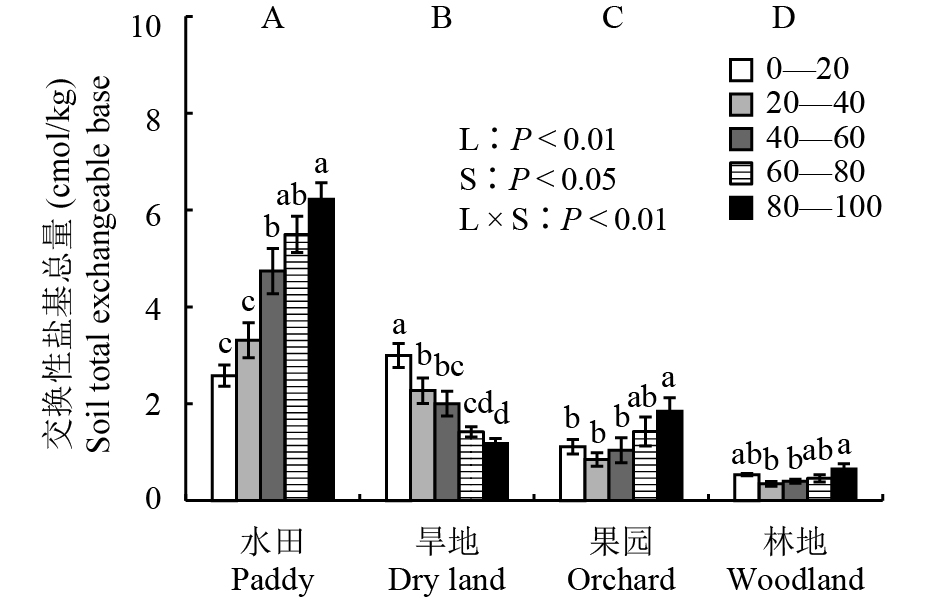
由图3可以看出,在不同利用方式下,红壤剖面交换性盐基总量大小顺序为水田 (4.47 cmol/kg) > 旱地 (1.97 cmol/kg) > 果园 (1.26 cmol/kg) > 林地 (0.48 cmol/kg)。在不同土层上,随着土层深度的增加,红壤交换性盐基总量逐渐升高,其大小顺序为60—100 cm (2.34 cmol/kg) > 40—60 cm (2.05 cmol/kg) > 0—40 cm (1.75 cmol/kg)。在水田利用方式下,红壤交换性盐基总量在20—60 cm随着土层深度的增加而显著升高,不同土层交换性盐基总量顺序为60—100 cm (5.86 cmol/kg) > 40—60 cm (4.74 cmol/kg) > 0—40 cm (2.95 cmol/kg);在旱地利用方式下,红壤交换性盐基总量在0—100 cm随着土层深度的增加而逐渐降低,不同土层交换性盐基总量顺序为0—20 cm (3.00 cmol/kg) > 20—60 cm (2.14 cmol/kg) > 60—80 cm (1.30 cmol/kg);在果园利用方式下,红壤交换性盐基总量在40—100 cm随着土层深度的增加而逐渐升高,其中80—100 cm土层比40—60 cm土层显著升高了0.60 cmol/kg,不同土层交换性盐基总量顺序为60—100 cm (1.64 cmol/kg) > 0—60 cm (1.00 cmol/kg);在林地利用方式下,红壤交换性盐基总量在40—100 cm随着土层深度的增加而逐渐升高,其中80—100 cm土层比40—60 cm土层显著升高了0.25 cmol/kg,不同土层交换性盐基总量大小顺序为60—100 cm (0.55 cmol/kg) > 0—60 cm (0.43 cmol/kg)。
 |
| 图3 不同利用方式下红壤剖面交换性盐基总量 Fig. 3 Total exchangeable base of red soil profiles under different land use patterns [注(Note):L—土地利用Land use;S—土壤深度Soil depth;柱上不同小写字母表示同一利用方式下不同层次间差异达P < 0.05显著水平,不同大写字母表示在剖面上不同利用方式间差异达P < 0.05显著水平。Different lowercases above the bars mean significant difference at the P < 0.05 level among soil depths for the same land use,and different capitals above the bars mean significant difference at the P < 0.05 level among different land uses in whole profile.] |
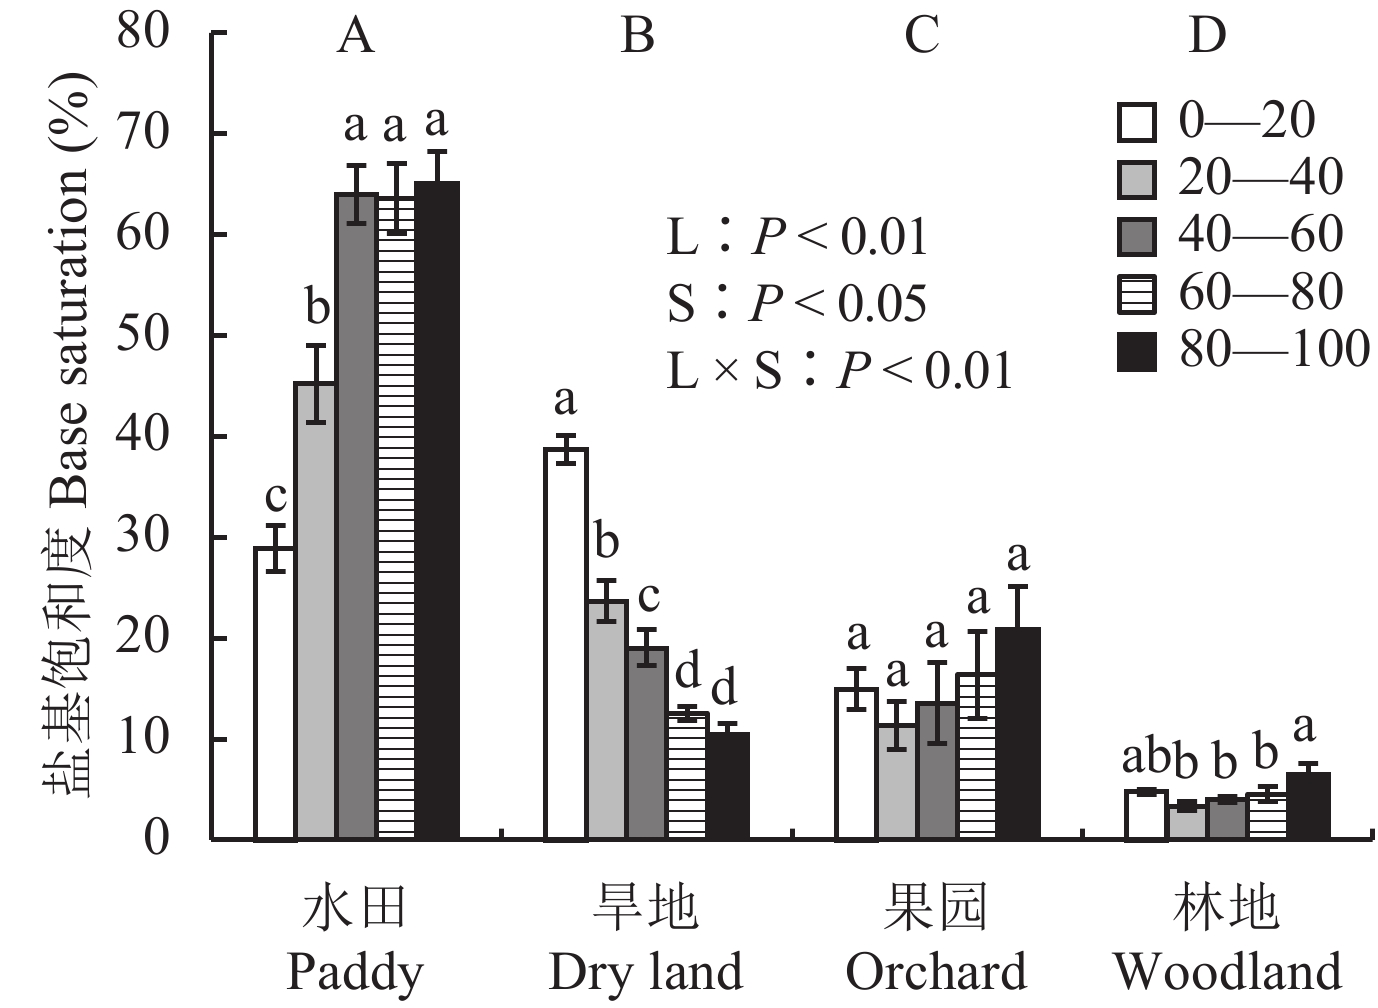
由图4可以看出,在不同利用方式下,红壤剖面盐基饱和度大小顺序为水田 (53.14%) > 旱地 (20.87%) > 果园 (15.41%) > 林地 (4.67%)。在不同土层上,随着土层深度的增加,红壤盐基饱和度逐渐升高,其大小顺序为80—100 cm (33.95%) > 60—80 cm (32.27%) > 40—60 cm (31.31%) > 20—40 cm (25.47%) > 0—20 cm (21.08%)。在水田利用方式下,红壤盐基饱和度在0—60cm随着土层深度的增加而逐渐升高,其大小顺序为40—100 cm (64.20%) > 20—40 cm (45.19%) > 0—20 cm (28.90%);在旱地利用方式下,红壤盐基饱和度在0—80 cm随着土层深度的增加而逐渐降低,不同土层盐基饱和度的大小顺序为0—20 cm (38.68%) > 20—40 cm (23.64%) > 40—60 cm (19.03%) > 60—100 cm (11.51%);在果园利用方式下,红壤盐基饱和度在不同土层间无显著差异;在林地利用方式下,红壤盐基饱和度在60—100 cm随土层深度的增加而显著升高了1.98%,不同土层盐基饱和度80—100 cm 为6.53%,0—80 cm为4.17%。
 |
| 图4 不同利用方式下红壤剖面盐基饱和度 Fig. 4 Base saturation of red soil profiles under different land use patterns [注(Note):L—土地利用Land use;S—土壤深度Soil depth;柱上不同小写字母表示同一利用方式下不同层次间差异达P < 0.05显著水平,不同大写字母表示在剖面上不同利用方式间差异达P < 0.05显著水平。Different lowercases above the bars mean significant difference at the P < 0.05 level among soil depths for the same land use,and different capitals above the bars mean significant difference at the P < 0.05 level among different land uses in whole profile.] |
在不同利用方式下红壤pH与酸度指标间具有显著的相关关系 (表3)。在水田、旱地和果园利用方式下,红壤pH与交换性酸呈显著负相关,与交换性盐基总量和盐基饱和度呈显著正相关 (P < 0.01);在林地利用方式下,红壤pH与交换性酸、全氮和有机质呈显著负相关,与盐基饱和度呈显著正相关 ( P < 0.05),与交换性盐基总量无相关性。
| 表3 不同利用方式下红壤剖面酸度指标之间的相关性 Table 3 Correlation coefficients among acid indexes of red soil profiles under different land use patterns |
 |
土地利用是人类在自然、经济、社会等条件综合作用下的长期过程,反映了人类与大自然之间的相互关系[15–16],受人类活动的直接影响[17]。土地利用作为人类干预土壤质量最直接和最重要的活动,深刻影响着土壤的理化性状及其生态环境,合理的土地利用方式可有效地改善土壤结构,提高土壤质量,而不合理的土地利用则会加重土壤侵蚀,降低土壤对外界环境的抵抗力[18–20]。本研究表明,林地、果园和水田土壤pH在0—60 cm土层随土层深度增加而升高,这与刘菊秀等的研究结果一致[21]。可能是因为在在多雨和施肥条件下,红壤中的盐基离子向下淋溶,氢离子代替盐基离子被土壤吸附,并进一步转化为铝质土壤[22],使得土壤剖面底层盐基离子含量增加,pH升高。
本研究表明,4种利用方式下0—100 cm土层的pH大小为水田 > 果园 ≈ 旱地 > 林地,且水田、果园和林地红壤表层pH显著低于底层,主要有以下几个原因:1) 林地中含有丰富的根系群和微生物群,其在土壤中的呼吸作用会引起硅酸盐的溶解,导致碱性离子流失,加剧土壤酸化 [23–24],另外,森林凋落物含有大量的单宁、树脂和木质素等,其分解可产生酸性物质,进入土壤后引起林地土壤pH降低、交换性酸含量增加[25]。2) 果园由于果实收获会带走部分碱基[26],抵消了部分由于施肥和降雨产生的质子[27],在一定条件下,其pH比林地高。3) 旱地种植的是花生和大豆,都属豆科作物,在生长过程中通过根瘤菌的固氮作用从土壤中吸收的阳离子量大于阴离子量,引起花生地红壤中质子增加而加剧红壤酸化,花生固定的氮被硝化和淋溶以及施肥等措施也会导致土壤酸化[28],这与姬纲等[29]研究结果一致。4) 水田pH显著高于其他土地利用方式,其表层pH低于底层,主要由于:①化学氮肥施用可以在土壤中产生大量的酸,如NH4+的硝化作用、NO3–的积累和淋失等,其都能够产生大量的H+[30],使水稻土表层pH降低;②水稻收获后,秸秆和籽粒会带走大量的盐基离子,导致水稻土中阴阳离子的不平衡[31],从而使水稻土表层pH降低;③研究区域的水田都是全量秸秆还田,水稻秸秆短期还田主要通过淹水作用产生有机酸等酸性物质影响水稻土酸度[32],同时,水稻秸秆分解过程中铵态氮的硝化作用引起水稻土表层pH降低[33];④由于长期淹水,水稻土中形成了特殊的酸碱缓冲体系,耕层士壤Eh值显著下降,亚铁、亚锰等还原物质明显增加,导致还原淋溶和络合淋移作用的加强[34],特别是土壤中的铁、锰氧化物被还原消耗质子可使溶液中的氢离子浓度下降,中和了施肥、收获和秸秆还田等原因产生的氢离子,因此,水田pH显著高于其他利用方式,长期种植水稻后土壤酸碱度一般是向中性方向发展[35]。
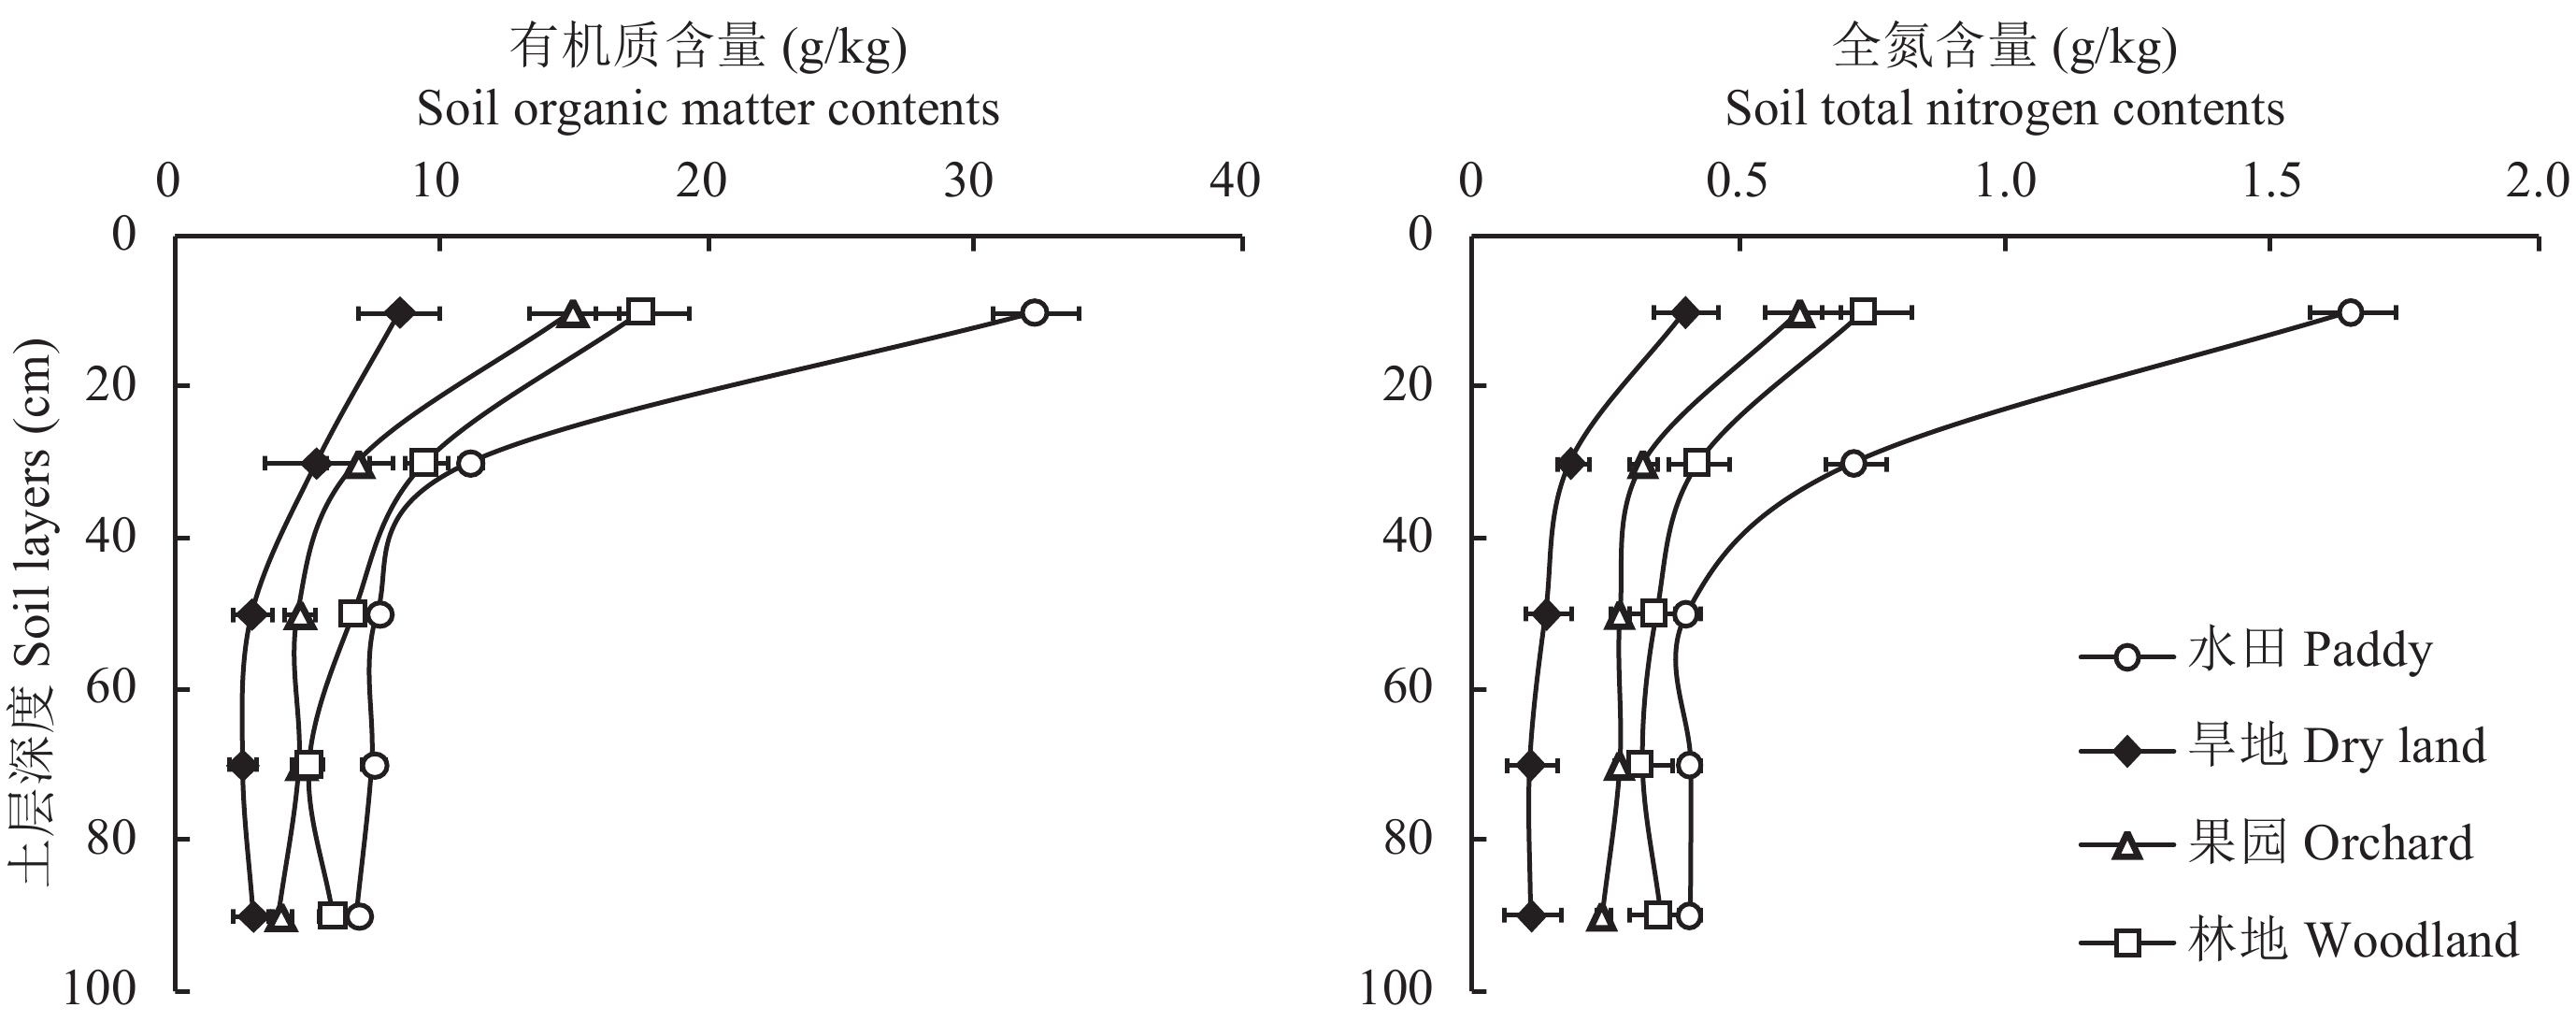
交换性离子分布的差别是成土母质、生物物质循环及淋溶作用等综合作用的结果,与母质类型、利用方式以及土壤养分等条件密切相关[36]。本研究表明,在成土母质、地形以及气候条件一致的情况下,不同土地利用方式下红壤剖面交换性酸变化特征与pH相反,而交换性盐基总量和盐基饱和度变化特征与pH一致,主要由于不同利用方式下的红壤剖面有机质和全氮含量均随土层深度的增加而降低 (图5),且在水田利用方式下,红壤交换性酸含量随全氮和有机质含量的增加而显著增加;交换性盐基总量和盐基饱和度随全氮和有机质含量的增加而显著降低 (P < 0.01);在旱地和果园利用方式下,红壤交换性酸含量随全氮和有机质含量的增加而显著降低;在旱地利用方式下,交换性盐基总量和盐基饱和度随全氮和有机质含量的增加而显著增加 ( P < 0.01);在果园和林地利用方式下,全氮和有机质含量对交换性盐基总量和盐基饱和度无显著影响;在林地利用方式下,红壤交换性酸含量随全氮含量的增加显著降低,与有机质含量无相关性 ( 表2)。因此,不同的土地利用方式下交换性离子的差异是由于土壤全氮和有机质含量剖面分布的差异引起的[37]。从整体来看,林地红壤交换性离子相对较低,这是因为林地酸化而造成土壤交换性盐基离子流失较快[38]。不同利用方式下的红壤pH均与交换性酸呈显著 (P < 0.05) 负相关,与交换性盐基总量和盐基饱和度呈显著 ( P < 0.05) 正相关,说明不同利用方式下红壤交换性离子和盐基饱和度的变化会引起土壤pH的变化,与黄尚书等 [39]研究结果一致。
 |
| 图5 不同利用方式下红壤剖面有机质和全氮含量 Fig. 5 Organic matter and total nitrogen of red soil profiles under different land use patterns [注(Note):图中的误差表示标准误 The error in the figure means standard error.] |
4种利用方式下,0—40 cm土层,林地红壤酸度最高,其次是果园和旱地,水田红壤酸度最低,在40—100 cm土层酸度变异较小。通过改变土地利用方式,降低红壤交换性酸含量、增加交换性盐基总量和盐基饱和度,可以有效降低红壤酸度。
| [1] |
李庆逵. 中国红壤[M]. 北京: 科学出版社, 1983.
Li Q K. Red soil in China[M]. Beijing: Science Press, 1983. |
| [2] |
于天一, 孙秀山, 石程仁, 等. 土壤酸化危害及防治技术研究进展[J].
生态学杂志, 2014, 33(11): 3137–3143.
Yu T Y, Sun X S, Shi C R, et al. Advances in soil acidification hazards and control techniques[J]. Chinese Journal of Ecology, 2014, 33(11): 3137–3143. |
| [3] |
盛祝梅, 张华, 黄守营, 等. 农田酸化土壤改良研究[J].
现代农业科技, 2015, (2): 223–236.
Sheng Z M, Zhang H, Huang S Y, et al. Farmland acidification soil improvement research[J]. Modern Agricultural Science and Technology, 2015, (2): 223–236. DOI:10.3969/j.issn.1007-5739.2015.02.141 |
| [4] | Cregan P D, Scott B J. Soil acidification an agricultural and environmental problem [A]. Pratley J E, Robertson A. Agricultural and the environmental imperative[M]. Melbourne: CSIRO Publishing, 1998. 98–128. |
| [5] |
吕焕哲, 王凯荣, 谢小立. 土地利用方式与坡位土壤活性铝形态特征分析[J].
水土保持学报, 2007, 21(1): 172–175.
Lü H Z, Wang K R, Xie X L, et al. Character of soil aluminum forms under different land use and slope position[J]. Journal of Soil and Water Conservation, 2007, 21(1): 172–175. DOI:10.3321/j.issn:1009-2242.2007.01.042 |
| [6] | Ritchie G P S. The chemical behavior of aluminum, hydrogen and manganese in acid soils [A]. Robson A D. Soil acidity and plant growth[M]. Sydney: Academic Press, 1989. 1–60. |
| [7] |
鲁艳红, 廖育林, 聂军, 等. 我国南方红壤酸化问题及改良修复技术研究进展[J].
湖南农业科学, 2015, (3): 148–151.
Lu Y H, Liao Y L, Nie J, et al. Research progress of red soil acidification in south China and improvement of restoration techniques[J]. Hunan Agricultural Science, 2015, (3): 148–151. |
| [8] |
张桃林, 潘剑君, 刘绍贵, 等. 集约农业利用下红壤地区土壤肥力与环境质量变化及调控[J].
土壤学报, 2007, 44(4): 584–591.
Zhang T L, Pan J J, Liu S G, et al. Change and regulation of soil fertility and environmental quality in red soil area under intensive agriculture[J]. Acta Pedologica Sinica, 2007, 44(4): 584–591. DOI:10.3321/j.issn:0564-3929.2007.04.002 |
| [9] |
姬钢. 不同土地利用方式下红壤酸化特征及趋势[D]. 北京: 中国农业科学院硕士学位论文, 2015.
Ji G. Characteristics and trends of red soil acidification under different land use methods [D]. Beijing: MS Thesis of Chinese Academy of Agricultural Sciences, 2015. |
| [10] |
王效举. 红壤丘陵区不同土地利用方式下土壤变化特征的研究[J].
资源科学, 1998, 20: 24–31.
Wang X J. Study on the characteristics of soil changes under different land use methods in red soil hilly areas[J]. Resource Science, 1998, 20: 24–31. |
| [11] | Jackson R B, Jobbágy E G, Avissar R, et al. Trading water for carbon with biological carbon sequestration[J]. Science, 2005, 310: 1944–1947. DOI:10.1126/science.1119282 |
| [12] | Renberg I, Korsman T, Birks H J B. Prehistoric increases in the pH of acid-sensitive Swedish lakes caused by land-use changes[J]. Nature, 1993, 362: 824–827. DOI:10.1038/362824a0 |
| [13] |
鲍士旦. 土壤农化分析 (第三版) [M]. 北京: 中国农业出版社, 2000.
Bao S D. Soil and agricultural chemistry analysis (Third edition) [M]. Beijing: China Agriculture Press, 2000. |
| [14] |
张玉革, 肖敏, 董怡华, 姜勇. 乙酸铵浸提原子吸收光谱法同时测定土壤交换性盐基离子组成[J].
光谱学与光谱分析, 2012, 32(8): 2242–2245.
Zhang Y G, Xiao M, Dong Y H, Jiang Y. Determination of soil exchangeable base cations by using atomic absorption spectrophotometer and extraction with ammonium acetate[J]. Spectroscopy and Spectral Analysis, 2012, 32(8): 2242–2245. DOI:10.3964/j.issn.1000-0593(2012)08-2242-04 |
| [15] |
李民义, 张建军, 王春香, 等. 晋西黄土区不同土地利用方式对土壤物理性质的影响[J].
水土保持学报, 2013, 27(3): 125–130, 137.
Li M Y, Zhang J J, Wang C X, et al. The effect of different land use methods on soil physical properties[J]. Journal of Soil and Water Conservation, 2013, 27(3): 125–130, 137. |
| [16] |
朱利. 坡地利用方式和改造措施对紫色土理化性质的影响[D]. 山东泰安: 山东农业大学硕士学位论文, 2012.
Zhu L. Study on the effect of slope land use and reconstruction measures on the physical and chemical properties of purple soil[D]. Tai'an, Shandong: MS Thesis of Shandong Agricultural University, 2012. |
| [17] | Turner B L II, Meyer W B. Global land-use and land-cover change: An overview[A]. Williamb M, Turner B L II. Changes in land use and land cover: A global perspective [M]. Cambridge: Cambrige University Press, 1994. |
| [18] |
孔祥斌, 张凤荣, 齐伟, 等. 集约化农区土地利用变化对土壤养分的影响[J].
地理学报, 2003, 58(3): 333–342.
Kong X B, Zhang F R, Qi W, et al. The influence of land use change on soil fertility in intensive agricultural region[J]. Acta Geographica Sinica, 2003, 58(3): 333–342. DOI:10.3321/j.issn:0375-5444.2003.03.002 |
| [19] |
龙健, 黄昌勇, 李娟. 喀斯特山区土地利用方式对土壤质量演变的影响[J].
水土保持学报, 2002, 16(1): 76–79.
Long J, Huang C Y, Li J. Effects of land use on soil quality in karsthilly area[J]. Journal of Soil and Water Conservation, 2002, 16(1): 76–79. DOI:10.3321/j.issn:1009-2242.2002.01.019 |
| [20] |
张燕, 张洪, 彭补拙, 等. 不同土地利用方式下农地土壤侵蚀与养分流失[J].
水土保持通报, 2002, 23(1): 23–31.
Zhang Y, Zhang H, Peng B Z, et al. Soil erosion and nutrient loss of various land use patterns[J]. Bulletin of Soil and Water Conservation, 2002, 23(1): 23–31. |
| [21] |
刘菊秀, 余清发, 褚国伟, 等. 鼎湖山主要森林类型土壤pH值动态变化[J].
土壤与环境, 2001, 10(1): 39–41.
Liu J X, Yu Q F, Chu G W, et al. Dynamic changes of pH value of main forest types in Dinghu Mountain[J]. Soil and Environment, 2001, 10(1): 39–41. DOI:10.3969/j.issn.1674-5906.2001.01.011 |
| [22] |
温福群, 余斌, 周富忠. 利川市耕地酸化的成因研究[J].
农业科技通讯, 2017, (10): 179–182.
Wen F Q, Yu B, Zhou F Z. Research on the cause of arable land acidification in Lichuan city[J]. Agricultural Science and Technology Communication, 2017, (10): 179–182. DOI:10.3969/j.issn.1000-6400.2017.10.064 |
| [23] | Pallant E, Riha S J. Surface soil acidification under red pine and Norway spruce[J]. Soil Science Society of America Journal, 1990, 54: 1124–1130. DOI:10.2136/sssaj1990.03615995005400040034x |
| [24] | Jobbágy E G, Jackson R B. Patterns and mechanisms of soil acidification in the conversion of grasslands to forests[J]. Biogeochemistry, 2003, 64: 205–229. DOI:10.1023/A:1024985629259 |
| [25] | Chaer G M, Myrold D D, Bottomley P J. A soil quality index based on the equilibrium between soil organic matter and biochemical properties of undisturbed coniferous forest soils of the Pacific Northwest[J]. Soil Biology and Biochemistry, 2009, 41: 822–830. DOI:10.1016/j.soilbio.2009.02.005 |
| [26] |
周富忠, 熊建成. 利川市耕地酸化成因分析及治理措施[J].
中国农技推广, 2014, 30(3): 41–43.
Zhou F Z, Xiong J C. Analysis of the causes of acidification of cultivated land in Lichuan city[J]. China Agricultural Technology Promotion, 2014, 30(3): 41–43. DOI:10.3969/j.issn.1002-381X.2014.03.022 |
| [27] | Schroder J L, Zhang H L, Girma K, et al. Soil acidification from long-term use of nitrogen fertilizers on winter wheat[J]. Soil Science Society of America Journal, 2011, 75: 957–964. DOI:10.2136/sssaj2010.0187 |
| [28] |
方日尧. 不同豆科牧草对低缓冲土壤的酸化能力[J].
北京农学院学报, 1999, (3): 3–8.
Fang R Y. The acidification capacity of different leguminous forage for low buffer soil[J]. Journal of Beijing Agricultural College, 1999, (3): 3–8. |
| [29] |
姬 钢, 徐明岗, 文石林, 等. 不同植被类型下红壤pH和交换性酸的剖面特征[J].
应用生态学报, 2015, 26(9): 2639–2645.
Ji G, Xu M G, Wen S L, et al. Profile characteristics of red soil pH and exchangeable acid in different vegetation types[J]. Journal of Applied Ecology, 2015, 26(9): 2639–2645. |
| [30] |
张永春, 汪吉东, 沈明星, 等. 长期不同施肥对太湖地区典型土壤酸化的影响[J].
土壤学报, 2010, 47(3): 465–472.
Zhang Y C, Wang J D, Shen M X, et al. Effects of long-term fertilization on soil acidification in Taihu Lake region, China[J]. Acta Pedologica Sinica, 2010, 47(3): 465–472. |
| [31] |
周晓阳, 周世伟, 徐明岗, 等. 中国南方水稻土酸化演变特征及影响因素[J].
中国农业科学, 2015, 48(23): 4811–4817.
Zhou X Y, Zhou S W, Xu M G, et al. Evolution characteristics and influence factors of acidification in paddy soil of southern China[J]. Scientia Agricultura Sinica, 2015, 48(23): 4811–4817. DOI:10.3864/j.issn.0578-1752.2015.23.022 |
| [32] |
叶文培, 谢小立, 王凯荣, 李志国. 不同时期秸秆还田对水稻生长发育及产量的影响[J].
中国水稻科学, 2008, 22(1): 65–70.
Ye W P, Xie X L, Wang K R, Li Z G. Effects of rice straw manuring in different periods on growth and yield of rice[J]. Chinese Journal of Rice Science, 2008, 22(1): 65–70. DOI:10.3321/j.issn:1001-7216.2008.01.011 |
| [33] |
周领. 秸秆类型和土壤性质对 CO2-C 释放速率和土壤 pH 影响的研究[D]. 杭州: 浙江大学硕士学位论文, 2010.
Zhou L. Effect of different crop residues and soil properties on CO2-C evolved rate and pH in red soil [D]. Hangzhou: MS Thesis of Zhejiang University, 2010. |
| [34] |
蒲玉琳, 张宗锦, 刘世全, 等. 西藏土壤钙、镁、钾、钠的迁移和聚集特征[J].
水土保持学报, 2010, 24(1): 86–90.
Pu Y L, Zhang Z J, Liu S Q, et al. Transplant and accumulation characteristics of Ca, Mg, K and Na in Tibet soils[J]. Journal of Soil and Water Conservation, 2010, 24(1): 86–90. |
| [35] |
李艾芬, 麻万诸, 章明奎. 水稻土的酸化特征及其起因[J].
江西农业学报, 2014, 26(1): 72–76.
Li A F, Ma W Z, Zhang M K. Characteristics and causes of acidification of paddy soils[J]. Acta Agriculturae Jiangxi, 2014, 26(1): 72–76. DOI:10.3969/j.issn.1001-8581.2014.01.020 |
| [36] |
姜 林, 耿增超, 李珊珊, 等. 祁连山西水林区土壤阳离子交换量及盐基离子的剖面分布[J].
生态学报, 2012, 32(11): 3368–3377.
Jiang L, Geng Z C, Li S S, et al. Soil cation exchange capacity and exchangeable base cation content in the profiles of four typical soils in the Xi-Shui Forest Zone of the Qilian Mountains[J]. Acta Ecologica Sinica, 2012, 32(11): 3368–3377. |
| [37] | Jiang Y, Zhang Y G, Liang W J. Land use effect on the profile distribution of sulfur in an aquic brown soil[J]. Agricultural Journal, 2007, 2(1): 49–54. |
| [38] |
凌大炯, 章家恩, 黄倩春, 等. 模拟酸雨对砖红壤盐基离子迁移和释放的影响[J].
土壤学报, 2007, 44(3): 444–450.
Ling D J, Zhang J E, Huang Q C, et al. The influence of acid rain on the migration and release of the base ions in lateritic soil[J]. Acta Pedologica Sinica, 2007, 44(3): 444–450. DOI:10.3321/j.issn:0564-3929.2007.03.010 |
| [39] |
黄尚书, 叶川, 钟义军, 等. 不同土地利用方式对红壤坡地土壤阳离子交换量及交换性盐基离子的影响[J].
土壤与作物, 2016, 5(2): 72–77.
Huang S S, Ye C, Zhong Y J, et al. Effects of different land use methods on the cation exchange capacity and exchangeable base ions of red soil slopes[J]. Soil and Crops, 2016, 5(2): 72–77. |
 2018, Vol. 24
  doi:
doi: 

