文章信息
- 膀胱癌诊断与预后相关基因TPM1和CALD1的筛选及验证
- Screening and Verification of TPM1 and CALD1 Related to Diagnosis and Prognosis of Bladder Cancer
- 肿瘤防治研究, 2021, 48(9): 827-832
- Cancer Research on Prevention and Treatment, 2021, 48(9): 827-832
- http://www.zlfzyj.com/CN/10.3971/j.issn.1000-8578.2021.20.1536
- 收稿日期: 2020-12-28
- 修回日期: 2021-05-12
膀胱癌(bladder urothelial carcinoma, BLCA)是最常见的泌尿系恶性肿瘤之一。据估计,至2020年,美国将有81400例新发病例和17980例死亡[1]。膀胱肿瘤一旦出现肌层浸润或发生转移,现有的手术与普通化疗相结合的治疗方法疗效有限,患者死亡率较高[2-3]。因此,提高膀胱癌患者的早期诊断率和寻找新的药物靶标是现阶段膀胱癌研究的重要任务。
随着基因组技术的发展,将生物信息学用于基因表达谱分析以研究分子机制已成为领域热点[4]。其中,加权基因共表达网络分析(weighted gene correlation network analysis, WGCNA)是一种从全基因组表达理解基因功能和基因关联的重要方法[5]。WGCNA通过探索共表达的基因模块,针对基因的共表达网络与临床特征之间的关系,能够识别出网络中的枢纽基因[6]。与通过固定的阈值筛选基因机械地构建共表达网络的方法相比,WGCNA通过引入加权相关系数来描述基因间的相互联系,能够更加全面地体现基因间的相关性,更具有生物学意义。
生物标志物有助于疾病诊断、判断疾病分期,也可用来评价新药或新疗法在目标人群中的安全性和有效性。本研究通过WGCNA和差异基因表达分析来自肿瘤基因组图谱(The Cancer Genome Atlas, TCGA)数据库和基因表达综合(Gene Expression Omnibus, GEO)数据库的膀胱癌mRNA的表达数据,获得差异共表达基因。然后利用综合的生物信息学分析进行生物标志物挖掘,对利用数据挖掘发现新型生物标志物这一思路进行探索和验证。
1 材料与方法 1.1 数据库样本获取从TCGA数据库的TCGA-BLCA数据集中下载414例膀胱癌患者和19例正常对照组的基因表达谱及样本的临床资料和预后数据。从GEO数据库的微阵列数据集GSE13507下载188例膀胱癌以及68例正常对照组数据(10例正常组织和58例癌旁组织)及样本的临床资料和预后数据。样本纳入标准:生存时间 > 30天,排除标准生存时间≤30天。
1.2 加权共表达网络分析利用R软件“WGCNA”软件包进行加权共表达网络分析[5],根据标准无尺度网络选择TCGA和GSE13507的膀胱癌数据集合适的软阈值,分别为4和11。加权计算邻接矩阵和拓朴矩阵(TOM),利用动态剪切树法行层次聚类,得到差异基因的整体聚类树,聚类树的分支即定义为基因模块。再通过聚类合并得出相似程度高的基因模块,构建出加权共表达网络。最终选择相关性最高的模块进行下一步分析。
1.3 基因的差异表达分析及差异共表达基因的识别使用R软件中的“limma”软件包进行TCGA-BLCA和GSE13507数据集中的膀胱癌和正常对照组之间的基因表达差异分析,以|logFC|≥1.0且P < 0.05的标准对结果进行筛选,得到两个数据集的差异表达基因谱。将WGCNA得到的相关性最高共表达模块基因与差异表达基因取交集,得到差异共表达相关基因,利用“Venndiagram”软件包构建韦恩图。
1.4 GO和KEGG基因富集分析使用R软件进行GO(go ontology)富集分析和KEGG(kyoto Encyclopedia of genes and genomes)富集分析,对交集基因的生物学过程(biological process, BP)、细胞组分(cell component, CC)、分子功能(molecular function, MF)及通路进行富集分析。
1.5 构建蛋白互作网络识别枢纽基因使用STRING在线数据库(https://string-db.org/)[7]对交集基因进行蛋白互作网络分析。评分≥0.9的基因通过使用Cytoscape软件(3.7.2)绘制可视化蛋白互作网络[8],并使用软件CytoHubba插件识别出连接度最高的前十个枢纽基因[9]。
1.6 样本收集及随访2016年1月—2019年8月间共收集41例膀胱全切术中的新鲜组织标本,置于RNA latter保护液中(美国Invitrogen公司)液氮保存。随访截至2020年11月。至随访结束时,12例患者失访,共收集29例患者的总体生存期、预后及其他临床信息。本研究均通过患者知情同意,并经郑州市人民医院伦理委员会批准。
1.7 实时荧光定量qRT-PCR使用TRIzol试剂(美国Invitrogen公司)提取细胞和组织样品的总RNA,引物序列见表 1。使用ABI PRISM 7000荧光定量PCR系统(美国Applied Biosyste公司)进行检测。
TPM1单抗和CALD1单抗购自美国Cell Signaling Technology公司。Tubulin抗体购自中杉金桥公司。使用ProteoJET™细胞裂解液(美国ThermoFisher Scientific公司)提取细胞总蛋白,12%SDS-PAGE电泳分离,将蛋白条带转移至PVDF膜(美国Millipore公司),5%TBST配制的脱脂牛奶室温封闭1 h,4℃一抗孵育过夜,TBST洗膜三次共15 min,HRP标记的二抗(中杉金桥公司)室温孵育1 h,ECL显影。
1.9 获得免疫组织化学数据从人类蛋白图谱(HPA)数据库中搜索相关基因的免疫组织化学图片,对TPM1和CALD1可能是风险基因进行验证。
1.10 统计学方法使用Student’s t检验进行数据比较分析,使用Kaplan-Meier单变量生存分析探索总生存期(OS)与枢纽基因间的关系。使用在线分析工具GEPIA2(http://gepia2.cancer-pku.cn/)研究无病生存期(DFS)与枢纽基因间的关系[10]。定义基因表达量的中位数作为高低表达的截断值。P < 0.05为差异有统计学意义。
2 结果 2.1 WGCNA识别膀胱癌相关模块我们利用WGCNA分别构建了13个和10个模块分析发现,TCGA-BLCA数据集中的蓝色模块和GSE13507数据集中的青色模块与样本性状的相关性最强(蓝色模块:相关系数=0.88,P < 0.001; 青色模块:相关系数=0.63,P < 0.001)。
2.2 差异表达基因谱构建及交集基因的识别数据集TCGA-BLCA和GSE13507分别筛选出915和464个差异表达基因。将WGCNA软件分析得出的两个高度相关共表达模块所包含的基因与两个数据集的差异基因取交集,最终得到156个交集基因。
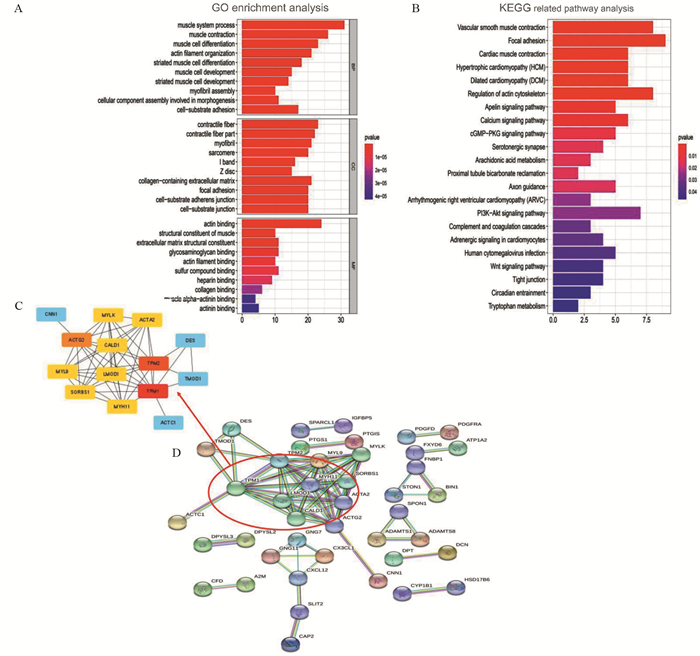
2.3 功能富集分析GO富集分析显示,156个基因的生物学过程主要集中在肌细胞的生长分化与进展; 细胞组分主要与肌肉纤维的收缩有关; 分子功能主要与肌动蛋白结合相关。而在KEGG的通路富集分析中,156个基因主要与黏着斑激酶信号通路(focal adhesion,FAK)、肌动蛋白调控以及PI3K-Akt信号通路有关,见图 1A~B。

|
| GO: gene ontology; KEGG: kyoto encyclopedia of genes and genomes; BP: biological process; CC: cell component; MF: molecular function. 图 1 156个交集基因功能富集分析(A, B)和蛋白质互作网络的构建及枢纽基因的识别(C, D) Figure 1 Functional enrichment analysis of 156 intersection genes(A, B), 10 pivotal genes and PPI network(C, D) |
通过构建蛋白互作网络,得到连接度最高的10个枢纽基因,分别是ACTO2、MYL9、SORBS1、MYL1、CALD1、LM0D1、MYH11、ACTA2、TPM2和TPM1,见图 1C~D。
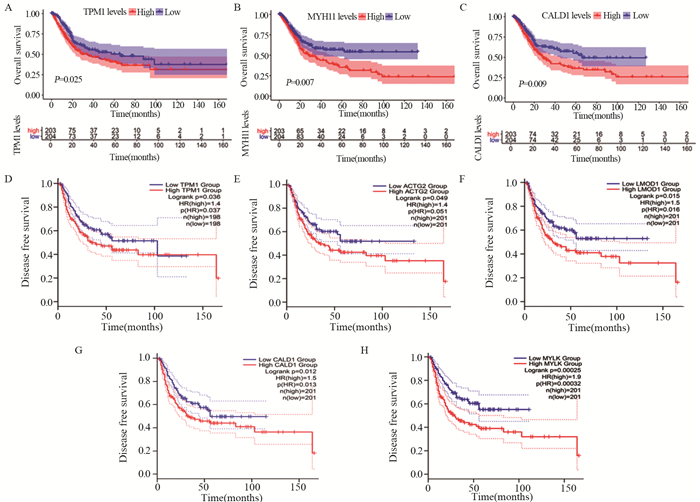
2.5 膀胱癌生物标志物的识别TCGA-BLCA数据集中,TPM1、CALD1和MYH11基因的表达量与OS呈负相关,见图 2A~C。GEPIA2数据库中,TPM1、ACTG2、LMOD1、CALD1和MYLK基因的表达量与DFS呈负相关,见图 2D~H。TPM1和CALD1基因与膀胱癌的预后有相关性。临床亚组分析显示,TPM1和CALD1的表达量与膀胱癌的分级和WHO分期呈负相关(均P < 0.05),见图 3。

|
| 图 2 枢纽基因表达水平与膀胱癌患者总生存期(A~C)和无病生存期(D~H)的Kaplan-Meier曲线 Figure 2 Kaplan-Meier curves of hub gene expressions and OS(A-C), DFS(D-H) of bladder cancer patients |

|
| 图 3 TPM1(A, B)和CALD1(C, D)基因在不同临床亚组中的表达差异 Figure 3 Differences of TPM1(A, B) and CALD1(C, D) expression in different clinical subgroups |
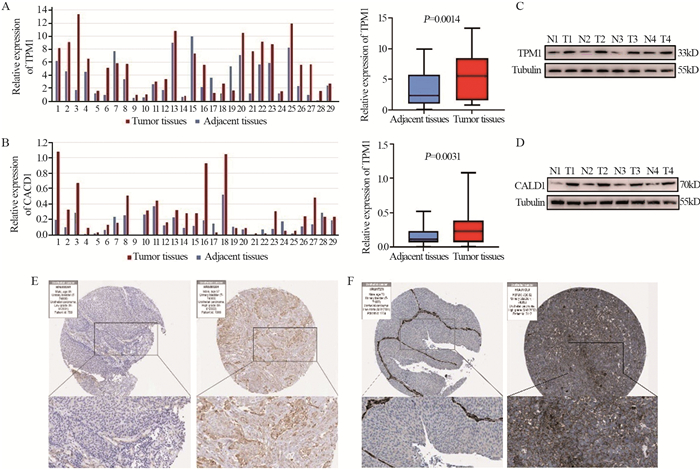
qRT-PCR实验结果显示在真实世界的样本中,TPM1和CALD1基因在肿瘤组织中的表达较癌旁正常组织上调(TPM1: P=0.0014, CALD1: P=0.0031),见图 4A~B。Western blot结果显示,TPM1与CALD1蛋白均在肿瘤组织中高表达,见图 4C~D。免疫组织化学结果显示,TPM1及CALD1的蛋白在高级别膀胱癌细胞中的表达较低级别膀胱癌细胞更高,见图 4E~F。依据qRT-PCR测定的基因表达量,我们以外部验证组TPM1和CALD1表达量的中位值(7.69和9.59)作为截断值分为高表达与低表达组。结合随访数据观察发现,TPM1和CALD1高表达组预后较低表达组均较差(TPM1: P=0.026, CALD1: P=0.028)。由此得出,TPM1及CALD1基因有望成为诊断标志物及预后标志物。

|
| A, B: different expression of TPM1 and CALD1 between tumor tissues and adjacent tissues of 29 external verification samples; C, D: the expression of TPM1, CALD1 and Tubulin markers were determined using Western blot; E, F: the expression of TPM1 and CALD1 between tumor tissues and adjacent tissues were determined using immunohistochemistry in HPA database; N: non-tumor; T: tumor. 图 4 验证TPM1和CALD1基因在外部验证组中的诊断价值 Figure 4 Verification of diagnostic value of TPM1 and CALD1 genes in external verification group |
在中国,膀胱癌的死亡率与发病率呈逐年上升趋势,淋巴结转移和肌层浸润是导致膀胱癌预后差的重要原因之一[11]。截至目前,暂无有效的治疗策略来降低膀胱癌的致死率,它仍然是恶性程度最高的泌尿系肿瘤之一[12]。因此,需要找到能够预测膀胱癌预后及进展的生物标志物,该标志物在日后也可能成为膀胱癌治疗突破的靶点。本研究采用WGCNA、表达差异分析、生存分析等综合生物信息学方法,在TCGA-BLCA和GSE13507数据集中鉴定出156个具有相同表达趋势的重要基因。根据GO和KEGG分析结果,这些基因主要富集在肌肉组织的生长和分化、肌动蛋白的功能以及与肿瘤进展相关的FAK和PI3K-Akt信号通路,肌肉组织相关功能也预示着肿瘤细胞有肌层浸润的趋势。将这156个基因构建蛋白互作网络图,使用Cytoscape中的CytoHubba插件筛选出了与膀胱癌最相关的前十个基因(即ACTO2、MYL9、SORBS1、MYL1、CALD1、LM0D1、MYH11、ACTA2、TPM2和TPM1),并且发现TPM1和CALD1基因的表达量越高,患者OS和DFS就越短。同时,在高级别膀胱癌中,TPM1和CALD1均被上调,以上结果表明TPM1和CALD1可能是膀胱癌不良预后和肿瘤进展的风险基因。
本研究利用郑州人民医院收治的膀胱癌患者组织,检测了TPM1和CALD1基因在肿瘤与癌旁正常组织之间的表达与蛋白翻译水平,发现在此外部验证组中,所研究的两个基因均存在较大差异,充分证明TPM1和CALD1可能是膀胱癌不良预后和肿瘤进展的风险基因。
TPM1是肌动蛋白结合蛋白基因家族中的一员,位于细胞膜上,影响着细胞黏附和细胞信号通道的转导。但是关于TPM家族基因在不同肿瘤中的表达水平存在争议,比如在结肠癌[13]、神经胶质瘤[14]、神经母细胞瘤[15-16]等肿瘤中TPM1的表达均较正常组织下调,然而在卵巢癌[17]和肝外胆管癌[18]中的表达上调。而TPM1下调使细胞骨架重构,促进细胞发生变化,进而发生上皮-间质转化(epithelial-mesenchymal transition, EMT),是肿瘤发生的重要机制[19]。Pawlak等发现TPM1和TPM2的表达下调可能主要发生在膀胱癌早期[20]。CALD1基因是钙调结合蛋白家族基因的一员,相关研究较少。有研究报道,TPM1与CALD1基因在膀胱癌中存在肿瘤特异性剪接改变,可能干扰相应的RNA及蛋白表达[19]。本研究同样发现TPM1与CALD1基因在肿瘤组织中高表达,进一步提示了它们在肿瘤中或发挥重要作用。
综上所述,通过WCGNA和差异基因综合分析,本研究筛选并验证了与膀胱癌预后紧密相关的基因,同时TPM1和CALD1基因是促进肿瘤进展的枢纽基因,有望成为膀胱癌诊断和预后的标志物。
作者贡献
赵阳:实验设计、实施及论文撰写
常富江:实验数据分析
葛雷、张楠:实验设计及指导
单中杰:实验设计及论文审校
| [1] |
Siegel RL, Miller KD, Jemal A. Cancer statistics, 2020[J]. CA Cancer J Clin, 2020, 70(1): 7-30. DOI:10.3322/caac.21590 |
| [2] |
von der Maase H, Hansen SW, Roberts JT, et al. Gemcitabine and cisplatin versus methotrexate, vinblastine, doxorubicin, and cisplatin in advanced or metastatic bladder cancer: results of a large, randomized, multinational, multicenter, phase Ⅲ study[J]. J Clin Oncol, 2000, 18(17): 3068-3077. DOI:10.1200/JCO.2000.18.17.3068 |
| [3] |
Roberts JT, von der Maase H, Sengeløv L, et al. Long-term survival results of a randomized trial comparing gemcitabine/cisplatin and methotrexate/vinblastine/doxorubicin/cisplatin in patients with locally advanced and metastatic bladder cancer[J]. Ann Oncol, 2006, 17 Suppl 5: v118-v122. |
| [4] |
Can T. Introduction to bioinformatics[J]. Methods Mol Biol, 2014, 1107: 51-71. |
| [5] |
Langfelder P, Horvath S. WGCNA: an R package for weighted correlation network analysis[J]. BMC Bioinformatics, 2008, 9: 559. DOI:10.1186/1471-2105-9-559 |
| [6] |
Zhang B, Horvath S. A general framework for weighted gene co-expression network analysis[J]. Stat Appl Genet Mol Biol, 2005, 4: Article17. |
| [7] |
Szklarczyk D, Gable AL, Lyon D, et al. STRING v11: protein-protein association networks with increased coverage, supporting functional discovery in genome-wide experimental datasets[J]. Nucleic Acids Res, 2019, 47(D1): D607-D613. DOI:10.1093/nar/gky1131 |
| [8] |
Shannon P, Markiel A, Ozier O, et al. Cytoscape: a software environment for integrated models of biomolecular interaction networks[J]. Genome Res, 2003, 13(11): 2498-2504. DOI:10.1101/gr.1239303 |
| [9] |
Chin CH, Chen SH, Wu HH, et al. cytoHubba: identifying hub objects and sub-networks from complex interactome[J]. BMC Syst Biol, 2014, 8 Suppl 4: S11. |
| [10] |
Tang Z, Kang B, Li C, et al. GEPIA2: an enhanced web server for large-scale expression profiling and interactive analysis[J]. Nucleic Acids Res, 2019, 47(W1): W556-W560. DOI:10.1093/nar/gkz430 |
| [11] |
Chen W, Zheng R, Baade PD, et al. Cancer statistics in China, 2015[J]. CA Cancer J Clin, 2016, 66(2): 115-132. DOI:10.3322/caac.21338 |
| [12] |
Jacobs BL, Lee CT, Montie JE. Bladder cancer in 2010: how far have we come?[J]. CA Cancer J Clin, 2010, 60(4): 244-272. DOI:10.3322/caac.20077 |
| [13] |
Petrova DT, Asif AR, Armstrong VW, et al. Expression of chloride intracellular channel protein 1 (CLIC1) and tumor protein D52 (TPD52) as potential biomarkers for colorectal cancer[J]. Clin Biochem, 2008, 41(14-15): 1224-1236. DOI:10.1016/j.clinbiochem.2008.07.012 |
| [14] |
Ku BM, Ryu HW, Lee YK, et al. 4'-Acetoamido-4-hydroxychalcone, a chalcone derivative, inhibits glioma growth and invasion through regulation of the tropomyosin 1 gene[J]. Biochem Biophys Res Commun, 2010, 402(3): 525-530. DOI:10.1016/j.bbrc.2010.10.068 |
| [15] |
Yager ML, Hughes JAI, Lovicu FJ, et al. Functional analysis of the actin-binding protein, tropomyosin 1, in neuroblastoma[J]. Br J Cancer, 2003, 89(5): 860-863. DOI:10.1038/sj.bjc.6601201 |
| [16] |
Alaiya AA, Oppermann M, Langridge J, et al. Identification of proteins in human prostate tumor material by two-dimensional gel electrophoresis and mass spectrometry[J]. Cell Mol Life Sci, 2001, 58(2): 307-311. DOI:10.1007/PL00000858 |
| [17] |
Tang HY, Beer LA, Tanyi JL, et al. Protein isoform-specific validation defines multiple chloride intracellular channel and tropomyosin isoforms as serological biomarkers of ovarian cancer[J]. J Proteomics, 2013, 89: 165-178. DOI:10.1016/j.jprot.2013.06.016 |
| [18] |
Zare M, Jazii FR, Soheili ZS, et al. Downregulation of tropomyosin-1 in squamous cell carcinoma of esophagus, the role of Ras signaling and methylation[J]. Mol Carcinog, 2012, 51(10): 796-806. DOI:10.1002/mc.20847 |
| [19] |
Thorsen K, Sørensen KD, Brems-Eskildsen AS, et al. Alternative splicing in colon, bladder, and prostate cancer identified by exon array analysis[J]. Mol Cell Proteomics, 2008, 7(7): 1214-1224. DOI:10.1074/mcp.M700590-MCP200 |
| [20] |
Pawlak G, Mcgarvey TW, Nguyen TB, et al. Alterations in tropomyosin isoform expression in human transitional cell carcinoma of the urinary bladder[J]. Int J Cancer, 2004, 110(3): 368-373. DOI:10.1002/ijc.20151 |
 2021, Vol. 48


