 2020, Vol. 47
文章信息
- 浙江省基于卫星遥感数据的气溶胶光学厚度与肺癌的相关性
- Association of Aerosol Optical Depth Based on Satellite Remote Sensing Data and Lung Cancer in Zhejiang Province
- 肿瘤防治研究, 2020, 47(10): 776-781
- Cancer Research on Prevention and Treatment, 2020, 47(10): 776-781
- http://www.zlfzyj.com/CN/10.3971/j.issn.1000-8578.2020.20.0419
- 收稿日期: 2020-04-26
- 修回日期: 2020-08-23
引用本文 |


2. 310022 杭州,中国科学院基础医学与肿瘤研究所,中国科学院大学附属肿瘤医院,浙江省肿瘤医院肿瘤研究所
2. Institute of Basic Medicine and Cancer, Chinese Academy of Science, Cancer Hospital of University of Chinese Academy of Science, Zhejiang Cancer Hospital, Research Institute of Zhejiang Cancer, Hangzhou 310022, China
2015年浙江省肿瘤登记地区肺癌发病位居第一位,严重影响浙江省居民的身心健康[1]。大气环境质量与人们的身体健康有着极其密切的关系,大气污染物以悬浮气溶胶的形式可直接进入呼吸系统,损害呼吸系统的细胞,引发呼吸系统疾病的发生,甚至致癌。目前已有流行病学研究证实了大气污染与肺癌的强关联性[2]。研究表明因工业废气、汽车尾气等因素造成的大气环境污染与肺癌发病和死亡风险增加密切相关[3]。大气气溶胶是悬浮在地球大气中的10-3~10 μm分子团、液态或固态粒子所组成的混合物,具有稳定性和沉降速度小的特点。气溶胶光学厚度(aerosol optical depth, AOD)为气溶胶的消光系数在垂直方向上的积分,反映了气溶胶的消光特性,是描述气溶胶对光的衰减作用的观测指标[4]。研究表明AOD与地面颗粒物浓度、能见度等都具有一定相关性,可以作为表征大气污染程度评价的重要指标[5-6]。有研究表明AOD可以作为衡量大气污染物的指标,且与人群健康结局存在暴露反应关系[7]。目前有关气溶胶光学厚度与肺癌的相关性研究较少。本研究收集NASA卫星获取的气溶胶光学厚度数据,分析浙江省肿瘤登记地区气溶胶光学厚度与肺癌风险的相关性,为科学评价气溶胶光学厚度在肿瘤风险评价中的应用提供参考依据。
1 资料与方法 1.1 MODIS气溶胶光学厚度和PM2.5数据来源本研究所采用的气溶胶光学厚度为美国中分辨率成像光谱仪(moderate-resolution imaging spectroradiometer, MODIS)的二级气溶胶合成产品。MODIS是“图谱合一”的光学遥感仪器,包括专门用于气溶胶探测的波段,分别搭载在美国地球观测系统(EOS)系列中的极地轨道环境遥感卫星Terra和Aqua卫星上,具备宽波段覆盖(36个波段)、中高空间分辨率(250~1000 m)、高时间频次的特点,可用于全球气溶胶光学参数的反演,并广泛应用于气候模型计算、环境污染动态变化分析和空气质量监测[8]。本研究采用的是MODIS 2010—2014年的二级气溶胶产品,空间分辨率为10 km。AOD是描述气溶胶对光的衰减作用的物理量,无量纲,其值一般介于0~2左右。AOD越高,则大气气溶胶对光衰减作用越强烈,提示大气能见度越低、空气质量较差。空气动力学当量直径≤2.5 μm的颗粒物(particulate matter with aerodynamic diameter less than, PM2.5),也称细颗粒物。2014年全省以及浙江省14个肿瘤登记地区PM2.5数据来源于浙江省生态环境监测中心环境统计年报。PM2.5由环境空气颗粒物连续自动检测系统检测而得,系统配置的监测仪器测量方法为β射线吸收法。仪器采样滤膜对0.3 μm颗粒物截留率≥99.7%,浓度测量范围0~1000 μg/m3,最小显示单位0.1 μg/m3。
1.2 浙江省2015年肺癌发病率及社会经济学数据来源浙江省肿瘤登记地区2015年肺癌发病率数据来源于《2018中国肿瘤登记年报》[9]中的浙江省14个肿瘤登记处的肺癌发病率资料,14个肿瘤登记处分布在浙江省的11个地级市,按地级以上城市和县(县级市)划分城市和农村,其中杭州、嘉兴南湖区、宁波鄞州区、温州鹿城区和绍兴上虞区为城市肿瘤登记处,慈溪、海宁、嘉善、开化、仙居、永康、龙泉、长兴和岱山为农村肿瘤登记处。2015年浙江省14个肿瘤登记地区覆盖人口14 114 404人,约占全省户籍人口的29.00%[10]。2014年社会经济学数据人均可支配收入来源于《2014浙江统计年鉴》[11]。
1.3 统计学方法采用SPSS20.0统计软件进行数据分析,2010—2014各年度AOD值经Kolmogorov-Smirnov Z正态性检验均为正态性分布。2014年PM2.5数据呈正态性分布(Z=0.618, P=0.840)。正态分布指标采用均数±标准差(x±s)表示,两组比较采用t检验; 不同组间率的比较采用χ2检验,并采用多元线性回归方法进行相关分析[12]。统计检验均为双侧概率检验,P < 0.05为差异有统计学意义。
2 结果 2.1 浙江省2010—2014年气溶胶光学厚度城乡比较2010—2014年浙江省AOD均值分别为0.389±0.108、0.539±0.146、0.485±0.134、0.458±0.140和0.550±0.149,AOD走势呈缓慢升高态势。空间分布上,浙江省AOD空间分布具有较强的地域性,AOD高值区主要分布在杭嘉湖平原、宁绍平原和金衢盆地一带,浙南山地及浙东沿海丘陵区AOD值相对较低,见图 1。

|
| 图 1 2010—2014年浙江省气溶胶光学厚度遥感监测分布图 Figure 1 Distribution graph of aerosol optical depth in Zhejiang Province from 2010 to 2014 |
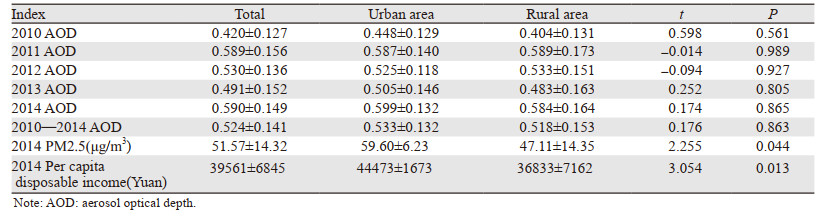
浙江省14个肿瘤登记地区2010—2014年各年度AOD,见图 2。2010—2014年浙江省肿瘤登记地区AOD值平均0.524±0.141,其中城市地区为0.533±0.132、农村地区为0.518±0.153;各年度城乡间AOD值差异均无统计学意义(均P > 0.05),见表 1。

|
| AOD: aerosol optical depth 图 2 浙江省14个肿瘤登记地区2010—2014年气溶胶光学厚度值比较 Figure 2 Aerosol optical depth values in Zhejiang cancer registration areas from 2010 to 2014 |
|
2014年浙江省肿瘤登记地区PM2.5平均浓度为(51.57±14.32)μg/m3,城乡间PM2.5浓度差异有统计学意义(P < 0.05);2014年浙江省肿瘤登记地区人均可支配收入为(39561±6845)元,城乡间人均可支配收入差异有统计学意义(P < 0.05),见表 1。
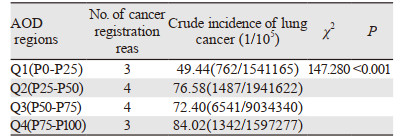
2.2 不同气溶胶光学厚度地区肺癌发病率比较浙江省肿瘤登记地区2010—2014年AOD值四分位数P25为0.408,P50为0.543,P75为0.629。以四分位间距为界将AOD水平地区分为4类,Q1(P0~P25)、Q2(P25~P50)、Q3(P50~P75)和Q4(P75~P100)地区的肺癌发病率分别为49.44/10万、76.58/10万、72.40/10万和84.02/10万, 不同AOD水平地区肺癌发病率差异有统计学意义(χ2=147.280, P < 0.001),见表 2。
|
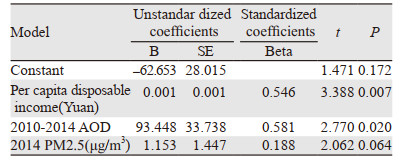
以肺癌发病率为因变量,以人均可支配收入、2014年PM2.5、2010—2014年AOD水平为自变量进行多重线性回归分析,结果显示:2010—2014年AOD水平和人均可支配收入是影响肺癌发病率的有统计学意义的影响因素,见表 3。该模型的复相关系数为0.823。该线性模型残差间相互独立,Durbin-Watson=1.949,见图 3。
|

|
| 图 3 气溶胶光学厚度与肺癌发病率的多重线性回归模型PP图 Figure 3 PP figure of multiple linear regression model analysis for association between aerosol optical depth and lung cancer incidence |
2014年中国肺癌估计新发病例78.15万例,发病率为57.13/10万[13]。国家卫生健康委员会统计信息中心数据显示2015年中国肺癌医疗总费用达243.1亿元,约为卫生总费用的0.6%[14]。浙江省肿瘤登记地区2010—2014年肺癌发病位居浙江省肿瘤第一位,而且肺癌发病率比全国平均水平高11.24%[15]。随着人口老龄化问题、城镇化建设推进,环境污染问题日益突显,肺癌发病率呈明显上升趋势,给社会和家庭带来了沉重的负担[16]。
大气污染是癌症明确的危险因素。大气污染程度与肺癌的发病和死亡存在关联,且关联大小受到经济状况、暴露时间和暴露剂量等影响,室外大气污染增加肺癌发生风险[17]。由于卫星具有大尺度动态监测功能,可以系统地提供大范围生态环境监测结果,有研究表明气溶胶光学厚度与二氧化氮、臭氧、PM2.5、一氧化碳、二氧化硫等环境污染物有较好的相关性[18]。Jenwitheesuk等[19]通过长期监测基于卫星遥感的泰国各地数据的气溶胶组分,评估周围气溶胶组分对肺癌发病率的影响,结果显示气溶胶组分和肺癌之间存在强关联性。本研究选用基于卫星遥感AOD指标综合反映大气污染程度,分析AOD与肺癌的相关性。结果显示,浙江省肿瘤登记地区2010—2014年AOD中位数为0.543[0.408, 0.629]。以四分位间距为界分为4类AOD水平地区,不同AOD水平地区肺癌发病率差异有统计学意义(χ2=147.280, P < 0.001),可见AOD与肺癌存在相关性,从生态流行病学的角度阐释了环境与肺癌的关系。
近年来众多学者研究了PM2.5与肺癌相关性的研究[20-21]。美国国家癌症研究所对2008—2012年肿瘤发病资料和1998—2007年PM2.5数据进行时间序列分析,研究发现长时间PM2.5暴露与肺癌发生风险相关[22]。在欧洲17个国家开展的人群队列研究中,平均随访12.8年,新确诊2095例肺癌; Cox回归模型分析显示,PM2.5增加肺癌发生风险(HR=1.18, 95%CI: 0.96~1.46)[23]。我国国家癌症登记中心分析基于遥感的PM2.5数据与肺癌发病的相关性,结果显示,PM2.5浓度每增加10 μg/m3增加肺癌发病的风险(HR=1.038, 95%CI: 1.038~1.072)[24]。本研究结果显示浙江省肿瘤登记地区2014年PM2.5浓度平均为(51.57±14.32)μg/m3,其中城市地区PM2.5浓度为(59.60±6.23)μg/m3,农村地区PM2.5浓度为(47.11±14.35)μg/m3; 城乡间PM2.5浓度差异有统计学意义(t=2.255, P=0.044);但多元回归分析结果显示PM2.5浓度与肺癌无统计学意义相关,有待进一步观察研究。
社会经济指标在肿瘤发生发展中起到重要的作用,社会经济指标是否改变了空气污染对健康结果的影响,一些学者做了相关研究。李媛秋等[25]利用全球癌症数据库GLOBOCAN 2018中的171个国家肺癌发病和死亡数据,分析比较不同人类发展指数地区肺癌的发病率,结果显示,全球肺癌发病率与人类发展指数水平呈正相关,最高人类发展指数地区的肺癌发病率最高,经济发展水平与肺癌疾病负担密切相关。Guo等[26]以2006—2014年中国癌症登记处的健康数据为基础,采用控制天气状况和社会经济指标的多变量线性回归模型分析与肺癌年发病率之间关系,结果发现,在经济较低或教育程度较低的县(区),城市地区PM2.5与男性肺癌发病率之间存在更强的关系,低收入或低学历的男性居民面临着PM2.5对肺癌发生率的更大影响。社会经济在一定程度上影响了人们的生活方式、教育水平、医疗资源等社会资源的获取,从而对健康产生了明显的影响。
本研究多重线性回归分析结果显示,人均可支配收入和2010—2014年AOD均值是影响肺癌发病率的主要影响因素,且有统计学意义,可见社会经济水平以及AOD水平影响肺癌的发生率。
本研究属于生态流行病学的横断面研究,研究深度有限; 其次,肺癌的危险因素众多,除了社会经济水平、空气污染外,吸烟、肿瘤家族史、肺部疾病相关疾病史、生活方式等均与肺癌发生存在相关性,本文未能将更多的危险因素列入分析,今后将进一步扩大危险因素指标综合分析。
综上,大气污染和肺癌呈强关联性,基于卫星遥感数据的气溶胶光学厚度与肺癌发病率密切相关。随着卫星遥感技术的发展以及利用卫星数据反演气溶胶光学厚度方法的进步,AOD数据的可利用程度将会大大提高。AOD指标作为一个新颖的有效的大气环境监测指标,可用于大气环境质量评价大气污染物对人群健康的影响,从而为制定大气污染防治政策提供更坚实的人群健康证据。
(致谢: 本文MODS气溶胶光学厚度数据由美国航空航天局(NASA)戈德太空飞行中心获得,谨致谢忱!)
作者贡献
俞建:研究设计、数据分析、论文撰写
俞洁:研究设计、论文审核
应倩:研究设计、数据分析
于海燕、张自力:数据收集、文献分析
| [1] |
郑荣寿, 孙可欣, 张思维, 等. 2015年中国恶性肿瘤流行情况分析[J]. 中华肿瘤杂志, 2019, 41(1): 19-28. [Zheng RS, Sun KX, Zhang SW, et al. Report of cancer epidemiology in China, 2015[J]. Zhonghua Zhong Liu Za Zhi, 2019, 41(1): 19-28.] |
| [2] |
Guo Y, Zeng H, Zheng R, et al. The association between lung cancer incidence and ambient air pollution in China:a spatiotemporoal analysis[J]. Environ Res, 2016, 144. |
| [3] |
Chen GB, Wan X, Yang GH, et al. Traffic-related air pollution and lung cancer: a meta-analysis[J]. Thorac Cancer, 2015, 6(3): 307-318. DOI:10.1111/1759-7714.12185 |
| [4] |
厉青, 陈良富. 大气环境卫星遥感技术及其应用[M]. 北京: 科学出版社, 2010. [Li Q, Chen LF. Satellite Remote Sensing Technology for Atmospheric Environment and Application[M]. Beijing: Science Press, 2010.]
|
| [5] |
张新蕾, 黄凤荣. 基于大连市MODIS数据的气溶胶光学厚度与PM2.5和PM10的相关性分析[J]. 国土与自然资源研究, 2017, 6: 59-61. [Zhang XL, Huang FR. Correlative Analysis of Aerosol Optical Thickness and PM2.5 and PM10 Based on MODIS Data of Dalian[J]. Guo Tu Yu Zi Ran Zi Yuan Yan Jiu, 2017, 6: 59-61.] |
| [6] |
Gharibvand L, Shavlik D, Ghamsary M, et al. The association between ambient fine particulate air pollution and lung cancer incidence: results from the AHSMOG-2 study[J]. Enviorn Health Perspect, 2017, 125(3): 378-384. DOI:10.1289/EHP124 |
| [7] |
吴筱音, 李国星, 王旭英, 等. 北京市大气污染与呼吸系统疾病死亡的相关性——基于卫星遥感数据的时空分析[J]. 北京大学学报(医学版), 2017, 49(3): 409-417. [Wu XY, Li GX, Wang XY, et al. Correlation study between respiratory death and airborne particles in Beijing: Spa-tiotemporal analysis based on satellite remote sensing data[J]. Beijing Da Xue Xue Bao (Yi Xue Ban), 2017, 49(3): 409-417.] |
| [8] |
孙晓雷, 甘伟, 林燕, 等. MODIS 3km气溶胶光学厚度产品检验及其环境空气质量指示[J]. 环境科学学报, 2015, 35(6): 1657-1666. [Sun XL, Gan W, Lin Y, et al. Validation of MODIS 3 km aerosol optical depth product and its air quality indication[J]. Huan Jing Ke Xue Xue Bao, 2015, 35(6): 1657-1666.] |
| [9] |
赫捷, 魏文强, 张思维, 等. 2018中国肿瘤登记年报[M]. 北京: 人民卫生出版社, 2019. [He J, Wei WQ, Zhang SW, et al. Annual Report of Cancer Registration in China in 2018[M]. Beijing: People's Medical Publishing House, 2019.]
|
| [10] |
王悠清, 李辉章, 龚巍巍, 等. 2015年浙江省肿瘤登记地区恶性肿瘤发病与死亡分析[J]. 中国肿瘤, 2019, 28(1): 12-22. [Wang YQ, Li HZ, Gong WW, et al. Analysis of Cancer Incidence and Mortality in Zhejiang Cancer Registries, 2015[J]. Zhongguo Zhong Liu, 2019, 28(1): 12-22.] |
| [11] |
浙江省统计局, 国家统计局浙江调查总队. 2014浙江统计年鉴[M]. 北京: 中国统计出版社, 2014. [Zhejiang provincial statistics bureau,, National statistics bureau, Zhejiang survey team. 2014 Zhejiang Statistical Yearbook[M]. Beijing: China Statistics Press, 2014.]
|
| [12] |
Guo H, Li W, Wu J. Ambient PM2.5 and annual lung cancer incidence: a nationwide study in 295 Chinese counties[J]. Int J Environ Res Public Health, 2020, 17(5): E1481. DOI:10.3390/ijerph17051481 |
| [13] |
孙可欣, 郑荣寿, 曾红梅, 等. 2014年中国肺癌发病和死亡分析[J]. 中华肿瘤杂志, 2018, 40(11): 805-810. [Sun KX, Zheng RS, Zeng HM, et al. The incidence and mortality of lung cancer in China, 2014[J]. Zhonghua Zhong Liu Za Zhi, 2018, 40(11): 805-810.] |
| [14] |
蔡玥, 严宝湖, 周恭伟, 等. 2011-2015年中国肺癌直接经济负担及次均费用分析[J]. 中国卫生统计, 2018, 35(3): 334-337. [Cai Y, Yan BH, Zhou GW, et al. Analysis of direct economic burden and average hospitalization cost of lung cancer in China in 2011-2015[J]. Zhongguo Wei Sheng Tong Ji, 2018, 35(3): 334-337.] |
| [15] |
李雪琴, 陈中文, 金鎏, 等. 2010年至2014年浙江省肿瘤登记地区肺癌发病和死亡情况分析[J]. 中国肿瘤临床, 2018, 45(22): 1151-1154. [Li XQ, Chen ZW, Jing X, et al. Analysis of incidence and mortality of lung cancer in cancer registration area in Zhejiang province in 2010-2014[J]. Zhongguo Zhong Liu Lin Chuang, 2018, 45(22): 1151-1154.] |
| [16] |
Bai L, Shin S, Burnett RT, et al. Exposure to ambient air pollution and the incidence of lung cancer and breast cancer in the Ontario Population Health and Environment Cohort[J]. Int J cancer, 2020, 146(9): 2450-2459. DOI:10.1002/ijc.32575 |
| [17] |
Luo J, Hendryx M, Ducatman A. Association between six environmental chemicals and lung cancer incidence in the United States[J]. J Environ Public Health, 2011, 2011: 463701. |
| [18] |
顾吉林, 汤宏山, 刘淼, 等. 大连市大气污染物质量浓度与气溶胶光学厚度的相关性分析[J]. 地理科学, 2019, 39(3): 516-523. [Gu JL, Tang HS, Liu M, et al. Correlation analysis between the concentration of atmospheric pollutant and aerosol optical depth in Dalian city[J]. Di Li Ke Xue, 2019, 39(3): 516-523.] |
| [19] |
Jenwitheesuk K, Peansukwech U, Jenwitheesuk K, et al. Construction of polluted aerosol in accumulation that affects the incidence of lung cancer[J]. Heliyon, 2020, 6(2). |
| [20] |
Zhou Y, Li L, Hu L. Correlation analysis of PM10 and the incidence of lung cancer in Nanchang, China[J]. Int J Environ Res Public Health, 2017, 14(10): 1253. DOI:10.3390/ijerph14101253 |
| [21] |
巨英超, 刘亮, 贺宇彤, 等. 大气细颗粒物PM2.5致Wistar大鼠肺部病变的研究[J]. 肿瘤防治研究, 2017, 44(10): 652-658. [Ju YC, Liu L, He YT, et al. Pulmonary lesions of Wistar rats induced by atmospheric particulate PM2.5[J]. Zhong Liu Fang Zhi Yan Jiu, 2017, 44(10): 652-658.] |
| [22] |
Yoon HJ, Xu SH, Tourassi G. Predicting lung cancer incidence from air pollution exposures using shapelet-based time series analysis[J]. IEEE EMBS Int Conf Biomed Health Inform, 2016, 2016: 565-568. |
| [23] |
Raaschou-Nielsen O, Andersen ZJ, Beelen R, et al. Air pollution and lung cancer incidence in 17 European cohorts: prospective analyses from the European Study of Cohorts for Air Pollution Effects (ESCAPE)[J]. Lancet Oncol, 2013, 14(9): 813-822. DOI:10.1016/S1470-2045(13)70279-1 |
| [24] |
Guo YM, Zeng HM, Zheng RS, et al. The association between lung cancer incidence and ambient air pollution in China:a spatiotemporal analysis[J]. Environ Res, 2016, 144(Pt A): 60-65. |
| [25] |
李媛秋, 刘剑君, 么鸿雁. 肺癌发病和死亡流行情况与人类发展指数的关系分析[J]. 中国肿瘤, 2019, 28(9): 646-650. [Li YQ, Liu JJ, Yao HY. Relationship of lung cancer incidence and mortality with national levels of human development index[J]. Zhongguo Zhong Liu, 2019, 28(9): 646-650.] |
| [26] |
Guo H, Chang Z, Wu J, et al. Air polluion and lung cancer incidence in china: who are faced with a greater effect?[J]. Environ Int, 2019, 132: 105077. DOI:10.1016/j.envint.2019.105077 |