| 养殖氧化塘周边地下水氨氧化细菌分布及环境因子的影响 |
试验地点位于浙江省海盐县某养殖场地周边氧化塘(120°57′33″E, 30°35′36″N).经过前期场地水文地质勘查调查得知, 土壤类型为水稻土土属黄斑田土种;地下水埋深较浅, 实测水位深度为0.3~0.6 m, 年变化幅度0.5~1.5 m;由于地下水埋深较浅, 地下水温度易受气温影响, 随季节变化幅度较大;地下水pH范围为7.0~8.7, 水质呈弱碱性.
地下水样全部采自养殖场氧化塘(No.1和No.2)周边的26口监测井, 监测井分布见图 2.
 |
| 图2 试验地点监测井分布图 Fig. 2 Distribution of the sample points |
共有26口监测井, 全部为机械钻探孔, 其中孔深10 m的17口监测井为W1, W2, W3, W4, W5, W6, W7, W8, W12, W13, W17, W18, W22, W23, W24, W25, W26;孔深4 m的9口监测井为W9, W10, W11, W14, W15, W16, W19, W20, W21.
2014年9月, 采集养殖场氧化塘周边区域的26口监测井中对应位点的地下水样, 放于-4 ℃冰盒中, 带回实验室对水样进行水质分析, 并提取水样DNA.
1.2 水样项目测定与分析 1.2.1 基本理化性质参照《水和废水监测分析方法》第四版[8]
温度(T), 采用颠倒温度计法;
pH, 采用玻璃电极法测定;
总有机碳(total organic carbon,TOC), 采用燃烧氧化-非分散红外吸收法测定;
电导率(specific conductance, SPC), 采用实验室电导率仪法测定
1.2.2 无机氮测定方法根据地下水取样规范要求(HJ495—2009)取样后, 在实验室用双圈定性滤纸过滤水样, 如滤液仍浑浊则重复过滤至滤液澄清无悬浮物, 取适量滤液用连续流动分析仪(SAN++, SKALAR, The Netherlands)法测定[9], 分析过程所用试剂均为优级纯, 所用水均为超纯水.
1.2.3 水样AOB及总菌丰度测量方法 1.2.3.1 水样DNA提取水样DNA用FastDNA® SPIN kit for soil (MP Biomedicals LLC)试剂盒提取.提取方法参考该试剂盒给出的土壤样品提取方法, 具体如下:
①用注射器取水样10 mL, 用0.22 μm有机滤膜过滤, 取滤膜, 晾干后用剪刀尽可能剪碎, 称取5 g剪碎待测样品加入裂解管中, 加入978 μL磷酸钠缓冲溶液和122 μL MT缓冲溶液.
②用FastPrep核酸提取仪以6 m/s的速率裂解细胞40 s.
③裂解结束后, 将离心管置于高速冷冻离心机中, 4 ℃ 14 000 g离心15 min, 将上清液转移到2 mL离心管中.
④将离心管置于离心机, 4 ℃ 14 000 g冷冻离心10 min, 沉淀残渣.
⑤转移上清液至2-mL离心管, 加入250 μL聚苯硫醚(polyphenylene sulfide,PPS), 正反摇晃10次, 摇匀, 继续4 ℃ 14 000 g离心5 min, 再次沉淀.
⑥转移上清液至15-mL离心管中, 摇匀Binding Matrix并取1 mL加入15-mL离心管中, 涡旋振荡2 min, 使DNA与其充分结合, 静置3 min.
⑦小心移除500 μL上清液后混匀管中剩余物, 取600 μL到过滤柱收集管中, 14 000 g离心1 min, 将所收集滤液弃置, 再取600 μL离心管中混合物至过滤柱收集管中, 再次离心(重复操作至离心管中混合物全部转移为止).
⑧加入500 μL SEWS-M(提前用100 mL 100%乙醇稀释), 14 000 g离心1 min, 弃置滤液, 14 000 g再次离心2 min, 完全去除SEWS-M, 然后保留过滤柱, 换上新的收集管.
⑨室温下风干5 min.
⑩14 000 g离心1 min, 将DNA洗脱至干净收集管, 弃置过滤柱, -20 ℃保存.
1.2.3.2 荧光定量PCR提取DNA所用试剂盒为大连宝生物工程有限公司的SYBR® Premix Ex TaqTM kit, 提取纯化后-20 ℃保存.然后以amoA-1F, amoA-2R为引物(表 1), 扩增AOB的amoA基因.
| 表1 实时荧光定量所用引物和反应条件 Table 1 Primers and reaction conditions for real-time PCR |
 |
| 点击放大 |
根据XIE,等[10]的方法, 得到AOB amoA基因的重组质粒, 根据已知质粒和阿伏伽德罗常数(6.02×10²³分子数/mol)分别计算各自基因拷贝数.分别以10倍梯度稀释各重组质粒, 获得各自的标准曲线, 然后根据标准曲线计算出样品中的基因拷贝数, 每个样品3次重复.实时荧光定量PCR的反应体系为20 μL, 包含10 μL SYBR® Premix Ex TaqTM Mix, 前后引物各0.4 μL, 7.2 μL PCR-H2O和2 μL DNA模板.于CFX96 Real-Time PCR System扩增仪上进行定量分析.
1.3 数据分析应用软件SPSS16.0进行Pearson相关性分析, 评估了AOB丰度和相对丰度与不同环境因子间的相关关系.AOB丰度进行了以10为底的对数转换.
2 结果与分析对水样进行检测后发现部分水样检测指标明显异常.经过对现场监测井进行仔细检查,结果表明,部分监测井由于场地管道改建、自然天气灾害等原因已受到不同程度的损坏,造成井水来源复杂,不再是单纯地下水,所以在后续结果分析中不再对受损监测井水样进行分析.
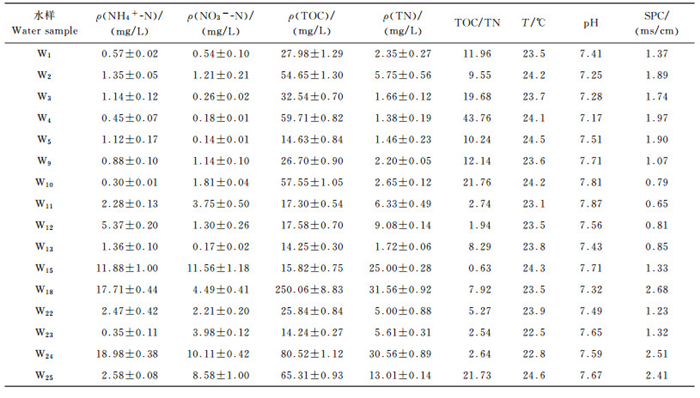
2.1 试验场地水样的基本理化性质场地的环境因子分布见表 2, 氨氮质量浓度范围在0.35~18.98 mg/L之间, 大部分样品的氨氮远高于地下水质量标准(GB/T 14848—93)中V类水所规定的0.50 mg/L;pH变化范围小, 呈弱碱性, 较适合AOB类微生物表现硝化活性[12];由总氮(total nitrogen,TN)和氨氮值可以看出来, 整个场地中, 氮污染物主要以氨氮的形式存在, 总氮与氨氮的分布规律相似;不同采样井的TOC/TN值相差较远, 范围从0.63~43.76, 最大可相差2个数量级;电导率较高的点分别为W18、W24和W25, 都达到了2 ms/cm以上;温度范围为22~25 ℃, 推断是由于江浙地区地下水埋深较浅, 地下水受地表影响大, 所以温度接近地表温度.
| 表2 地下水样理化性质 Table 2 Chemical properties of the groundwater samples |
 |
| 点击放大 |
氨氮质量浓度较高的采样井为W15、W18和W24;硝氮质量浓度较高的采样井为W15和W24;TOC和TN质量浓度较高的采样井均为W18和W24, 由图 2可知, 除采样井W15外, W18和W24都分布在No.2氧化塘边.分析其原因可能是由于No.2氧化塘的修建时间晚于No.1氧化塘近半年, 所以塘边界条件较No.1更不稳定, 所以有大量的污染物经由No.2氧化塘堤坝渗漏到地表和地下水, 导致周边地下水污染.
对所得到的全部环境因子数据进行主成分分析(PCA), 提取到2个主因子氨氮和硝氮, 贡献率分别是45.7%和25.1%(图 3), 主因子累积贡献率为70.8%, 由此认为这2个主成分可以表征地下水中主要环境因子.因此结合考虑2个主因子, 对采样点进行3个Cluster聚类分组.Cluster Ⅰ为W1, W2, W3, W4, W5;Cluster Ⅱ为W9, W10, W12, W13, W22, W23;Cluster Ⅲ为W18和W24.
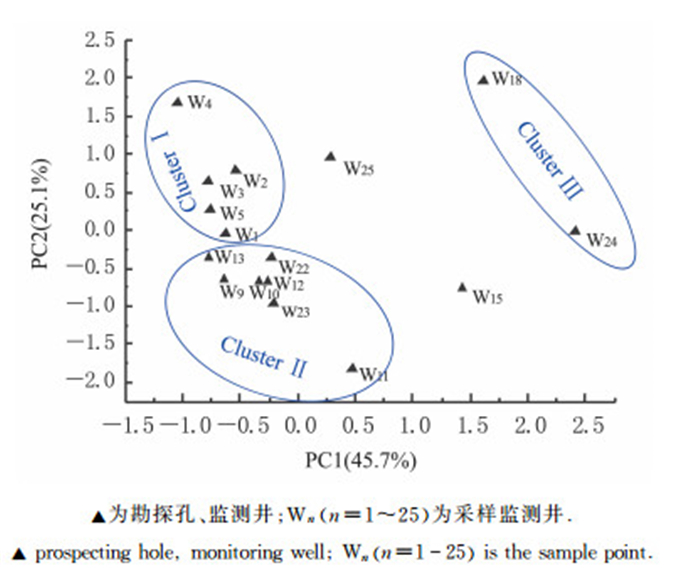 |
| 图3 环境因子分布PCA分析结果 Fig. 3 PCA result of environmental factors distribution |
对比监测井分布可得各分组的分布特点:ClusterⅠ分布于No.1氧化塘边;Cluster Ⅱ 分布于远离氧化塘的区域, Cluster Ⅲ 分布于No.2氧化塘边(图 4).整体氮素污染物质量浓度Cluster Ⅲ > Cluster Ⅱ > Cluster Ⅰ.
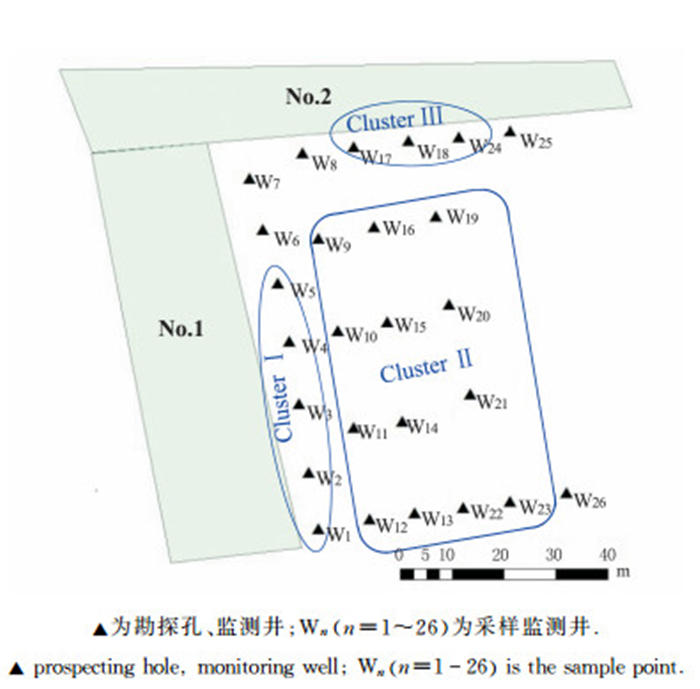 |
| 图4 试验地点监测井分组 Fig. 4 Sampling points grouping |
各采样井水样中的amoA功能基因拷贝数见图 5.结合环境因子分布来看, amoA功能基因拷贝数的数量分布类似于环境因子中碳氮污染的分布规律, 靠近No.2氧化塘的W18, W24和W25水样中AOB数量较多.同时, W11和W15水样的amoA基因拷贝数也较多, 查看了蔬菜大棚的施肥记录发现, 采样前14 d, 大棚内曾在W15的位置施肥1次, 肥料种类为复合型氮肥, 可能对周围区域地下水的氨氮含量及amoA基因数量影响较大.
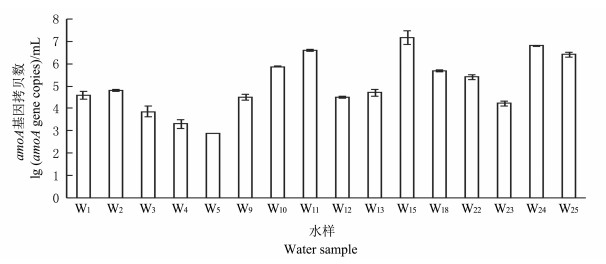 |
| 图5 各水样中的氨氧化细菌的丰度 Fig. 5 Abundance of AOB in different water samples |
利用Arc-GIS做出AOB amoA基因拷贝数分布图见图 6, 可得到与PCA主因子聚类分组相似, AOB amoA基因的分布也可以分为3个Clusters.Cluster Ⅲ区域基因拷贝数最高, 其次是Cluster Ⅱ区域, Cluster Ⅰ区域amoA基因拷贝数最少.
 |
| 图6 AOB amoA基因拷贝数位置分布 Fig. 6 Biogeography of AOB amoA gene copy numbers |
AOB的相对丰度即含amoA基因的细菌量与总菌量的比值, 总菌量及相对丰度见图 7和图 8.由图可以得到, 总菌量≥107的采样点基本集中在No.2氧化塘边和W15施肥点周围.同时, W11、W15、W24和W25的4个采样井中, AOB占据了主导地位, 大于等于总菌量的25%.
 |
| 图7 各水样中细菌的总量 Fig. 7 Total bacteria amount in different water samples |
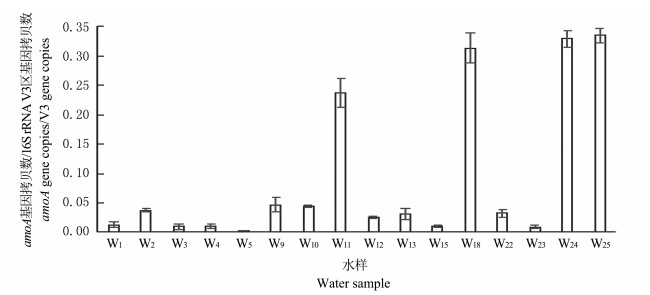 |
| 图8 各水样中氨氧化细菌/细菌总量的相对丰度 Fig. 8 Relative abundance of AOB/total amount of bacteria in different water samples |
AOB丰度及相对丰度和环境因子的相关关系见表 3.AOB丰度和相对丰度都和硝氮质量浓度呈极显著正相关(P < 0.01);AOB丰度与氨氮、总氮质量浓度及AOB相对丰度与氨氮质量浓度也均呈显著正相关(P < 0.05).说明AOB丰度以及相对丰度都受到水中氮污染物的影响, 氮污染物质量浓度越高, 则AOB的丰度及相对丰度更大;尤其是硝氮质量浓度和AOB相对丰度呈极显著正相关(P < 0.05).
| 表3 AOB丰度和相对丰度与环境因子的相关关系 Table 3 Correlations between AOB abundance, relative abundance and environmental factors |
 |
| 点击放大 |
氨氧化是地球生物循环的一个重要步骤[13], 在氨氧化过程中, amoA基因是核心基因.作为氨氧化的第一步, amoA基因的数量直接关系到硝化过程的速率,进而影响到整个氮循环过程的速率.
amoA基因受多种环境因子的影响[14].KOWCALCHUK,等[15]的研究表明pH是AOB的amoA基因的重要影响因素之一[15], AOB种群结构在不同pH环境下, 优势种群不同.pH显著上升时, amoA基因拷贝数会明显增加[16].刘彪,等[17]研究发现, 当pH为7.5~8.0时, AOB的amoA基因丰度较高, pH为8.0时, amoA基因丰度最高.在本研究中, 所有水样pH在7.0~8.0范围内, pH > 7.8的水样W10、W11的amoA基因丰度显著大于pH < 7.3的水样W2、W3和W4.AOB绝对丰度与pH间相关系数为0.439(P > 0.05), 因此不存在显著的相关性.
氨氧化细菌丰度和相对丰度与氮污染物质量浓度呈显著正相关, 氮污染物质量浓度越高, AOB绝对丰度越大.SAUDER,等[18]的研究也表明, 当氨氮质量浓度大于0.1 mg/L时, AOB在氨氧化微生物中占据主导地位, 并且AOB的生物量和氨氮质量浓度呈显著正相关.而陈国元,等[19]对西湖沉积物间隙水的研究发现, AOB丰度与氨氮质量浓度呈显著相关性, 这与本研究的结果一致.WHITBY,等[20]对淡水湖的研究发现, AOB丰度与氨氮质量浓度无显著性差异.因此推测在不同环境中, 环境因子对AOB影响方式不同.JIA,等[21]和DI,等[22]通过对土壤环境研究发现, AOB是富氨氮土壤环境中氨氧化过程的主导者.推测在富氨氮水环境中, AOB也是氨氧化过程的主导者.大量研究表明, AOB适合在高氮的环境下生长, 而AOA适合在氮源相对贫乏的环境中生长[10].
环境因子的PCA聚类分组结果表明, 环境因子按照主成分1氨氮质量浓度和主成分2硝氮质量浓度结合考虑, 可以分为3个区域, 分别是靠近No.1氧化塘边的Cluster Ⅰ、靠近No.2氧化塘边的Cluster Ⅲ和远离氧化塘的区域Cluster Ⅱ, 而且AOB amoA基因拷贝数的分布也可以划分为与其位置基本吻合的3个区域, 同时氮素污染物呈现:Cluster Ⅲ>Cluster Ⅱ>Cluster Ⅰ, AOB中amoA基因拷贝数:Cluster Ⅲ>Cluster Ⅱ>Cluster Ⅰ.因此推测地下水和氧化塘之间的位置关系会影响地下水的环境因子和AOB数量, 靠近No.2氧化塘边的地下水污染质量浓度最高,AOB数量最多;靠近No.1氧化塘边的地下水污染质量浓度最低,AOB数量最少.
TOC与TOC/TN和AOB丰度无任何相关性, 说明在此场地内, TOC和TOC/TN不是氨氧化细菌繁殖的限制性因素, 这可能是由于场地内有足够的碳源供氨氧化细菌吸收利用.
4 结论 4.1虽然pH值和AOB绝对丰度无相关性, 但是pH值会影响AOB绝对丰度的大小:当pH > 7.8时, AOB绝对丰度较大;但当pH < 7.3时, AOB绝对丰度显著减小.
4.2AOB绝对丰度和相对丰度与氮污染物呈显著正相关, 尤其是硝氮质量浓度, 呈极显著正相关(P < 0.01).
| [1] | JIAN M W, KAI W, XUE L C, et al. Evaluation on feed factors affecting the dung pollutants of livestock and poultry. Animal Husbandry and Feed Science, 2009, 1(8/10): 14-16, 19. |
| [2] | LEE S. Geochemistry and partitioning of trace metals in paddy soils affected by metal mine tailings in Korea. GEODERMA, 2006, 135: 26-37. DOI:10.1016/j.geoderma.2005.11.004 |
| [3] | RODRÍGUEZ L, RUIZ E, ALONSO-AZCÁRATE J, et al. Heavy metal distribution and chemical speciation in tailings and soils around a Pb-Zn mine in Spain. Journal of Environmental Management, 2009, 90(2): 1106-1116. DOI:10.1016/j.jenvman.2008.04.007 |
| [4] |
李政红, 张翠云, 张胜, 等. 地下水微生物学研究进展综述. 南水北调与水利科技, 2007, 5(5): 60-63. LI Z H, ZHANG C Y, ZHANG S, et al. Groundwater microbiology research progress summary. South to North Water Transfers and Water Science & Technology, 2007, 5(5): 60-63. (in Chinese with English abstract) |
| [5] | KÖNNEKE M, BERNHARD A E, JOSÉ R, et al. Isolation of an autotrophic ammonia-oxidizing marine archaeon. Nature, 2005, 437(7058): 543-546. DOI:10.1038/nature03911 |
| [6] | PROSSER J I, NICOL G W. Relative contributions of archaea and bacteria to aerobic ammonia oxidation in the environment. Environmental Microbiology, 2008, 10(11): 2931-2941. DOI:10.1111/emi.2008.10.issue-11 |
| [7] | CANFIELD D E, GLAZER A N, FALKOWSKI P G. The evolution and future of Earth's nitrogen cycle. Science, 2010, 330(6001): 192-196. DOI:10.1126/science.1186120 |
| [8] |
国家环境保护总局水和废水监测分析方法编委会.水和废水监测分析方法:第四版.北京:中国环境科学出版社, 2002:236-261. State Environmental Protection Administration, Water and Waste Water Monitoring Analysis Method: 4th ed. Beijing: China Environmental Science Press, 2002:236-261. (in Chinese) |
| [9] | ZHOU J B, CHEN Z J, LIU X J, et al. Nitrate accumulation in soil profiles under seasonally open 'sunlight greenhouses' in northwest China and potential for leaching loss during summer fallow. Soil Use and Management, 2010, 26(3): 332-339. DOI:10.1111/j.1475-2743.2010.00284.x |
| [10] | XIE Z, LE ROUX X, WANG C, et al. Identifying response groups of soil nitrifiers and denitrifiers to grazing and associated soil environmental drivers in Tibetan alpine meadows. Soil Biology and Biochemistry, 2014, 77: 89-99. DOI:10.1016/j.soilbio.2014.06.024 |
| [11] | ROTTHAUWE J, WITZEL K, LIESACK W. The ammonia monooxygenase structural gene amoA as a functional marker: molecular fine-scale analysis of natural ammonia-oxidizing populations. Applied and Environmental Microbiology, 1997, 63(12): 4704-4712. |
| [12] |
陆诗敏.淡水养殖池塘环境中氨氧化微生物的研究.武汉:华中农业大学, 2014:54-69. LU S M. Study on the ammonia-oxidizing microorganisms in the freshwater aquaculture pond environment in China. Wuhan: Huazhong Agricultural University, 2014:54-69. (in Chinese with English abstract) |
| [13] | KOOPS H P, PURKHOLD U, POMMERENING-RÖSER A, et al. The Prokaryotes: An Evolving Electronic Resource for the Microbiological Community. New York: Springer-Verlag, 2003. |
| [14] | HE J, SHEN J, ZHANG L, et al. Quantitative analyses of the abundance and composition of ammonia-oxidizing bacteria and ammonia-oxidizing archaea of a Chinese upland red soil under long-term fertilization practices. Environmental Microbiology, 2007, 9(9): 2364-2374. DOI:10.1111/emi.2007.9.issue-9 |
| [15] | KOWALCHUK G A, STEPHEN J R, DE BOER W, et al. Analysis of ammonia-oxidizing bacteria of the beta subdivision of the class Proteobacteria in coastal sand dunes by denaturing gradient gel electrophoresis and sequencing of PCR-amplified 16S ribosomal DNA fragments. Applied and Environmental Microbiology, 1997, 63(4): 1489-1497. |
| [16] | MENDUM T A, HIRSCH P R. Changes in the population structure of β-group autotrophic ammonia oxidizing bacteria in arable soils in response to agricultural practice. Soil Biology and Biochemistry, 2002, 34(10): 1479-1485. DOI:10.1016/S0038-0717(02)00092-5 |
| [17] |
刘彪.仿生植物附着氨氧化微生物群落结构及其对环境因子的响应研究.苏州, 江苏:江苏大学, 2014:54-100. LIU B. Research on community structure of ammonia-oxidizing microorganisms in the biofilm attached bionic plants and its responses to environmental factor. Suzhou, Jiangsu: Jiangsu University, 2014:54-100. (in Chinese with English abstract) |
| [18] | SAUDER L A, ENGEL K, STEARNS J C, et al. Aquarium nitrification revisited: Thaumarchaeota are the dominant ammonia oxidizers in freshwater aquarium biofilters. PLoS ONE, 2011, 6(8): e23281. DOI:10.1371/journal.pone.0023281 |
| [19] |
陈国元, 黄晓鸣. 泉州西湖沉积物中硝化细菌的分布及其作用. 微生物学通报, 2011, 38(11): 1632-1638. CHEN G Y, HUANG X M. Distribution and role of nitrifying bacteria in the sediments of Xihu Lake in Quanzhou. Microbiology, 2011, 38(11): 1632-1638. (in Chinese with English abstract) |
| [20] | WHITBY C B, SAUNDERS J R, PICKUP R W, et al. A comparison of ammonia-oxidizer populations in eutrophic and oligotrophic basins of a large freshwater lake. Antonie van Leeuwenhoek, 2001, 79(2): 179-188. DOI:10.1023/A:1010202211368 |
| [21] | JIA Z, CONRAD R. Bacteria rather than archaea dominate microbial ammonia oxidation in an agricultural soil. Environmental Microbiology, 2009, 11(7): 1658-1671. DOI:10.1111/emi.2009.11.issue-7 |
| [22] | DI H J, CAMERON K C, SHEN J P, et al. Nitrification driven by bacteria and not archaea in nitrogen-rich grassland soils. Nature Geoscience, 2009, 2(9): 621-624. DOI:10.1038/ngeo613 |
 2016, Vol. 42


