文章信息
- 张家红, 夏楠, 王金行, 宋鉴清
- ZHNAG Jiahong, XIA Nan, WANG Jinhang, SONG Jianqing
- 3种狼疮抗凝物检测方法的临床应用价值评价
- Evaluation of the clinical application value of three lupus anticoagulant detection methods
- 中国医科大学学报, 2021, 50(2): 97-101
- Journal of China Medical University, 2021, 50(2): 97-101
-
文章历史
- 收稿日期:2020-07-03
- 网络出版时间:2021-01-13 16:12
狼疮抗凝物(lupus anticoagulant,LA)是一组能与带负电荷的磷脂或磷脂蛋白复合物结合的免疫球蛋白,在体外能延长磷脂依赖的凝血试验时间[1]。目前检测LA常用的方法为活化部分凝血活酶时间(activated partial thromboplastin time,APTT)、改良的稀释蝰蛇毒时间(dilute Russell viper venom time,DRVVT)及二氧化硅凝固时间(silica clotting time,SCT)检测法,通常以筛选试验、混合试验和确认试验传统的三步法来判读是否存在LA。本研究拟通过APTT即刻纠正试验(APTT法)、SCT法及DRVVT法的筛选和确认试验检测血浆中的LA,旨在评估3种方法的临床应用价值。
1 材料与方法 1.1 材料 1.1.1 一般资料根据实验室信息系统(laboratory information system,LIS)及电子病历,回顾分析2019年2月至2020年1月于我院就诊的通过SCT法、DRVVT法及APTT法检测LA的1 240例样本,排除凝血因子缺乏、含因子抗体、凝血酶时间异常、应用抗凝药物及红细胞压积非正常者。筛选出通过SCT法及DRVVT法检测LA阳性332例(A组),同时应用DRVVT法、SCT法及APTT法检测LA135例(B组),同时应用3种方法检测且LA持续阳性(至少间隔12周检测LA阳性≥2次)87例(C组)。其中,抗磷脂综合征(antiphospholipid syndrome,APS)38例,非APS 49例。
1.1.2 仪器与试剂法国思塔高公司STA-R-Evolution仪器及相关配套试剂用于APTT检测;美国实验仪器公司TOP-750及相关配套试剂用于SCT和DRVVT检测。
1.1.3 标本制备采取静脉血2.7 mL,置于含有0.3 mL枸橼酸钠(0.109 mol/L)的负压试管中,充分混匀。2 000~2 500 g、10 min离心2次,获得乏血小板血浆(血小板计数 < 10×109/L),用于LA检测,离心1次乏血小板血浆用于APTT检测。
1.2 方法 1.2.1 APTT即刻纠正试验分别即刻检测患者血浆(a)、正常血浆(b)、患者血浆和正常血浆1︰1相同体积混合后血浆(c)的APTT。计算罗斯纳指数(Rosner index,RI)值= [(APTTc-APTTb)/APTTa]×100%。RI≥11.0%为未纠正,即血浆含有抑制物;RI < 11.0%为纠正,即血浆凝血因子缺乏。
1.2.2 LA检测用SCT和DRVVT 2种方法进行筛选和确认检测,检测结果以标准化比值(normalized ratio,NR)表示。SCT NR和DRVVT NR < 1.2为LA阴性,SCT和DRVVT任一种方法的NR≥1.2即为LA阳性。
1.2.3 临床诊断动、静脉血栓由计算机断层扫描、多普勒超声、肺灌注显像、血管造影或磁共振成像确定。病态妊娠根据2006年悉尼修订的Sapporo标准确定[2]。
1.3 统计学分析采用SPSS 22.0及GraphPad Prism 7.0软件进行统计学分析及作图。非正态分布的计量资料采用非参数检验进行比较,以M(P25~P75)表示,计数资料采用χ2检验进行比较。应用受试者工作特征(receiver operating characteristic,ROC)曲线统计参数的诊断效能。P < 0.05为差异有统计学意义。
2 结果 2.1 A组SCT法和DRVVT法检测LA阳性率和符合率比较SCT法和DRVVT法阳性率(74.4%和78.3%)间无统计学差异(P > 0.05),2种方法在NR分别 > 1.2、1.5和2.0时的符合率(52.7%、48.3%和45.9%)亦无统计学差异(P > 0.05),见表 1。
| Item | NR > 1.2 | NR > 1.5 | NR > 2.0 |
| SCT+/DRVVT+ | 175 | 83 | 34 |
| Only SCT+ | 72 | 65 | 37 |
| Only DRVVT+ | 85 | 24 | 3 |
| Total | 332 | 172 | 74 |
| Coincidence rate(%) | 52.7 | 48.3 | 45.9 |
2.2 B组各亚组RI的比较及对LA阳性的诊断分析 2.2.1 SCT NR、DRVVT NR和RI的相关性
B组的135例样本SCT NR、DRVVT NR和RI均为非正态分布,Spearman相关分析结果显示,SCT NR与DRVVT NR、RI的相关系数分别为0.732、0.509(P < 0.01)。DRVVT NR和RI相关系数为0.516(P < 0.01)。
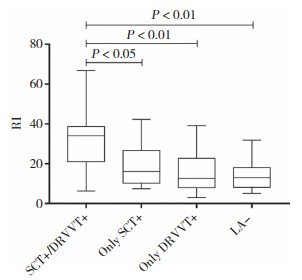
2.2.2 B组各亚组的RI值比较将B组分为SCT阳性/DRVVT阳性组(66例)、仅SCT阳性组(14例)、仅DRVVT阳性组(19例)、LA阴性组(36例)4个亚组。各组RI值的中位数分别为34.05(21.05~38.72),16.05(9.38~26.65),12.65(7.95~22.73),12.95(8.20~18.13)。如图 1所示,SCT阳性/DRVVT阳性组与仅SCT阳性组、仅DRVVT阳性组、LA阴性组RI值均有统计学差异(P < 0.05,P < 0.01,P < 0.01),而后三者之间无统计学差异。

|
| 图 1 B组不同亚组RI比较 Fig.1 Comparison of RI in different subgroups of group B |
2.2.3 RI在不同NR诊断LA阳性的ROC曲线分析
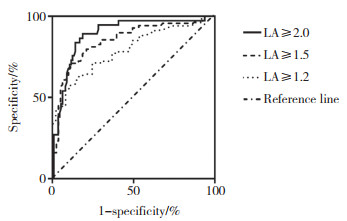
RI对应不同的NR诊断LA阳性的效能也不相同,当NR≥2.0时,RI诊断LA阳性效能最高。见图 2、表 2。

|
| 图 2 不同NR值时RI诊断LA阳性的ROC曲线 Fig.2 ROC curve of RI for diagnosing LA positive with different NR values |
| NR | Cut-off | AUC | Sensitivity(%) | Specificity(%) | P |
| ≥1.2 | 22.2 | 0.792 | 57.4 | 89.1 | < 0.001 |
| ≥1.5 | 23.9 | 0.851 | 71.0 | 88.9 | < 0.001 |
| ≥2.0 | 26.5 | 0.891 | 89.2 | 81.4 | < 0.001 |
2.3 3种检测方法诊断APS的ROC曲线分析
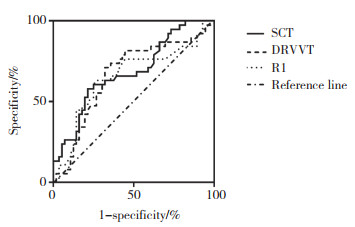
C组87例样本均为LA持续阳性,其中,38例诊断为APS,其他49例诊断为非APS。38例APS患者中,男8例,女30例,中位年龄33(11~76)岁。见表 3、图 3。
| Method | Cut-off | AUC | Sensitivity(%) | Specificity(%) | P |
| SCT | 2.26 | 0.683 | 57.9 | 78.6 | 0.003 |
| DRVVT | 1.66 | 0.653 | 63.2 | 73.2 | 0.012 |
| APTT | 28.2 | 0.664 | 71.1 | 67.9 | 0.007 |

|
| 图 3 3种方法诊断APS的ROC曲线 Fig.3 ROC curve of three methods for diagnosing APS |
3 讨论
抗磷脂抗体(antiphospholipid antibody,APL)与血栓形成、病态妊娠、产科并发症和皮肤表现有关[3]。当临床表现有血栓形成或病态妊娠且试验室检查有持续性APL存在时,可诊断为APS [2]。LA在APS的诊断和治疗中起着非常重要的作用,在APL谱中,相较于抗心磷脂抗体(anticardiolipin antibody,ACL)和抗β2糖蛋白(β2 glycoprotein,β2GP)-Ⅰ抗体,LA与临床事件的相关性最佳,因此,LA检测越来越受到临床重视。但LA的异质性以及不同的检测试剂和仪器等差异问题导致很难建立金标准。目前,还没有单一的检测系统能检测到所有的LA[4]。为了增加检测LA的敏感性,3个国际指南[5-7]都建议采取2种不同途径的试验方法,APTT和DRVVT是国际上最常使用的2种检测方法[8],文献指出SCT也可作为LA检测的备选方法。本实验室常规检测LA采用SCT法和DRVVT法,APTT纠正试验只是用于区分内源途径及共同途径因子缺乏和抑制物。
本研究中,SCT法和DRVVT法检测LA的阳性率虽无显著差异,但二者联合检测可提高LA的阳性率,且随着NR逐渐升高,SCT法和DRVVT法的阳性符合率逐渐降低。AVERINA等[9]在1项关于评估SCT法在具有各种APS症状的临床人群诊断准确性的研究中,用SCT法和DRVVT法在123个健康供体中计算参考临界值,将高于第99百分位的值定义为阳性临界值,第97.5百分位的95%CI的下限定义为边界临界值,采用2种方法阳性临界值的符合率低于采用边界临界值时的符合率。本研究结果与既往文献一致。
APTT即刻纠正试验通常用于区分凝血因子缺乏和抑制物。本研究B组样本中,SCT阳性/DRVVT阳性组的RI明显高于其他组,说明APTT法的RI对LA的诊断是有价值的,与文献[10]报道一致,但该文献也指出,很难将低活性的LA阳性样本从阴性样本中分离出来。本研究发现,仅SCT阳性组、仅DRVVT阳性组与LA阴性组的RI值无显著差异,也验证了这一观点。因此,由于稀释效应,混合试验阴性不能排除弱阳性LA[6]。LA阴性组RI中位数是12.95,大于本研究采用的临界值11.0[11],可以解释为APL谱中除了LA,还包括抗β2GP-Ⅰ抗体和ACL等其他APL,虽然它们所占比例较低。因此,血浆中不含LA而含有抗β2GP-Ⅰ抗体或ACL也可能导致APTT即刻纠正试验阳性。没有单一的混合试验解释可以100%敏感或特异地区分因子缺乏或抑制物[11-12]。由于SCT法和DRVVT法的存在,如果单纯从检测LA的角度看,APTT即刻纠正试验似乎是可有可无的。CLSI 2014更进一步优化并重新排列了筛查、确认和混合试验的顺序,混合试验仅在初始试验不明确的情况下才进行,因可能导致假阴性报告,在没有证据表明凝血时间延长的其他原因的样本中,应省略混合试验。但有研究[13]认为,尽管较为罕见,但LA的辅助因子效应在没有混合试验的情况下不能得到验证,且仅靠综合试验不能检测到这种现象。关于混合试验在LA分析中还存在更多争议[14],而在没有能力使用SCT和DRVVT等方法检测LA的实验室,APTT即刻纠正试验仍是一种比较有效的检测手段,且成本低廉。
3个国际指南并未明确判断LA强弱的标准,FAVALORO等[8]报道,以NR 1.2~ < 1.5为弱阳性,1.5~ < 2.0为中等阳性,≥2.0为强阳性。在本研究中,当NR分别≥1.2、1.5、2.0时,RI诊断LA阳性的最佳临界值分别为22.2、23.9、26.5,这与KUMANO等[10]认定的LA阳性组的RI中位值为24.0相似。RI诊断LA阳性的ROC-AUC随RI临界值的增高而增高,与RATZINGER等[15]的研究结果,即对LA敏感的APTT试剂的混合试验RI诊断LA阳性ROC-AUC为0.83相似,但该研究未将NR分层比较。
1项队列研究[16]发现,高水平的LA与APS的临床事件相关,该研究用SCT法和DRVVT法对APS进行了诊断,NR临界值分别为1.91和1.61,有较好的特异性,后者更敏感。目前未见用APTT即刻纠正试验的RI诊断APS的报道。本研究显示,3种方法中,APTT法诊断APS的敏感度最高。尽管指南将DRVVT法描述为更特异地检测LA而特别强调其使用,但有文献[6, 17]显示,APTT法比DRVVT法具有更好的性能、更少的假阴性和假阳性结果。
综上所述,本研究通过APTT即刻纠正试验、SCT法及DRVVT法的筛选和确认试验检测了血浆中的LA,旨在评估3种方法的临床应用价值。由于LA的异质性、方法的局限性,使其检测具有挑战性,因此,要充分了解LA检测的仪器、方法、试剂性能及APS本质,为临床诊断APS提供有力证据。作为1项回顾性研究,本研究的样本量较小,信息采集可能还存在缺陷,可能存在回顾性信息偏倚,今后需要扩大样本量进一步证实本研究结果。
| [1] |
中华医学会风湿病学分会. 系统性红斑狼疮诊断及治疗指南中华医学会风湿病学分会[J]. 中华风湿病学杂志, 2010, 14(5): 342-346. DOI:10.3760/cma.j.issn.1007-7480.2010.05.016 |
| [2] |
MIYAKIS S, LOCKSHIN MD, ATSUMI T, et al. International consensus statement on an update of the classification criteria for definite antiphospholipid syndrome (APS)[J]. J Thromb Haemost, 2006, 4(2): 295-306. DOI:10.1111/j.1538-7836.2006.01753.x |
| [3] |
MERONI PL, BORGHI MO, RASCHI E, et al. Pathogenesis of antiphospholipid syndrome:understanding the antibodies[J]. Nat Rev Rheumatol, 2011, 7(6): 330-339. DOI:10.1038/nrrheum.2011.52 |
| [4] |
KUMANO O, MOORE GW. Ruling out lupus anticoagulants with mixing test-specific cutoff assessment and the index of circulating anticoagulant[J]. Res Pract Thromb Haemost, 2019, 3(4): 695-703. DOI:10.1002/rth2.12245 |
| [5] |
PENGO V, TRIPODI A, REBER G, et al. Update of the guidelines for lupus anticoagulant detection. Subcommittee on Lupus Anticoagulant/Antiphospholipid Antibody of the Scientific and Standardisation Committee of the International Society on Thrombosis and Haemostasis[J]. J Thromb Haemost, 2009, 7(10): 1737-1740. DOI:10.1111/j.1538-7836.2009.03555.x |
| [6] |
KEELING D, MACKIE I, MOORE GW, et al. Guidelines on the investigation and management of antiphospholipid syndrome[J]. Br J Haematol, 2012, 157(1): 47-58. DOI:10.1111/j.1365-2141.2012.09037.x |
| [7] |
MOORE GW. Commonalities and contrasts in recent guidelines for lupus anticoagulant detection[J]. Int J Lab Hem, 2014, 36(3): 364-373. DOI:10.1111/ijlh.12227 |
| [8] |
FAVALORO E, BONAR R, MARSDEN K. Internal quality control and external quality assurance in testing for antiphospholipid antibodies:part Ⅱ:lupus anticoagulant[J]. Semin Thromb Hemost, 2012, 38(4): 404-411. DOI:10.1055/s-0032-1311993 |
| [9] |
AVERINA M, JOHANNESEN S, BROX J. Diagnostic accuracy of silica clotting time method for lupus anticoagulant in a clinical population with various symptoms of antiphospholipid syndrome[J]. Lupus, 2016, 25(4): 418-422. DOI:10.1177/0961203315617540 |
| [10] |
KUMANO O, IEKO M, NAITO S, et al. Verification of the guidelines for lupus anticoagulant detection:usefulness of index for circulating anticoagulant in APTT mixing test[J]. Thromb Res, 2014, 134(2): 503-509. DOI:10.1016/j.thromres.2014.05.030 |
| [11] |
KERSHAW G, ORELLANA D. Mixing tests:diagnostic aides in the investigation of prolonged prothrombin times and activated partial thromboplastin times[J]. Semin Thromb Hemost, 2013, 39(3): 283-290. DOI:10.1055/s-0033-1336832 |
| [12] |
FAVALORO EJ. Coagulation mixing studies:utility, algorithmic strategies and limitations for lupus anticoagulant testing or follow up of abnormal coagulation tests[J]. Am J Hematol, 2020, 95(1): 117-128. DOI:10.1002/ajh.25669 |
| [13] |
TRIPODI A. To mix or not to mix in lupus anticoagulant testing? that is the question[J]. Semin Thromb Hemost, 2012, 38(4): 385-389. DOI:10.1055/s-0032-1304717 |
| [14] |
DEVREESE KM. Interpretation of normal plasma mixing studies in the laboratory diagnosis of lupus anticoagulants[J]. Thromb Res, 2007, 119(3): 369-376. DOI:10.1016/j.thromres.2006.03.012 |
| [15] |
RATZINGER F, PANIC T, HASLACHER H, et al. Testing lupus anticoagulants in a real-life scenario-a retrospective cohort study[J]. Biochem Med, 2017, 27(3): 1-13. DOI:10.11613/bm.2017.030705 |
| [16] |
TANG N, SUN ZY, YIN SY. Characteristics of Chinese patients with antiphospholipid syndrome and the ability of lupus anticoagulant assays to identify them[J]. Clin Chem Lab Med, 2016, 54(11): 1787-1791. DOI:10.1515/cclm-2016-0129 |
| [17] |
DEPRETER B, DEVREESE KMJ. Differences in lupus anticoagulant final conclusion through clotting time or Rosner index for mixing test interpretation[J]. Clin Chem Lab Med, 2016, 54(9): 1511-1516. DOI:10.1515/cclm-2015-0978 |
 2021, Vol. 50


