扩展功能
文章信息
- 李广帅, 庞松涛, 雷晓岗, 薛威, 陈保忠
- LI Guang-shuai, PANG Song-tao, LEI Xiao-gang, XUE Wei, CHEN Bao-zhong
- 西安市2015-2018年鼠类监测结果分析
- An analysis of the rodent surveillance results in Xi'an, China, 2015-2018
- 中国媒介生物学及控制杂志, 2020, 31(3): 373-375
- Chin J Vector Biol & Control, 2020, 31(3): 373-375
- 10.11853/j.issn.1003.8280.2020.03.027
-
文章历史
- 收稿日期: 2019-12-24
鼠类作为一种与人类生活关系密切的哺乳动物, 种类和数量多, 繁殖能力强, 可通过直接或间接方式传播病毒、细菌和寄生虫等多种病原体, 造成多种传染病的流行, 严重影响人类生命健康。为掌握西安市鼠类种群构成、鼠密度及季节消长趋势, 为全市制定防鼠灭鼠措施提供科学依据, 2015-2018年我们按照《全国病媒生物监测实施方案》对西安市鼠密度进行了监测。
1 材料与方法 1.1 监测点选择结合地理方位, 按东、南、西、北4个方位各选择1个区(县), 每个区(县)选择5个监测点, 包括城镇居民小区2个, 农村居民区1个, 食品餐饮行业2个。
1.2 监测方法按照《全国病媒生物监测实施方案》[1]规定, 采用夹夜法监测, 选用中型钢板夹, 规格120 mm×65 mm, 以生花生米为诱饵, 晚放晨收, 单月中旬进行监测, 每个生境布放鼠夹200夹。室内按每15 m2布放1夹, 室外5~10 m布放1夹。城镇居民区以外环境为主, 农村居民区不包含田地, 食品餐饮行业以室内为主, 兼顾各种房间。记录布夹数、有效夹数及捕获鼠数, 以鉴定鼠种, 计算鼠密度。

|
监测数据录入Excel 2007软件, 使用SPSS 13.0软件分析, 采用χ2检验对4年间鼠类种群构成和不同生境鼠类种群构成进行比较, P < 0.05为差异有统计学意义。
2 结果 2.1 鼠密度及鼠种构成2015-2018年共布放有效鼠夹93 496夹次, 捕获鼠类397只, 平均鼠密度为0.42%。鼠类种群构成分布, 捕获小家鼠(Mus musculus)210只, 占比为52.90%, 为优势鼠种。各年监测结果显示, 小家鼠均为优势鼠种, 2017-2018年黑线姬鼠(Apodemus agrarius)构成比有所增加(表 1)。经χ2检验, 4年间鼠种构成差异有统计学意义(χ2=19.196, P=0.024)。
城镇居民区、农村居民区和食品餐饮行业捕获鼠分别为116、98和183只, 鼠密度分别为0.24%、1.08%和0.50%, 各生境优势鼠种均为小家鼠, 占比分别为67.24%、40.82%和50.27%, 其次为褐家鼠。农村自然村黑线姬鼠密度高于黄胸鼠(Rattus tanezumi)。不同生境鼠种构成差异有统计学意义(χ2=60.875, P < 0.001)。
2.3 鼠密度季节消长鼠类活动呈双峰曲线, 但波动趋势不大。1月有1个高峰, 为0.47%, 随后平缓下降后升高, 7月是另1个高峰期, 为0.48%, 之后迅速下降, 11月最低, 为0.34%。
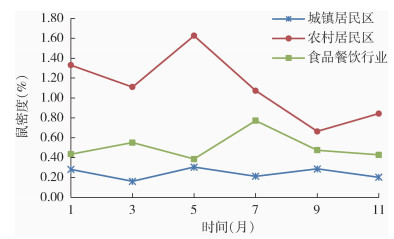
2.3.1 不同生境鼠密度季节消长城镇居民区鼠密度季节消长变化不大, 趋势平稳, 无明显高峰期; 农村居民区鼠密度季节消长波动幅度较大, 呈现双峰趋势, 1、5月是鼠活动高峰期, 9月鼠密度最低; 食品餐饮行业鼠密度季节消长呈现单峰趋势, 7月鼠密度较高, 见图 1。

|
| 图 1 2015-2018年西安市不同生境鼠密度季节消长趋势 Figure 1 The seasonal variation of rodent density in different habitats in Xi′an, 2015-2018 |
| |
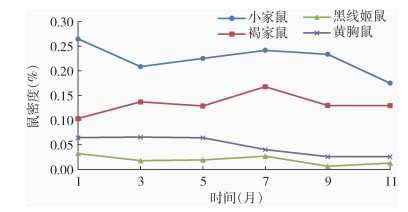
2015-2018年西安市不同鼠种鼠密度季节消长趋势不同。小家鼠密度季节消长呈现双峰趋势, 1月是大高峰, 7月为小高峰; 褐家鼠密度为单峰趋势, 7月为高峰期; 黑线姬鼠和黄胸鼠密度波动幅度小, 并呈现缓慢下降趋势, 见图 2。

|
| 图 2 2015-2018年西安市不同鼠种季节消长趋势 Figure 2 The seasonal variation of different rodent species in Xi′an, 2015-2018 |
| |
西安市地处关中平原中部, 北濒渭河, 南依秦岭, 是西北地区交通枢纽和最大城市。西安市一直以来是肾综合征出血热(HFRS)疫区, 历史发病处于全国前列, 鼠密度和发病趋势呈现密切关系[2-3], 科学监测鼠情, 掌握其季节消长趋势, 进而制定科学有效的防鼠、灭鼠措施, 对HFRS等相关传染病的预防控制具有重要意义[4-5]。
2015-2018年监测结果显示, 西安市鼠密度低于绵阳、滁州等市[6-7], 但是与全国平均水平相比依然较高[8], 且高于西安市2012-2013年的监测结果[9], 尤其是2017-2018年鼠密度有明显上升趋势, 所以, 防鼠、灭鼠工作力度还需加大。监测发现, 农村居民区鼠密度远高于城区居民区和食品餐饮行业, 农民一直以来是HFRS的高发人群[10-11], 所以开展防鼠、灭鼠工作时应当重点关注农村居民区。
2015-2018年西安市鼠密度季节消长呈现不明显的双峰趋势, 与其他省市监测结果基本一致[5-6], 但是不同的是高峰月份略有不同。分析原因可能与当地温度、雨水等气候因素有关。西安市的不同年份、不同生境的优势鼠种均为小家鼠, 与辽宁省、山东省潍坊市不同[12-13]。不同年份间和不同生境之间鼠种有明显差异, 与长沙市的监测结果基本一致[14], 同时, 不同季节和生境, 各鼠种密度变化也不一致。因此在进行防鼠、灭鼠时要根据监测结果, 综合考虑各种因素, 因时、因地采取有针对性的措施, 才能取得事半功倍的效果。
| [1] |
中国疾病预防控制中心.全国病媒生物监测实施方案[Z].北京: 中国疾病预防控制中心, 2016. Chinese Center for Disease Control and Prevention. National vector surveillance implementation plan[Z]. Beijing: Chinese Center for Disease Control and Prevention, 2016. |
| [2] |
张昌浩, 徐庆文, 刘景荣, 等. 逐步回归分析法预测周宁县肾综合征出血热疫情[J]. 海峡预防医学杂志, 2011, 17(6): 77-78. Zhang CH, Xu QW, Liu JR, et al. Prediction of hemorrhagic fever with renal syndrome in Zhouning county by stepwise regression analysis[J]. Strait J Prev Med, 2011, 17(6): 77-78. |
| [3] |
常玥, 李江麟, 王连华, 等. 2009-2015年浙江省台州市肾综合征出血热监测研究[J]. 疾病监测, 2017, 32(9): 747-751. Chang Y, Li JL, Wang LH, et al. Surveillance for hemorrhagic fever with renal syndrome in Taizhou, Zhejiang, 2009-2015[J]. Dis Surveil, 2017, 32(9): 747-751. DOI:10.3784/j.issn.1003-9961.2017.09.011 |
| [4] |
吴彤, 毛玲玲. 锦州市肾综合征出血热发病率与鼠带毒指数相关性的研究[J]. 中华卫生杀虫药械, 2018, 24(1): 71-73. Wu T, Mao LL. Correlation between hemorrhagic fever with renal syndrome and rodent virus index in Jinzhou[J]. Chin J Hyg Insect Equip, 2018, 24(1): 71-73. DOI:10.19821/j.1671-2781.2018.01.022 |
| [5] |
付仁龙, 陈盛恩, 夏金连, 等. 南昌市安义县2009-2016年肾综合征出血热宿主动物监测结果分析[J]. 中国媒介生物学及控制杂志, 2019, 30(2): 200-202. Fu RL, Chen SE, Xia JL, et al. An analysis of surveillance results of host animals of hemorrhagic fever with renal syndrome from 2009 to 2016 in Anyi county, Nanchang, Jiangxi province, China[J]. Chin J Vector Biol Control, 2019, 30(2): 200-202. DOI:10.11853/j.issn.1003.8280.2019.02.020 |
| [6] |
刘平, 陈华, 黄铮铮, 等. 2015-2017年绵阳市城区鼠类密度监测分析[J]. 预防医学情报杂志, 2019, 35(5): 432-434. Liu P, Chen H, Huang ZZ, et al. Analysis on the rodent density monitoring in urban areas of Mianyang city from 2015 to 2017[J]. J Prev Med Inf, 2019, 35(5): 432-434. |
| [7] |
王计争, 许学伟. 滁州市2011-2016年鼠密度监测[J]. 中华卫生杀虫药械, 2019, 25(2): 160-162. Wang JZ, Xu XW. Investigation on rodent density in Chuzhou city from 2011 to 2016[J]. Chin J Hyg Insect Equip, 2019, 25(2): 160-162. DOI:10.19821/j.1671-2781.2019.02.020 |
| [8] |
闫冬明, 王玉姣, 李贵昌, 等. 2016年全国鼠类监测报告[J]. 中国媒介生物学及控制杂志, 2019, 30(2): 123-127. Yan DM, Wang YJ, Li GC, et al. National vectors surveillance report on rodents in China, 2016[J]. Chin J Vector Biol Control, 2019, 30(2): 123-127. DOI:10.11853/j.issn.1003.8280.2019.02.002 |
| [9] |
庞松涛, 王欣, 陈保忠, 等. 西安市主要鼠种密度调查研究[J]. 中华卫生杀虫药械, 2015, 21(3): 269-271. Pang ST, Wang X, Chen BZ, et al. Investigation on rodent density in Xi'an city[J]. Chin J Hyg Insect Equip, 2015, 21(3): 269-271. DOI:10.19821/j.1671-2781.2015.03.018 |
| [10] |
郑媛, 周步宇, 朱妮, 等. 陕西省2006-2017年肾综合征出血热流行特征及疫苗接种策略探讨[J]. 中华疾病控制杂志, 2018, 22(10): 1073-1075. Zheng Y, Zhou BY, Zhu N, et al. Epidemiological characteristics and the strategy of vaccination on hemorrhagic fever with renal syndrome in Shaanxi province, from 2006 to 2017[J]. Chin J Dis Control Prev, 2018, 22(10): 1073-1075. DOI:10.16462/j.cnki.zhjbkz.2018.10.022 |
| [11] |
冯茜, 唐道洲, 李世娥, 等. 2013-2017年哈尔滨市肾综合征出血热流行特征分析[J]. 现代预防医学, 2019, 46(12): 2122-2124, 2178. Feng Q, Tang DZ, Li SE, et al. Epidemiological characteristics of hemorrhagic fever with renal syndrome in Harbin from 2013 to 2017[J]. Mod Prev Med, 2019, 46(12): 2122-2124, 2178. |
| [12] |
张家勇, 丁俊, 白玉银, 等. 辽宁省2006-2015年鼠类密度及种群结构分析[J]. 中国媒介生物学及控制杂志, 2017, 28(1): 51-55. Zhang JY, Ding J, Bai YY, et al. Analysis of rodent density and constituent in Liaoning province, China, during 2006-2015[J]. Chin J Vector Biol Control, 2017, 28(1): 51-55. DOI:10.11853/j.issn.1003.8280.2017.01.014 |
| [13] |
霍锡元, 宋明明, 孙坚毅, 等. 潍坊市2012-2015年鼠密度监测分析[J]. 中华卫生杀虫药械, 2016, 22(5): 483-484. Huo XY, Song MM, Sun JY, et al. Rodent surveillance from 2012 to 2015 in Weifang city[J]. Chin J Hyg Insect Equip, 2016, 22(5): 483-484. DOI:10.19821/j.1671-2781.2016.05.021 |
| [14] |
彭莱, 何俊, 肖珊, 等. 长沙市2006-2015年鼠密度监测分析[J]. 中国媒介生物学及控制杂志, 2016, 27(6): 617-619. Peng L, He J, Xiao S, et al. Analysis of the rodent density monitoring in Changsha city from 2006 to 2015[J]. Chin J Vector Biol Control, 2016, 27(6): 617-619. DOI:10.11853/j.issn.1003.8280.2016.06.025 |
 2020, Vol. 31


