 2020, Vol. 31
扩展功能
文章信息
- 王学军, 孙钦同, 韩英男, 宫学诗, 赖世宏, 张世水
- WANG Xue-jun, SUN Qin-tong, HAN Ying-nan, GONG Xue-shi, LAI Shi-hong, ZHANG Shi-shui
- 2010-2018年山东省国家级鼠类监测点监测报告
- Surveillance report of national rodent surveillance sites in Shandong province, China, 2010-2018
- 中国媒介生物学及控制杂志, 2020, 31(3): 300-304
- Chin J Vector Biol & Control, 2020, 31(3): 300-304
- 10.11853/j.issn.1003.8280.2020.03.011
-
文章历史
- 收稿日期: 2020-01-21


鼠类是重要的病媒生物之一, 可携带多种病原体, 传播鼠疫、肾综合征出血热等疾病[1]。鼠密度监测是鼠类防制的重点工作之一, 是制定鼠类防制措施的重要依据和鼠类防制效果考察的重要方法。山东省地处东部沿海, 黄河下游, 属暖温带季风气候, 地形多样, 非常适合一些病媒生物的生长繁殖。为了解山东省人居及周边环境常见的鼠种、密度及其季节消长趋势, 为开展科学监测、有效防控提供依据, 现将2010-2018年山东省鼠类监测结果报告如下。
1 材料与方法 1.1 数据来源山东省病媒生物监测系统中2010-2018年鼠类监测数据。
1.2 监测点的选择综合考虑地理位置、经费能力、各地市开展工作能力, 在全省范围内选定3个地级市作为病媒生物监测国家级监测点。其中2010-2013年确定的监测点是济南、青岛和东营市, 2014年, 将东营市调整为聊城市。
1.3 监测方法按照《全国病媒生物监测方案(试行)》[2]、《全国病媒生物监测实施方案》[3](中疾控传防发〔2016〕56号)和《山东省病媒生物监测实施方案》中的夹(笼)夜法进行监测。主要对城镇居民区、农村居民区、重点行业进行监测, 每一监测生境每月布夹累计不少于200有效夹(笼)夜。将捕获鼠进行鼠种鉴定, 并同时记录性别等信息, 逐只登记并顺序编号。
1.4 监测时间每2个月(单月监测)至少监测1次, 每监测月中旬开展工作, 2次监测时间间隔不小于30 d。
1.5 监测数据的处理2010-2015年采用全年监测方法, 2016年按《全国病媒生物监测实施方案》(中疾控传防发〔2016〕56号), 减少了鼠类监测频次, 可根据实际情况调整监测方法, 故2016-2018年采用单月监测, 未开展监测的月份未计入统计。
1.6 统计学分析采用Excel 2010和ArcGIS 10.6软件对山东省病媒生物国家级监测点鼠类监测数据进行统计分析。鼠密度以每百只鼠夹(笼)捕获鼠数量, 即捕获率表示:捕获率(%)=〔捕鼠总数(只)/(有效夹(笼)总数(只)〕×100。
2 结果 2.1 鼠种组成情况2010-2018年山东省国家级病媒生物监测点共捕获鼠类1 374只, 总体密度为0.82%。以褐家鼠(Rattus norvegicus)和小家鼠(Mus musculus)为优势种, 构成比分别为48.84%和40.68%, 在2011年, 褐家鼠占比最高, 达74.01%, 而小家鼠在该年占比最低, 为24.86%。不同年份各鼠种构成比排序基本一致。黑线姬鼠(Apodemus agrarius)和黄胸鼠(R. tanezumi)的构成比分别为7.79%和0.15%, 居第3、4位。历年监测未发现黄毛鼠(R. losea), 见图 2。

|
| 图 1 山东省国家级病媒生物监测系统鼠类监测点分布 Figure 1 Distribution of national vector surveillance sites for rodents in Shandong province |
| |

|
| 图 2 2010-2018年山东省国家级病媒生物监测点鼠种构成情况 Figure 2 Species composition of rodents at national vector surveillance sites in Shandong province, 2010-2018 |
| |
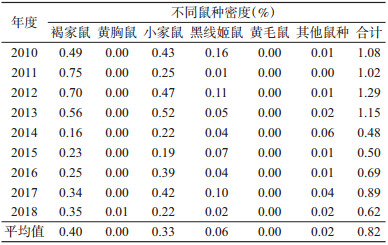
2010-2018年鼠类总密度个别年份虽有上升但总体上呈下降趋势。褐家鼠密度最高, 达0.40%, 其密度呈先升后降, 2015年后有缓慢升高趋势;小家鼠密度为0.33%, 其密度平稳中有波动, 近年略有下降。黑线姬鼠密度为0.06%, 年消长趋势与小家鼠类似。不同年份各鼠种密度排名不同, 多数年份褐家鼠最高, 但在个别年份小家鼠密度高于褐家鼠, 2017年小家鼠密度高达0.42%;黑线姬鼠密度总体维持在较低水平, 密度最高出现在2010年, 为0.16%, 见表 1。
|
2010-2018农村居民区、重点行业、城镇居民区的鼠密度分别为1.16%、0.74%和0.58%。在城镇居民区和农村居民区均以褐家鼠密度最高, 分别为0.35%和0.42%;而在重点行业以小家鼠密度最高, 为0.56%, 见图 3。不同年份、不同生境鼠类密度排序不一致, 农村居民区鼠密度一直较高, 城镇居民区和重点行业鼠密度总体呈下降趋势, 但近年特别是重点行业略有升高, 见图 4。

|
| 图 3 2010-2018年山东省国家级病媒生物监测点不同生境、不同鼠种密度 Figure 3 Density of rodents of different species and from different habitats at national vector surveillance sites in Shandong province, 2010 to 2018 |
| |

|
| 图 4 2010-2018年山东省国家级病媒生物监测点各生境捕获鼠类密度 Figure 4 Density of rodents captured in different habitats at national vector surveillance sites in Shandong province, 2010-2018 |
| |
2010-2015年各监测点全年各月均进行监测, 捕获鼠类总密度季节消长趋势呈双峰分布, 一般从3月开始升高, 6月达最高, 后开始下降, 9月又开始小幅增高, 10月达小高峰, 之后开始缓慢下降。2016-2018年各监测点采用奇数月开展鼠密度监测, 每年仍呈现5-6和9月的鼠密度高峰期, 见图 5。

|
| 图 5 2010-2018年山东省国家级病媒生物监测点鼠类密度季节消长情况 Figure 5 Seasonal fluctuation of rodent density at national vector surveillance sites in Shandong province, 2010 to 2018 |
| |
褐家鼠和小家鼠的总密度消长趋势大致呈双峰分布, 与鼠类总密度趋势相近, 但褐家鼠略有不同, 2-3月鼠密度有一小高峰, 见图 6。

|
| 图 6 2010-2018年山东省国家级病媒生物监测点不同鼠种密度季节消长情况 Figure 6 Seasonal fluctuation of density of different rodent species at national vector surveillance sites in Shandong province, 2010-2018 |
| |
优势鼠种中, 各生境褐家鼠和小家鼠密度季节消长趋势与总鼠密度相似, 褐家鼠密度除在重点行业的2和6月较高外, 其余各月在3种生境褐家鼠密度季节消长趋势相似(图 7A);而小家鼠全年在农村居民区始终最高, 5-6月在农村居民区和城镇居民区小家鼠密度有一小高峰(图 7B), 12月至翌年1月农村居民区的小家鼠密度出现一小高峰。

|
| 图 7 2010-2018年山东省国家级病媒生物监测点不同生境褐家鼠和小家鼠密度季节消长情况 Figure 7 Seasonal fluctuation of density of Rattus norvegicus and Mus musculus from different habitats at national vector surveillance sites in Shandong province, 2010-2018 |
| |
2010-2018年山东省优势鼠种为褐家鼠和小家鼠, 其中褐家鼠的构成比最高, 达48.84%, 小家鼠为40.68%, 与2006-2015年全国鼠类监测结果[4]、2016年全国鼠类监测结果[5]及辽宁省等地[6-8]鼠类监测结果的优势鼠种相似, 但与河南[9]、四川省[10]不同。2010-2018年鼠类构成比排序基本一致, 各鼠种构成比处于稳定的区间。捕获的黑线姬鼠和黄胸鼠较少, 主要是由于黑线姬鼠常栖息在野外的田间空地、地埂、土堤等场所, 而我们的监测点主要设置在城区居民区、餐饮店、农村居民室内及院落, 所以捕获数量较少。而黄胸鼠主要分布在我国南方, 且喜栖息于民房, 适合黄胸鼠栖息的瓦房越来越少[9]。本研究未捕获到黄毛鼠, 可能与该鼠是南方常见的野栖鼠种有关[4]。
3.2 鼠类密度2010-2018年总鼠密度虽有个别年份有所小幅上升, 但整体上呈下降趋势。各生境鼠密度除农村居民区一直较高外, 城镇居民区和重点行业鼠密度呈下降趋势, 但近年有所上升。褐家鼠和小家鼠是3类生境的主要鼠种。由于农村居民区鼠密度最高, 故建议今后应加强农村环境卫生整治, 减少鼠类栖息场所, 尤其是要在每年的春、冬季集中开展村内统一灭鼠, 有效降低鼠类密度。重点行业和城镇居民区鼠类防控也不能松懈, 必须加大对防鼠、灭鼠工作力度。
3.3 鼠类的季节变化趋势监测结果发现, 2010-2018年总鼠密度呈春、秋2个高峰, 居民区双峰曲线不明显, 与龚震宇等[11]和张家勇等[12]研究结果相近。褐家鼠在3种生境的密度分布特点不明显, 而在农村居民区, 小家鼠在11月至翌年2月及4-6月有2个密度高峰。提示不同鼠种在不同生境的季节消长趋势不同[4], 应基于监测结果, 在春、秋两季加大对鼠类, 特别是褐家鼠和小家鼠的防控力度, 农村居民区应持续开展灭鼠工作。
| [1] |
Meerburg BG, Singleton GR, Kijlstra A. Rodent-borne diseases and their risks for public health[J]. Crit Rev Microbiol, 2009, 35(3): 221-270. DOI:10.1080/10408410902989837 |
| [2] |
中华人民共和国卫生部.全国病媒生物监测方案(试行)[Z].北京: 中国疾病预防控制中心, 2005. Ministry of Health of the People's Republic of China. National vector surveillance program (Trial)[Z]. Beijing: Chinese Center for Disease Control and Prevention, 2005. |
| [3] |
中国疾病预防控制中心.全国病媒生物监测实施方案[Z].北京: 中国疾病预防控制中心, 2016. Chinese Center for Disease Control and Prevention. National vector surveillance implementation plan[Z]. Beijing: Chinese Center for Disease Control and Prevention, 2016. |
| [4] |
吴海霞, 鲁亮, 孟凤霞, 等. 2006-2015年我国鼠类监测报告[J]. 中国媒介生物学及控制杂志, 2017, 28(6): 517-522. Wu HX, Lu L, Meng FX, et al. Reports on national surveillance of rodents in China, 2006-2015[J]. Chin J Vector Biol Control, 2017, 28(6): 517-522. DOI:10.11853/j.issn.1003.8280.2017.06.001 |
| [5] |
闫冬明, 王玉娇, 李贵昌, 等. 2016年全国鼠类监测报告[J]. 中国媒介生物学及控制杂志, 2019, 30(2): 123-127. Yan DM, Wang YJ, Li GC, et al. National vectors surveillance report on rodents in China, 2016[J]. Chin J Vector Biol Control, 2019, 30(2): 123-127. DOI:10.11853/j.issn.1003.8280.2019.02.002 |
| [6] |
张家勇, 丁俊, 白玉银, 等. 辽宁省2006-2015年鼠类密度及种群结构分析[J]. 中国媒介生物学及控制杂志, 2017, 28(1): 51-55. Zhang JY, Ding J, Bai YY, et al. Analysis of rodent density and constituent in Liaoning province, China, during 2006-2015[J]. Chin J Vector Biol Control, 2017, 28(1): 51-55. DOI:10.11853/j.issn.1003.8280.2017.01.014 |
| [7] |
吴瑜燕, 龚震宇, 侯娟, 等. 浙江省2011-2013年病媒生物监测结果分析[J]. 中国媒介生物学及控制杂志, 2015, 26(4): 394-397. Wu YY, Gong ZY, Hou J, et al. Analysis of vector surveillance from 2011 to 2013 in Zhejiang province, China[J]. Chin J Vector Biol Control, 2015, 26(4): 394-397. DOI:10.11853/j.issn.1003.4692.2015.04.017 |
| [8] |
杨瑞, 谭梁飞, 熊进峰, 等. 湖北省2015年病媒生物监测结果分析[J]. 中国媒介生物学及控制杂志, 2017, 28(5): 492-495. Yang R, Tan LF, Xiong JF, et al. Analysis of disease vector surveillance in Hubei province, China in 2015[J]. Chin J Vector Biol Control, 2017, 28(5): 492-495. DOI:10.11853/j.issn.1003.8280.2017.05.023 |
| [9] |
赵奇, 高丽君, 唐振强, 等. 河南省鼠密度监测及季节消长[J]. 中华卫生杀虫药械, 2015, 21(4): 390-392. Zhao Q, Gao LJ, Tang ZQ, et al. Seasonal fluctuation of the rodent density in Henan province[J]. Chin J Hyg Insect Equip, 2015, 21(4): 390-392. DOI:10.19821/j.1671-2781.2015.04.021 |
| [10] |
余技钢, 胡雅劼, 李观翠, 等. 2014年四川省部分城市鼠类监测结果分析[J]. 寄生虫病与感染性疾病, 2016, 14(3): 189-191. Yu JG, Hu YJ, Li GC, et al. Surveillance on rodent in some cities of Sichuan province[J]. Parasit Infect Dis, 2016, 14(3): 189-191. |
| [11] |
龚震宇, 凌锋, 侯娟, 等. 浙江省病媒生物监测点鼠类监测结果分析[J]. 疾病监测, 2013, 28(11): 914-916. Gong ZY, Ling F, Hou J, et al. Rodents surveillance in Zhejiang province[J]. Dis Surveill, 2013, 28(11): 914-916. DOI:10.3784/j.issn.1003-9961.2013.11.013 |
| [12] |
张家勇, 丁俊, 白玉银, 等. 2006-2015年辽宁省鼠类密度季节消长趋势分析[J]. 中华卫生杀虫药械, 2018, 24(2): 149-153. Zhang JY, Ding J, Bai YY, et al. Analysis on rodent density seasonal fluctuation in Liaoning province from 2006 to 2015[J]. Chin J Hyg Insect Equip, 2018, 24(2): 149-153. DOI:10.19821/j.1671-2781.2018.02.011 |