 2020, Vol. 31
扩展功能
文章信息
- 运玲, 王福才, 张秋芬
- YUN Ling, WANG Fu-cai, ZHANG Qiu-fen
- 差分自回归移动平均模型在蚊密度分布特征预测中的应用
- Application of autoregressive integrated moving average model in prediction of the distribution characteristics of mosquito density in Tangshan, Hebei province, China
- 中国媒介生物学及控制杂志, 2020, 31(1): 21-26
- Chin J Vector Biol & Control, 2020, 31(1): 21-26
- 10.11853/j.issn.1003.8280.2020.01.005
-
文章历史
- 收稿日期: 2019-08-25
- 网络出版时间: 2019-12-30 09:36


蚊虫是多种传染病的传播媒介,如流行性乙型脑炎(乙脑)、疟疾、登革热、丝虫病、黄热病和寨卡病毒病等。近几年来蚊媒传染病在我国发病率持续上升,且已成为病死率较高的媒介传染病[1]。连续系统的蚊密度监测是有效控制病媒生物的基础和依据。差分自回归移动平均(autoregressive integrated moving average,ARIMA)模型是根据一组随时间变化而互相关联的动态数据而形成的一种分析方法,用于描述任何齐次非平稳时间序列[2],是时间序列分析方法中最常用的1种。本研究收集唐山市2010-2018年的蚊虫密度和季节消长调查数据,将2010-2017年唐山市的蚊密度监测数据引入ARIMA模型进行建模,预测2018年的蚊密度,对蚊密度的动态趋势进行预测预警,有效预防蚊媒疾病的传播,为唐山市未来的防蚊工作提供科学依据。
1 材料与方法 1.1 资料来源汇总2010-2018年唐山市各监测点蚊虫数量和季节消长数据。唐山市2010-2018年蚊密度监测时间为每年的5-10月,本研究中1-4月和11-12月的蚊密度设定为0只/(灯·h)。
1.2 监测方法依据《全国病媒生物监测方案(试行)》[3]中的诱蚊灯法,选择唐山市城区居民区、公园、医院和郊区农村民房及牲畜棚,统一使用“功夫小帅”牌诱蚊灯(武汉吉星环保科技有限公司生产),远离干扰光源,避风,挂灯位置距离地面1.5 m,从日落后20 min开始接通电源,连续诱捕6 h,次日鉴定蚊种并计数,每月上、下旬各监测1次。
1.3 统计学方法应用Excel 2007软件录入2010-2018年蚊密度监测数据,用SPSS 22.0软件进行数据分析,构成比的比较采用χ2检验,检验水准α=0.05。利用ARIMA模型进行建模与预测。
1.3.1 ARIMA模型的基本原理与方法[2]从时间序列本身的相关性出发,将各种数学表达式纳入模型,并努力创建时间序列的回归方程以达到预测未来值的目的。ARIMA(p,d,q)×(P,D,Q)s模型中p、d、q分别表示自回归的阶、差分的阶和移动平均的阶,P、D、Q则是指季节性的阶数,s表示季节性周期。
1.3.2 ARIMA模型的建模步骤[4]① 序列平稳化:对非平稳序列进行差分处理转化为平稳序列;②模型识别和创建:基于自相关和部分相关函数建立可能的模型;③参数估计:模型参数的估计和假设检验;④参数诊断:判断所建立的模型是否合适,模型的残差序列为白噪声序列,各参数显著,可用于预测;⑤预测应用:利用2010-2017年各月总蚊密度数据所建立的模型,预测2018年各月的总蚊密度,并根据2018年实际监测密度评估预测效果。
2 结果 2.1 蚊虫种类构成2010-2017年共捕获成蚊22 335只,其中淡色库蚊(Culex pipiens pallens)占捕获总数的98.02%,为优势蚊种;中华按蚊(Anopheles sinensis)占1.69%,白纹伊蚊(Aedes albopictus)占0.23%,三带喙库蚊(Cx. tritaeniorhynchus)占0.02%;其他蚊种占0.04%,见表 1。
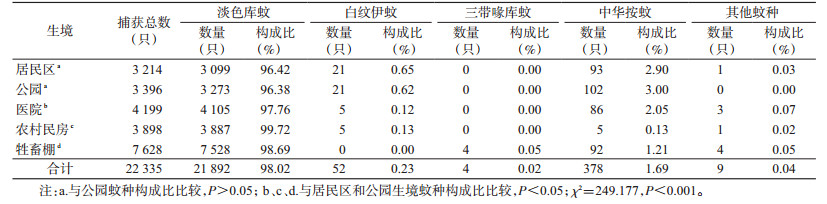 |
在不同监测生境中,蚊种构成排在首位的均为淡色库蚊。不同生境蚊种构成比差异有统计学意义(χ2=249.177,P < 0.001),对不同生境蚊种构成进行两两比较,除居民区和公园蚊种构成比差异无统计学意义(P>0.05)外,其他生境两两比较差异均有统计学意义(P < 0.05),见表 1。
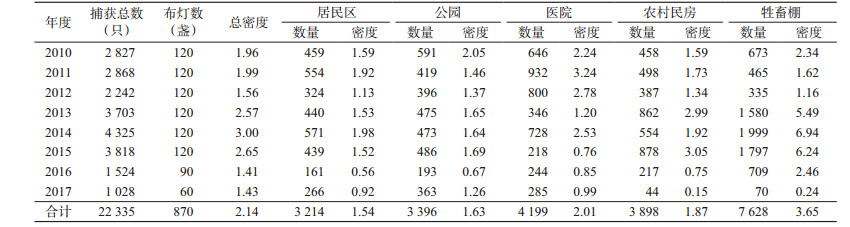
2.2 不同年度不同生境成蚊密度2010-2017年共布放诱蚊灯870盏,成蚊总密度为2.14只/(灯·h),在5类生境中,牲畜棚中蚊密度最高为3.65只/(灯·h),居民区蚊密度最低为1.54只/(灯·h);从不同年份看,2014年蚊密度最高为3.00只/(灯·h),2016年蚊密度最低为1.41只/(灯·h),见表 2。
 |
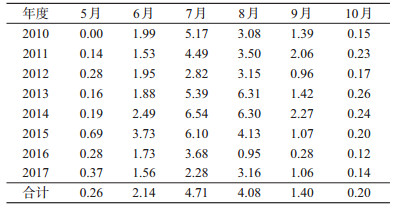
2010-2017年总蚊密度以7月最高,为4.71只/(灯·h),各年份蚊密度均为单峰曲线,除2012、2013和2017年高峰出现在8月外,其余年份蚊密度高峰均出现在7月,见表 3。淡色库蚊在7月达到高峰,密度为4.70只/(灯·h);中华按蚊在8月达到高峰,密度为0.18只/(灯·h)。在不同生镜中,蚊密度也呈单峰曲线,高峰均出现在7月,居民区、公园、医院、农村民房和牲畜棚7月密度分别为3.19、3.06、4.04、4.16和9.09只/(灯·h),见图 1。
 |

|
| 图 1 2010-2017年河北省唐山市不同生境蚊密度季节消长情况 Figure 1 Seasonal fluctuations in mosquito density in different habitats of Tangshan, Hebei province, China, 2010-2017 |
| |
将2010-2017年唐山市蚊密度绘制成时间序列图,各年蚊密度均呈明显的周期性。季节周期为12个月,该序列为非平稳序列,见图 2。为使平稳性满足ARIMA模型的需要,对数据进行1次差分和1次季节性差分,随机序列近似平稳,见图 3。

|
| 图 2 2010-2017年河北省唐山市蚊密度时间序列结果 Figure 2 Time series plot of mosquito density in Tangshan, Hebei province, China, 2010-2017 |
| |

|
| 图 3 一阶非季节性差分和一阶季节性差分(12个月为1个周期)后的蚊密度序列结果 Figure 3 Time series plot of mosquito density after first-order non-seasonal difference and first-order seasonal difference (12 months were defined as 1 cycle) |
| |
原始序列经过一阶非季节差分和一阶季节差分,得出ARIMA(p,1,q)×(P,1,Q)12模型,12表示12个月为1个周期,对差分后平稳的时间序列做自相关(ACF)和偏自相关(PACF)图(图 4)。

|
| 图 4 原序列经一阶非季节差分和一阶季节差分后的自相关和偏自相关 Figure 4 Autocorrelation and partial autocorrelation of the original series after first-order non-seasonal difference and first-order seasonal difference |
| |
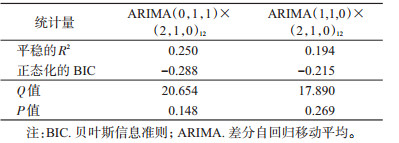
根据差分后的ACF和PACF图,p、q、P和Q从低到高选择,根据模型的参数及平稳R2和标准化贝叶斯信息准则(BIC)值进行分析,选择ARIMA(0,1,1)×(2,1,0)12和ARIMA(1,1,0)×(2,1,0)12为备选模型,依据平稳R2越大,BIC值越小拟合越好,最终选择ARIMA(0,1,1)×(2,1,0)12作为最佳模型,见表 4。
采用Ljung-Box检验方法得出残差是白噪声序列(Q=20.654,P=0.148),表明残差是随机误差,残差ACF和PACF均落入95%可信区间(95%CI)范围内,见图 5。模型的参数评估结果见表 5,最终得出的模型数学表达式:(1+0.016B12+0.454B24)(1-B)(1-B12)Yt=(1- 0.585B)et。

|
| 注:ACF.自相关;PACF.偏自相关。 图 5 ARIMA(0,1,1)×(2,1,0)12模型残差序列的自相关和偏自相关 Figure 5 Autocorrelation and partial autocorrelation of the residual series of the ARIMA (0, 1, 1)×(2, 1, 0)12 model |
| |
 |
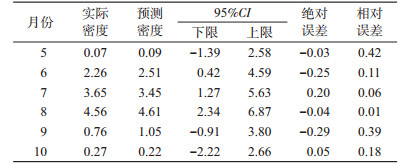
根据建立的模型预测2018年的总蚊密度,5-10月的预测值分别为0.09、2.51、3.45、4.61、1.05和0.22只/(灯·h),实际的蚊密度分别为0.07、2.26、3.65、4.56、0.76和0.27只/(灯·h),二者的平均相对误差为19.44%,<20%为合格模型,可用于预测。在预测过程中实际值均落入预测值95%CI范围内,说明蚊密度正常,用此模型预测的蚊密度季节消长趋势与实际值基本吻合,表明此模型能够较好地拟合实际的蚊密度,可用于中短期蚊密度预测,见图 6、表 6。

|
| 图 6 2010-2018年河北省唐山市蚊密度实际值与模型拟合值及预测值分布 Figure 6 Distributions of actual mosquito densities and the fitted and predicted values of the model in Tangshan, Hebei province, China, 2010-2018 |
| |
 |
2010-2017年在唐山市区共捕获成蚊22 335只,其中淡色库蚊为该地区的优势蚊种,中华按蚊、白纹伊蚊和三带喙库蚊的数量相对较少,中华按蚊是疟疾的主要传播媒介[5];白纹伊蚊可以传播登革热、寨卡病毒病和基孔肯雅热;三带喙库蚊可以传播乙脑[6]。当前,唐山市主要的蚊媒传染病有乙脑和疟疾,做好蚊虫的监测是防治蚊媒传染病最有效的措施。
蚊虫的孳生和繁殖受到温度和降雨等气候的影响,唐山市地处渤海湾中心地带,位于河北省东部,属于温带季风气候,夏天炎热多雨,降雨主要集中在7-8月,导致积水增多,蚊密度迅速达到高峰,2010-2017年唐山市月平均蚊密度7月达到最高峰,各年蚊密度高峰均出现在7、8两月,由此也证明蚊密度与气温和降雨呈一定的相关关系[7-8]。
时间序列是通过利用研究对象历史数据之间随时间不断变化而得出的规律预测未来值的一种统计方法[9-10]。ARIMA模型考虑了季节因素对时间序列平稳性的影响,对短期趋势预测准确率较高[11]。目前,ARIMA模型已应用于各种传染病发病率的预测[12-14],本研究将ARIMA模型应用于唐山市蚊密度分布特征预测的研究中,从2010-2017年,ARIMA模型用于拟合唐山市各月的蚊虫密度,最后选择ARIMA(0,1,1)×(2,1,0)12作为最佳模型,并对2018年的蚊密度进行预测,预测值与实际值拟合较好,整体动态趋势和季节规律基本吻合,模型预测效果较为理想。该方法可以应用于举办大型活动前对蚊虫及蚊媒传染病的风险评估中。在举办活动前应用ARIMA模型对蚊密度进行预测,将其作为预警值,在活动举办期间,结合实际监测的蚊密度可更直观迅速的进行预警,当实际蚊密度达到或超过预警值时,应立即预警,并迅速组织应急队伍及时有效地开展灭蚊工作,并根据蚊密度与蚊媒疾病的关系,及时提醒相关医疗单位为蚊媒疾病的暴发流行做好准备,从而科学有效地保障大型活动时蚊媒疾病的防治。
本研究ARIMA模型可较好地预测未来的蚊虫密度,将拟合的数学模型应用于媒介蚊虫监测网络信息系统[15],并根据不同地区成蚊密度与蚊媒疾病之间发生的联系,乘以一定的系数可以用作网络监测信息系统中蚊密度的预警值[16],结合不同地区蚊密度上报的实际数值和动态趋势迅速准确地进行预报预警,从而可以第一时间监测到疑似疫情信息。
综上所述,今后可以采用本研究拟合的ARIMA(0,1,1)×(2,1,0)12模型对唐山市的蚊密度进行早期预测,并结合实际监测情况及时进行预警,为唐山市蚊媒传染病的防控提供科学依据。
| [1] |
孙洪清, 肖宏, 陈良. 重视蚊媒传染病[J]. 医学研究杂志, 2016, 45(9): 1-3. Sun HQ, Xiao H, Chen L. Pay attention to mosquito-borne diseases[J]. J Med Res, 2016, 45(9): 1-3. DOI:10.11969/j.issn.1673-548X.2016.09.001 |
| [2] |
孙振球, 徐勇勇. 医学统计学[M]. 4版. 北京: 人民卫生出版社, 2014: 390-400. Sun ZQ, Xu YY. Medical statistics[M]. 4th ed. Beijing: People's Medical Publishing House, 2014: 390-400. |
| [3] |
中华人民共和国卫生部.全国病媒生物监测方案(试行)[Z].北京: 中国疾病预防控制中心, 2005. The Ministry of Health of the People's Republic of China. The vector biological monitoring program (trial)[S]. Beijing: Chinese Center for Disease Control and Prevention, 2005. |
| [4] |
王永斌, 柴峰, 李向文, 等. ARIMA模型与残差自回归模型在手足口病发病预测中的应用[J]. 中华疾病控制杂志, 2016, 20(3): 303-306. Wang YB, Chai F, Li XW, et al. Application of ARIMA model and auto-regressive model in prediction on incidence of hand-foot-mouth disease[J]. Chin J Dis Control Prev, 2016, 20(3): 303-306. DOI:10.16462/j.cnki.zhjbkz.2016.03.022 |
| [5] |
丰燕, 阮卫, 潘金仁, 等. 浙江省2012-2017年传疟媒介监测结果分析[J]. 中国媒介生物学及控制杂志, 2019, 30(5): 540-544. Feng Y, Ruan W, Pan JR, et al. An analysis of surveillance results of malaria vectors in Zhejiang province, China, from 2012 to 2017[J]. Chin J Vector Biol Control, 2019, 30(5): 540-544. DOI:10.11853/j.issn.1003.8280.2019.05.014 |
| [6] |
王小军, 蔡玉成, 贾续珍, 等. 甘肃省陇南市流行性乙型脑炎疫情与蚊媒监测结果相关性分析[J]. 中国媒介生物学及控制杂志, 2019, 30(5): 502-505. Wang XJ, Cai YC, Jia XZ, et al. Correlation between Japanese encephalitis epidemic and mosquito vector surveillance results in Longnan, Gansu province, China[J]. Chin J Vector Biol Control, 2019, 30(5): 502-505. DOI:10.11853/j.issn.1003.8280.2019.05.005 |
| [7] |
高文, 马丽华, 黄钢, 等. 河北省2013-2015年蚊媒传染病与蚊密度相关性分析[J]. 中国媒介生物学及控制杂志, 2016, 27(4): 350-353. Gao W, Ma LH, Huang G, et al. Analysis on correlation between mosquito-borne diseases and seasonality of mosquito density in Hebei province from 2013 to 2015[J]. Chin J Vector Biol Control, 2016, 27(4): 350-353. DOI:10.11853/j.issn.1003.8280.2016.04.009 |
| [8] |
谢博, 冯磊, 顾盈培, 等. 气候因素对浦东新区蚊虫密度影响的效应分析[J]. 中国媒介生物学及控制杂志, 2019, 30(4): 430-433. Xie B, Feng L, Gu YP, et al. An analysis of the effect of climatic factors on mosquito density in Pudong New Area, Shanghai, China[J]. Chin J Vector Biol Control, 2019, 30(4): 430-433. DOI:10.11853/j.issn.1003.8280.2019.04.017 |
| [9] |
肖珊, 彭莱, 龙建勋, 等. 长沙市2007-2015年成蚊密度监测及趋势分析[J]. 中国媒介生物学及控制杂志, 2017, 28(1): 46-50. Xiao S, Peng L, Long JX, et al. The population density analysis of adult mosquitoes in Changsha city, China from 2007 to 2015[J]. Chin J Vector Biol Control, 2017, 28(1): 46-50. DOI:10.11853/j.issn.1003.8280.2017.01.013 |
| [10] |
高文, 黄钢, 马丽华, 等. 差分自回归移动平均模型在河北省鼠密度监测信息系统中的应用研究[J]. 中国媒介生物学及控制杂志, 2017, 28(3): 265-268. Gao W, Huang G, Ma LH, et al. Application of autoregressive integrated moving average (ARIMA) model in information system for rodent surveillance in Hebei province[J]. Chin J Vector Biol Control, 2017, 28(3): 265-268. DOI:10.11853/j.issn.1003.8280.2017.03.018 |
| [11] |
Liu L, Luan RS, Yin F, et al. Predicting the incidence of hand, foot and mouth disease in Sichuan province, China using the ARIMA model[J]. Epidemiol Infect, 2016, 144(1): 144-151. DOI:10.1017/S0950268815001144 |
| [12] |
孙霞霞, 葛锦荣, 李巧方, 等. ARIMA模型在宁波市北仑区手足口病发病率预测中的应用[J]. 现代预防医学, 2018, 45(4): 582-586. Sun XX, Ge JR, Li QF, et al. Application of ARIMA model on forecasting incidence of hand-foot-mouth disease in Beilun district[J]. Mod Prev Med, 2018, 45(4): 582-586. |
| [13] |
朱佳佳, 胡登利, 洪秀琴, 等. 基于时空大数据的甲型肝炎发病率分布特征分析及预测模型[J]. 中华疾病控制杂志, 2018, 22(11): 1144-1147. Zhu JJ, Hu DL, Hong XQ, et al. Analysis of distribution characteristics and prediction model of hepatitis A incidence based on spatiotemporal big data[J]. Chin J Dis Control Prev, 2018, 22(11): 1144-1147. DOI:10.16462/j.cnki.zhjbkz.2018.11.012 |
| [14] |
张静, 刘志东, 劳家辉, 等. 基于时间序列分解法预测肾综合征出血热发病趋势和季节性[J]. 中国公共卫生, 2018, 34(7): 1038-1041. Zhang J, Liu ZD, Lao JH, et al. Prediction for trend and seasonal variation of incidence of hemorrhagic fever with renal syndrome:time series decomposition analysis[J]. Chin J Public Health, 2018, 34(7): 1038-1041. DOI:10.11847/zgggws1116074 |
| [15] |
马丽华, 黄钢, 高文, 等. 河北省病媒生物监测信息管理系统软件的开发研制[J]. 中国媒介生物学及控制杂志, 2018, 29(1): 53-60. Ma LH, Huang G, Gao W, et al. Development of information management system software for vector surveillance in Hebei province[J]. Chin J Vector Biol Control, 2018, 29(1): 53-60. DOI:10.11853/j.issn.1003.8280.2018.01.014 |
| [16] |
高文, 黄钢, 韩晓莉. 基于蚊密度差分自回归移动平均模型预测流行性乙型脑炎的贝叶斯判别分析研究[J]. 中国媒介生物学及控制杂志, 2018, 29(6): 13-19. Gao W, Huang G, Han XL. Application of Bayes analysis in Japanese encephalitis prediction based on multiple seasonal autoregressive integrated moving average model[J]. Chin J Vector Biol Control, 2018, 29(6): 13-19. DOI:10.11853/j.issn.1003.8280.2018.06.003 |