扩展功能
文章信息
- 闫东, 刘冠纯, 候芝林, 康东梅, 杨顺林, 兰晓宇
- YAN Dong, LIU Guan-chun, HOU Zhi-lin, KANG Dong-mei, YANG Shun-lin, LAN Xiao-yu
- 利用两种生态位模型预测长爪沙鼠鼠疫疫源地动物间疫情潜在风险
- Using two ecological niche models to predict the potential risk of epizootic situation in the foci of Meriones unguiculatus plague
- 中国媒介生物学及控制杂志, 2020, 31(1): 12-15
- Chin J Vector Biol & Control, 2020, 31(1): 12-15
- 10.11853/j.issn.1003.8280.2020.01.003
-
文章历史
- 收稿日期: 2019-10-14
- 网络出版时间: 2019-12-30 09:37
生态位模型是将物种的分布数据与限制该物种分布的环境变量进行统计上的关联,建立分布与环境变量的关系,进而预测物种的地理分布或者潜在栖息地。根据使用物种分布数据的不同,分为presence-absence和presence-only模型两类[1]。presence-absence模型以规则集遗传算法模型(genetic algorithm for rule-set production model,GARP)最为常用;presence-only模型以最大熵模型(Maxent)最为常用。鼠疫是一种自然疫源性疾病[2],鼠疫自然疫源地的分布有明显的地域性,与当地气候环境等因素密切相关。本研究以内蒙古高原长爪沙鼠(Meriones unguiculatus)鼠疫疫源地为实验区,利用2种最常用的生态位模型预测长爪沙鼠鼠疫潜在风险区的分布,探讨生态位模型在鼠疫预测预警中的应用。
1 材料与方法 1.1 疫情数据2005-2014年期间,内蒙古高原长爪沙鼠鼠疫疫源地内鼠疫细菌学检验阳性数据,包括检菌时间、具体位置和经纬度。数据一部分来自于中国疾病预防控制系统的子系统鼠疫防治管理信息系统,一部分由相关鼠疫防控专业机构提供。
1.2 气象环境数据气候数据年平均温度、昼夜温差月平均值、昼夜温差与年温差比值、温度季节性变化、最热月份最高温度、最冷月份最低温度、年温度变化范围、最湿季平均温度、最干季平均温度、最热季平均温度、最冷季平均温度、年降水量、最湿月降水量、最干月降水量、降水量的季节变异系数、最湿季降水量、最干季降水量、最热季降水量、最冷季降水量、海拔、1-12月平均降水量数据均下载自Berkeley大学wordclim数据库,数据精度为30弧度/S。原始地图来源于国家基础地理信息中心1:100万全国基础地理数据库(http://www.webmap.cn/commres.do?method=result100W)。
1.3 研究方法 1.3.1 变量选择根据所获得的疫情阳性点数据处理后,按照阳性点和阴性对照点比例为1:4,在全国范围内抽取阴性对照点。分别提取阳性点和阴性对照点相关图层气候环境数据,添加因变量列,给疫情阳性点数据赋值为1,代表有疫情;阴性对照点数据赋值为0,代表无疫情,选用logistic回归,筛选纳入模型的变量。
1.3.2 生态位模型构建Maxent模型构建随机选取70%作为建立模型训练集,30%作为测试集,采用jackknife刀切法检验计算各自变量在适宜性估计中的相对重要性;GARP模型设定阳性数据70%为训练集,循环次数为20次,选择最佳子集法。
1.3.3 模型验证采用受试者工作特征曲线(receiver operating characteristic curve,ROC),评价模型预测效果,以假阳性率为横坐标,灵敏度为纵坐标绘制曲线,计算ROC曲线下面积(area under curve,AUC值)。以AUC值衡量模型预测精确度,比较GARP和Maxent 2种生态位模型建模效果。AUC值在0.50~0.70时,效果较差;0.71~0.90时,效果一般;>0.90效果较好[3-4]。
计算现有长爪沙鼠鼠疫疫源地内各级风险区域面积及所占百分比,进而验证模型预测效果。
1.3.4 潜在风险分级Maxent模型运行输出图层,参照王袁[5]和闫东[6]的研究分级标准进行分层分级[5-6]。GARP通过模型运算输出按照最优子集选择的10个最优模型进行加权叠加,对栅格数据图层进行分层分级,参照陈璐等[7]和刘欣[8]研究的分级标准进行。
1.4 统计学分析采用logistic回归进行多因素分析;数据处理和统计学分析使用SAS 9.3软件;栅格数据处理和地图绘制利用ArcGIS 10.3软件完成;建模软件包括Maxent 3.3.3k(下载自http:cs.princeton.edu/schapire/Maxent)和Desktop GARP Version1.1.6(下载自http://www.lifemapper.org/desktopgarp)。
2 结果 2.1 动物疫情影响因素选择有精确经、纬度信息且地理位置不重复的疫情阳性点278个,阴性对照点1 112个,筛选长爪沙鼠动物间鼠疫的气候环境危险因子。经logistic回归分析,海拔、温度季节变化、最热月份最高温度、最干季平均温度、最冷季平均温度、年降水量、最湿季降水量、最热季降水量、2月平均降水量、5月平均降水量、8月平均降水量、9月平均降水量差异有统计学意义(均P<0.05)。
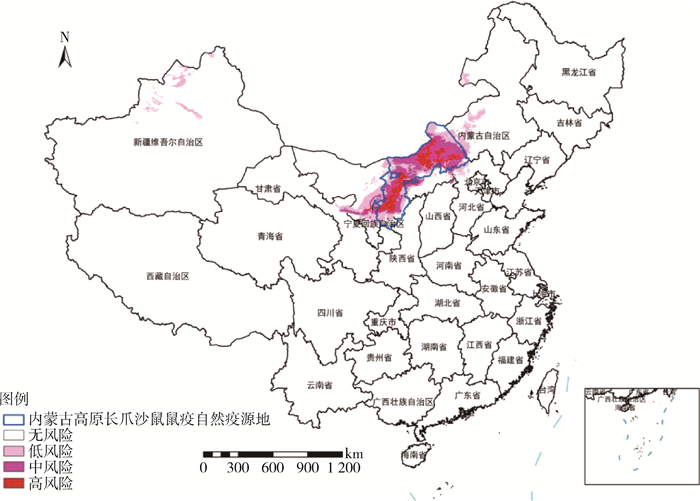
2.2 模型构建及风险分级将GARP模型运算结果中10个最优子集加权叠加并重分类叠加疫源地图层;Maxent模型构建运行结果分级分类处理并叠加疫源地图层。可见2个模型预测的中高风险区绝大部分位于长爪沙鼠鼠疫疫源地疫情较为活跃的区域内,预测为有长爪沙鼠鼠疫动物间疫情的潜在风险区域几乎涵盖了长爪沙鼠鼠疫自然疫源地,预测风险区域较实际鼠疫疫源地面积略大(图 1、2)。

|
| 注:原始地图来源于国家基础地理信息中心(1:25万全国基础地理数据库)。 图 1 内蒙古高原长爪沙鼠鼠疫疫源地动物间疫情潜在分布(Maxent模型预测结果) Figure 1 Potential distribution of epizootic situation in the foci of Meriones unguiculatus plague in the Inner Mongolian Plateau (prediction results of the maximum entropy model) |
| |

|
| 注:原始地图来源于国家基础地理信息中心(1:25万全国基础地理数据库)。 图 2 内蒙古高原长爪沙鼠鼠疫疫源地动物间疫情潜在分布(GARP模型预测结果) Figure 2 Potential distribution of epizootic situation in the foci of Meriones unguiculatus plague in the Inner Mongolian Plateau(prediction results of the genetic algorithm for rule-set production model) |
| |
截取Maxent模型和GARP模型预测所得的潜在风险区图层中现有疫源地部分,计算各风险区面积。Maxent模型预测结果,长爪沙鼠鼠疫疫源地范围内预测为有潜在风险的面积占该疫源地总面积的89.45%,其中低风险区占27.09%,中风险区占39.65%,高风险区占22.71%;预测为动物间疫情潜在中、高风险区在长爪沙鼠鼠疫疫源地内的面积占总面积的86.63%。GARP模型预测结果,现有长爪沙鼠鼠疫疫源地范围内预测为有潜在风险的面积占该疫源地总面积的96.43%,其中低风险区占8.24%,中风险区占6.45%,高风险区占81.74%;预测为动物间疫情潜在中、高风险区在长爪沙鼠鼠疫疫疫源地内的面积占总面积的48.57%。
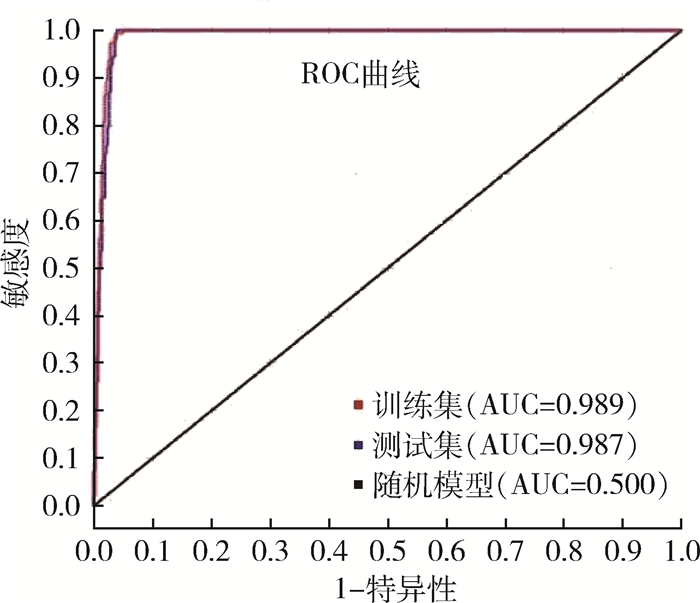
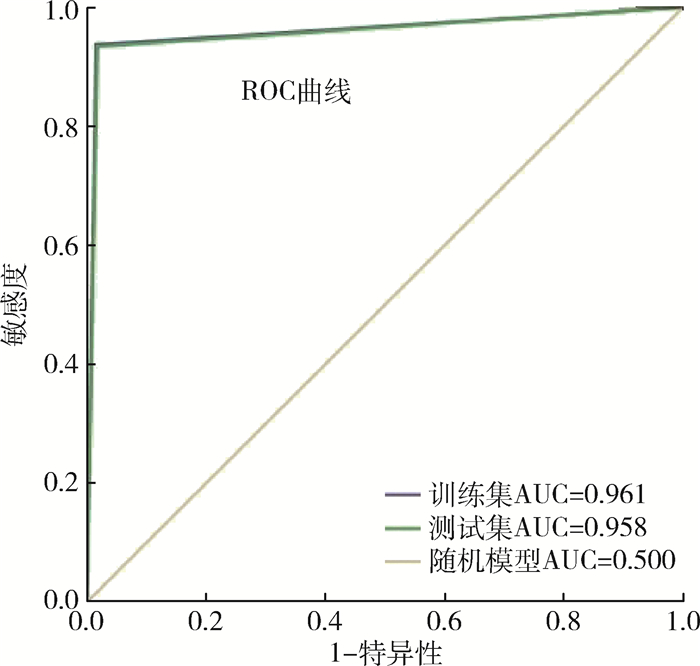
2.3 模型验证绘制ROC曲线可见,Maxent模型ROC曲线训练集和测试集的AUC值分别为0.989和0.987(图 3),远大于随机分布模型的AUC值(0.500),模型预测效果较好;GARP模型ROC曲线训练集和测试集的AUC值分别为0.961和0.958(图 4),远大于随机分布模型的AUC值(0.500),模型预测效果较好;Maxent模型较GARP模型拟合效果更好。

|
| 图 3 Maxent模型受试者工作特征(ROC)曲线 Figure 3 Receiver operating characteristic curve of the maximum entropy model |
| |

|
| 图 4 GARP模型受试者工作特征(ROC)曲线 Figure 4 Receiver operating characteristic curve of the genetic algorithm for rule-set production model |
| |
综合以上预测结果和ROC曲线显示,Maxent模型和GARP模型对长爪沙鼠鼠疫疫源地动物间疫情潜在风险区域预测精度更高,预测效果更好。
3 讨论综合比较Maxent模型和GARP模型用于预测长爪沙鼠鼠疫疫源地动物间疫情潜在风险,2种模型建模预测结果与现有长爪沙鼠鼠疫疫源地重合率达到85%以上,结果准确可靠。GARP模型预测结果更广泛,预测为有疫情潜在风险区域几乎涵盖了长爪沙鼠鼠疫疫源地,除内蒙古高原长爪沙鼠鼠疫疫源地区域及周边地区预测为鼠疫疫情中高风险区域外,在新疆维吾尔自治区(新疆)北部准噶尔盆地的大片区域也被预测为长爪沙鼠鼠疫高风险区域。Maxent模型预测结果更为精准,更符合实际,中高风险区基本在长爪沙鼠鼠疫疫源地内,只有部分低风险区域分布于长爪沙鼠鼠疫疫源地周边地区和新疆准噶尔盆地的局部区域。GARP模型预测范围远大于Maxent模型预测范围。2种模型均可以根据空间位置信息与气候环境因素建模[9-10],预测物种的空间分布、自然疫源性疾病等的潜在分布范围。在鼠疫等疾病风险评估应用中,可根据实际需求选择模型。
| [1] |
Brotons L, Thuiller W, Araújo MB, et al. Presence-absence versus presence-only modelling methods for predicting bird habitat suitability[J]. Ecography, 2004, 27(4): 437-448. DOI:10.1111/j.0906-7590.2004.03764.x |
| [2] |
俞东征. 鼠疫动物流行病学[M]. 北京: 科学出版社, 2009: 28. Yu DZ. Plague animal epidemiology[M]. Beijing: Science Press, 2009: 28. |
| [3] |
吴淇铭. 6种重要果实蝇的适生区预测和风险分析[D].福州: 福建农林大学, 2014. Wu QM. Prediction of suitable distribution area and risk analysis of six important fruit flies[D]. Fuzhou: Fujian Agriculture and Forestry University, 2014. http://cdmd.cnki.com.cn/Article/CDMD-10389-1014322676.htm |
| [4] |
闫东, 史献明, 杜国义, 等. 利用规则集遗传算法生态位模型预测秃病蚤蒙冀亚种适宜分布[J]. 中国媒介生物学及控制杂志, 2019, 30(1): 43-46. Yan D, Shi XM, Du GY, et al. Prediction of the suitable distribution area for Nosopsyllus laeviceps kuzenkovi by the genetic algorithm for rule-set prediction ecological niche model[J]. Chin J Vector Biol Control, 2019, 30(1): 43-46. DOI:10.11853/j.issn.1003.8280.2019.01.009 |
| [5] |
王袁.基于Maxent模型的神农架川金丝猴不同季节生境识别[D].武汉: 华中农业大学, 2014. Wang Y. The habitat recognition of Rhinopithecus roxellana in Shennongjia based on the Maxent modeling in different seasons[D]. Wuhan: Huazhong Agricultural University, 2014. http://cdmd.cnki.com.cn/article/cdmd-10504-1014231449.htm |
| [6] |
闫东.基于生态位模型预测长爪沙鼠鼠疫动物间疫情的潜在风险[D].北京: 中国疾病预防控制中心, 2016. Yan D. The potential risks of animal plague in Meriones unguiculatus predicted by ecological niche model[D]. Beijing: Chinese Center for Disease Control and Prevention, 2016. http://cdmd.cnki.com.cn/Article/CDMD-84501-1016282251.htm |
| [7] |
陈璐, 孙希华, 林泽民. 基于GARP的大薸潜在适生区预测[J]. 安徽农业科学, 2015, 43(2): 243-245. Chen L, Sun XH, Lin ZM. ARP-based prediction of potential distribution of Pistia stratiotes L. in China[J]. J Anhui Agric Sci, 2015, 43(2): 243-245. DOI:10.3969/j.issn.0517-6611.2015.02.086 |
| [8] |
刘欣.基于GARP和Maxent的空心莲子草在中国的入侵风险预测[D].济南: 山东师范大学, 2012. Liu X. Prediction of the invasion risk for Alternanthera philoxeroides in China based on the GARP and Maxent model[D]. Ji'nan: Shandong Normal University, 2012. http://cdmd.cnki.com.cn/Article/CDMD-10445-1012338499.htm |
| [9] |
Stockwell D. The GARP modelling system:problems and solutions to automated spatial prediction[J]. Int J Geogr Inf Sci, 1999, 13(2): 143-158. DOI:10.1080/136588199241391 |
| [10] |
Holt AC, Salkeld DJ, Fritz CL, et al. Spatial analysis of plague in California:niche modeling predictions of the current distribution and potential response to climate change[J]. Int J Health Geogr, 2009, 8: 38. DOI:10.1186/1476-072x-8-38 |
 2020, Vol. 31

