 2023, Vol. 34
扩展功能
文章信息
- 岳玉娟, 刘小波, 任东升, 殷文武
- YUE Yu-juan, LIU Xiao-bo, REN Dong-sheng, YIN Wen-wu
- 中国大陆2005-2020年登革热流行病学特征分析
- Epidemiological characteristics of dengue fever in Chinese mainland, 2005-2020
- 中国媒介生物学及控制杂志, 2023, 34(6): 761-766, 818
- Chin J Vector Biol & Control, 2023, 34(6): 761-766, 818
- 10.11853/j.issn.1003.8280.2023.06.010
-
文章历史
- 收稿日期: 2023-06-13


2 中国疾病预防控制中心传染病管理处, 北京 102206
2 Division of Infectious Disease Management, Chinese Center for Disease Control and Prevention, Beijing 102206, China
登革热是由埃及伊蚊(Aedes aegypti)和白纹伊蚊(Ae. albopictus)传播登革病毒(Dengue virus,DENV)引起的急性蚊媒传染病,有4种血清型(DENV Ⅰ~Ⅳ),主要分布在东南亚、美洲、西太区、非洲和地中海东部区域的100多个国家[1]。登革热临床表现为发热、头痛、肌肉痛、骨关节痛以及皮疹,实验室特征为白细胞和血小板计数减少以及肝脏转氨酶升高等[2]。在过去50年中,全球登革热的发病率增加了30倍。据估计,每年在100多个流行国家发生的感染人数高达5 000万~1亿例,世界上几乎50%的人口处于登革热感染风险中。登革热无特异的抗病毒治疗方法,但早期发现和获得适当的医疗护理可将死亡率降低到1%以下[3]。
我国登革热仍是由境外输入引起的本地暴发[4]。东南亚国家是我国登革热的主要输入来源。我国1873年最早在厦门出现登革热流行。1940-1945年,我国登革热大流行,此后30多年未发生流行[5]。1978年登革热在中国佛山发生了大规模的流行[6]。1978-2008年,中国大陆共计报告655 324例登革热病例和610例死亡病例,2009-2014年中国大陆共计报告52 749例登革热病例和6例死亡病例[7]。2014和2019年中国大陆经历2次登革热大暴发[8-9]。不同的暴露水平及1次以上流行后造成不同免疫状况,会使不同年龄人群的发病率发生变化,在已形成地方性流行的东南亚病例多发于儿童及新迁入者[10-12]。以往研究多从局部或细节上分析中国登革热的流行特征及地区差异[13-14],本研究采用描述性流行病学方法从整体上分析2005-2020年中国大陆本地和输入性登革热流行病学特征,并分析登革热发病人群年龄是否发生变化。
1 材料与方法 1.1 数据来源本研究收集2005年1月1日-2020年12月31日的中国31个省(自治区、直辖市)(未包括台湾省、香港和澳门特别行政区)的登革热病例报告数据,数据来源于中国疾病预防控制信息系统“传染病监测系统”,包括现住地址地理编码、性别、年龄、职业、发病时间等。
1.2 统计学分析采用Excel 2010软件分析登革热的季节性特征;采用R 4.0.2语言,基于Mann-Kendall趋势检验[15]分别对本地和输入性病例逐年发病年龄中位数趋势进行统计学分析;通过ArcGIS 10.3软件实现病例的地图可视化,并开展空间分析[16]。
2 结果 2.1 本地病例分析 2.1.1 时间分布2005-2020年,共计报告登革热本地病例81 648例。本地登革热年报告病例数呈波浪式上升,2005年无登革热本地病例报告(图 1)。登革热近年有2次本地大暴发,2014年本地病例数为46 033例(占本地病例总数的56.38%),2019年本地病例数15 376例(占本地病例总数的18.83%)。2020年登革热病例大幅度下降,本地病例为616例。

|
| 图 1 2005-2020年中国大陆登革热报告病例数 Figure 1 Numbers of dengue fever cases in Chinese mainland, 2005-2020 |
| |
季节性分析显示,除2019年5月广东省报告6例,其余年份本地病例出现在6-12月,高峰期在8-11月,占本地病例总数的98.26%,其中9和10月病例分别占总本地病例数的41.09%和42.00%。见图 2。

|
| 图 2 2005-2020年中国大陆登革热月报告病例数 Figure 2 Monthly numbers of dengue fever cases in Chinese mainland, 2005-2020 |
| |
2005-2020年,共计14个省(自治区、直辖市)84个市344个区(县)1 639个乡镇报告登革热本地病例,分别占中国大陆省、市、县(区)、乡镇数的45.16%、25.23%、12.10%和4.23%。广东和云南省分别报告60 425和11 217例,分别占本地病例总数的74.01%和13.74%;本地病例数在1 000~3 000例由大到小依次分布在广西、福建、浙江、重庆和江西省(自治区、直辖市),共计9 082例,占本地病例总数的11.12%;其余7个省的本地报告病例数仅占1.13%(图 3)。2017年山东省济宁市嘉祥县报告登革热疫情,为我国登革热本地病例报告的最北区域(35°36′N)。2019年本地登革热空间发生区域最为广泛,分布在13个省(自治区、直辖市)74个市266个县(区)。

|
| 图 3 2005-2020年中国大陆登革热本地病例空间分布 Figure 3 Spatial distribution of indigenous cases of dengue fever in Chinese mainland, 2005-2020 |
| |
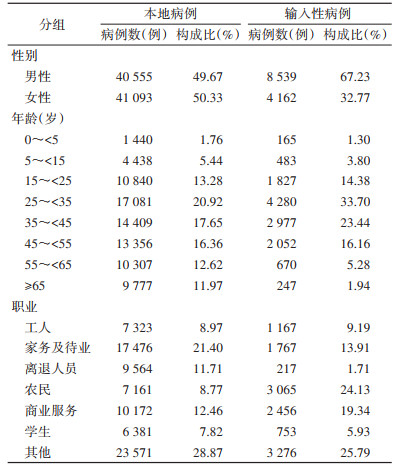
本地病例的男女性别比为0.99∶1。本地病例所有年龄组均有报告。54.93%的病例分布在25~ < 55岁年龄组。25~ < 35岁年龄组报告病例数最多,构成比为20.92%。本地病例数居前3位的职业是家务及待业(21.40%)、商业服务(12.46%)和离退人员(11.71%),占本地总病例数的45.57%。见表 1。
|
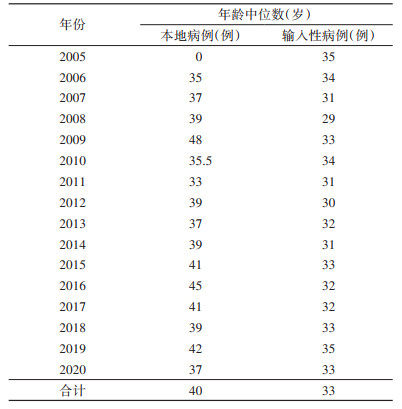
本地病例的中位数年龄为40岁[四分位距(IQR):27~54]。Mann-Kendall趋势检验结果表明,2005-2020年本地病例逐年发病年龄中位数总体趋势无统计学意义(Z=1.510,P=0.131)。见表 2。
|
2005-2020年,共计报告输入性病例12 701例。2005-2019年,登革热输入性病例数明显上升,2019年达到16年来输入性病例数的峰值,为5 813例(占输入性病例总数的45.77%)。2020年登革热病例数大幅度下降,输入性病例为158例。见图 1。
季节性分析显示,全年均有输入性病例报告,集中在6-11月,占输入性病例总数的81.81%,9、10月分别占16.53%(2 100/12 701)和8.89%(2 399/12 701)。见图 2。
2.2.2 空间分布中国大陆除西藏自治区外的30个省(自治区、直辖市)287个市1 402个县(区)4 231个乡镇(街道)报告登革热输入性病例,分别占中国大陆省、市、县(区)、乡镇(街道)数的96.77%、86.19%、49.30%和10.91%。16个省(自治区、直辖市)仅有输入性病例(均在450例以下),占输入性病例总数的8.93%;14个发生登革热本地疫情省(自治区、直辖市)输入性病例数为11 567例,占输入性病例总数的91.07%。输入性病例数居前4位的是云南(4 581例)、广东(2 478例)、福建(1 126例)和浙江省(1 014例),占这14省(自治区、直辖市)输入性病例数的79.53%,占输入性病例总数的72.43%。2019年空间发生区域最为广泛,输入性病例分布在28个省257个市1 090个县(区)。见图 4。

|
| 图 4 2005-2020年中国大陆登革热输入性病例空间分布 Figure 4 Spatial distribution of imported cases of dengue fever in Chinese mainland, 2005-2020 |
| |
输入性病例主要来源于东南亚国家,其中缅甸、柬埔寨、泰国、菲律宾、马来西亚、老挝、越南、印度尼西亚和印度的输入性病例分别为4 159、3 812、882、586、514、393、385、382和309例,占输入性病例总数的89.93%。见图 5。

|
| 图 5 2005-2020年中国大陆登革热输入性病例来源空间分布 Figure 5 Origin distribution of imported cases of dengue fever to Chinese mainland, 2005-2020 |
| |
输入性病例男女性别比为2.05∶1。所有年龄组均有输入性病例报告。73.29%的输入性病例分布在25~ < 55岁年龄组。25~ < 35岁年龄组报告病例数最多,构成比为33.70%。输入性病例数居前3位的职业是农民(24.13%)、商业服务(19.34%)和家务及待业(13.91%),占输入性病例数的57.38%。见表 1。
输入性病例的中位数年龄为33岁(IQR:26~44)。Mann-Kendall趋势检验结果表明,2005-2020年输入性病例逐年发病年龄中位数总体趋势无统计学意义(Z=0.413,P=0.679)。见表 2。
3 讨论2005-2020年中国大陆14个省(自治区、直辖市)报告81 648例本地病例和除西藏外的30个省(自治区、直辖市)报告12 701例输入性病例,本地和输入性病例比为6.43∶1。输入性病例全年各月均有报告,本地病例报告集中于5-12月。
本地病例具有明显的地方性和季节性,多发生于夏秋季,8-11月为高峰季节。病例发生在35°36′N以南的14个省(自治区、直辖市),以在广东(74.01%)和云南省(13.74%)最多。本地登革热疫情的分布与我国登革热传播媒介埃及伊蚊和白纹伊蚊的分布高度相关[17]。我国登革热本地病例无全年连续的病例报告,而多发生在航空口岸城市或者南方边境口岸地区[18],提示登革热未在我国建立持续的地方性流行,而是由输入性病例引起的本地暴发。2020年随着输入性病例数的大幅度下降,我国的登革热本地疫情也得到有效控制,自2013年以来病例报告数最低,更是远低于2014和2019年的大暴发。由于新型冠状病毒感染疫情防控的影响,2020-2022年登革热输入得到了大幅度的遏制,同时登革热本地病例数大幅度下降,共计报告病例1 402例(本地病例1 185例和输入性病例217例)[19]。这也间接证明我国登革热未本地化,仍是由境外输入引起的本地二代传播造成的流行,提示输入性病例的监测和及时发现是控制登革热本地流行极为重要的一环。
我国输入性登革热病例主要来源于东南亚国家[20]。越南、老挝和缅甸的气候适宜伊蚊孳生和繁殖,登革热疫情较为严重,在“一带一路”倡议的大背景下,随着经济贸易、旅游和跨境务工的发展,登革热输入风险较大。历年来,云南省是我国大陆地区除广东省之外登革热疫情最为频发的省份,其登革热输入性病例的主要来源为缅甸等东南亚国家[9, 21-22]。广东省经济发达,人口基数和流动性大,属于亚热带气候,温度和降雨都有利于媒介伊蚊的生长和繁殖,因此登革热本地病例较多[14, 23]。重庆市和江西省的本地病例数也在1 000例以上,主要由2019年登革热聚集性暴发造成[9]。
本地病例和输入性病例的人群特征存在一定的差异。相较本地病例,输入性病例的25~ < 55岁人群构成比高出18.37%,职业更多为农民和商业服务,发病人群年龄中位数更小。究其原因,输入性病例主要为境外务工农民和经商人员,以男性为主。本地病例的男女人数相当,输入性病例数男性是女性的2倍,这与以往研究结论一致[24]。我国1991、1993年和20世纪80年代登革热流行的年龄组百分比构成中,20~ < 50岁的年龄组比例较高[10]。2005年以来我国登革热本地病例25~ < 55岁的年龄组构成比达54.93%;另外相较于形成地方性流行的东南亚登革热病例多发于儿童及新迁入者,本地病例年龄中位数无明显改变,仍处于中青年。
登革热是传播速度较快的蚊媒传染病,容易在人群密集的城市中造成暴发流行,不但危及人的健康安全,也对旅游等经济活动造成破坏,是我国南方地区较为严重的传染病。各地要做好蚊媒和登革热病例的监测,做好风险评估和应急准备。贯彻落实蚊媒可持续控制措施,及时发现输入性病例和输入性病例引起的本地疫情,快速反应,果断处置,将疫情控制在早期状态,避免疫情的大规模暴发与流行。
利益冲突 无
| [1] |
Guzman MG, Harris E. Dengue[J]. Lancet, 2015, 385(9966): 453-465. DOI:10.1016/S0140-6736(14)60572-9 |
| [2] |
张霞意, 张复春, 胡凤玉, 等. 2010年广州登革热患者临床及实验室特征分析[J]. 实用医学杂志, 2011, 27(19): 3480-3482. Zhang XY, Zhang FC, Hu FY, et al. Clinical and laboratory characteristics of dengue fever patients in Guangzhou, 2010[J]. J Pract Med, 2011, 27(19): 3480-3482. DOI:10.3969/j.issn.1006-5725.2011.19.011 |
| [3] |
World Health Organization. Dengue and severe dengue. (2020-01-01) [2023-06-01]. https://www.who.int/health-topics/dengue-and-severe-dengue#tab=tab_1.
|
| [4] |
Sang SW, Chen B, Wu HX, et al. Dengue is still an imported disease in China: A case study in Guangzhou[J]. Infect Genet Evol, 2015, 32: 178-190. DOI:10.1016/j.meegid.2015.03.005 |
| [5] |
方美玉, 赵文忠, 刘建伟. 登革热分子流行病学研究概况[J]. 中华流行病学杂志, 2002, 23(2): 121-123. Fang MY, Zhao WZ, Liu JW. Review of molecular epidemiology of dengue fever[J]. Chin J Epidemiol, 2002, 23(2): 121-123. DOI:10.3760/j.issn:0254-6450.2002.02.020 |
| [6] |
赵治国. 中国登革热控制概述[J]. 中国流行病学杂志, 2000, 21(3): 223-224. Zhao ZG. Overview of dengue fever control in China[J]. Chin J Epidemiol, 2000, 21(3): 223-224. |
| [7] |
Chen B, Liu QY. Dengue fever in China[J]. Lancet, 2015, 385(9978): 1621-1622. DOI:10.1016/S0140-6736(15)60793-0 |
| [8] |
Yue YJ, Sun JM, Liu XB, et al. Spatial analysis of dengue fever and exploration of its environmental and socio-economic risk factors using ordinary least squares: A case study in five districts of Guangzhou city, China, 2014[J]. Int J Infect Dis, 2018, 75: 39-48. DOI:10.1016/j.ijid.2018.07.023 |
| [9] |
Yue YJ, Liu XB, Ren DS, et al. Spatial dynamics of dengue fever in mainland China, 2019[J]. Int J Environ Res Public Health, 2021, 18(6): 2855. DOI:10.3390/ijerph18062855 |
| [10] |
阚飙, 陈化新. 中国登革热的流行及对监测研究的建议[J]. 中国媒介生物学及控制杂志, 1997, 8(2): 152-156. Kan B, Chen HX. Prevalence of dengue fever in China and suggestions for surveillance research[J]. Chin J Vector Biol Control, 1997, 8(2): 152-156. |
| [11] |
Linn NN, Kyaw KWY, Shewade HD, et al. Notified dengue deaths in Myanmar (2017-18): Profile and diagnosis delays[J]. F1000Res, 2020, 9: 579. DOI:10.12688/f1000research.23699.1 |
| [12] |
Huang XY, Ma HX, Wang HF, et al. Outbreak of dengue fever in central China, 2013[J]. Biomed Environ Sci, 2014, 27(11): 894-897. DOI:10.3967/bes2014.125 |
| [13] |
Sun JM, Lu L, Wu HX, et al. Epidemiological trends of dengue in mainland China, 2005-2015[J]. Int J Infect Dis, 2017, 57: 86-91. DOI:10.1016/j.ijid.2017.02.007 |
| [14] |
Yue YJ, Liu QY, Liu XB, et al. Comparative analyses on epidemiological characteristics of dengue fever in Guangdong and Yunnan, China, 2004-2018[J]. BMC Public Health, 2021, 21(1): 1389. DOI:10.1186/s12889-021-11323-5 |
| [15] |
程琮. SPSS统计分析[M]. 北京: 中国统计出版社, 2016: 100-120. Cheng Z. SPSS statistic analysis[M]. Beijing: Chinese Statistic Press, 2016: 100-120. |
| [16] |
ESRI. ArcGIS 10.3 help[M]. California: USA ESRI Press, 2017: 100-110.
|
| [17] |
Yue YJ, Liu QY, Liu XB, et al. Dengue fever in mainland China, 2005-2020: A descriptive analysis of dengue cases and Aedes data[J]. Int J Environ Res Public Health, 2022, 19(7): 3910. DOI:10.3390/ijerph19073910 |
| [18] |
牟笛, 崔金朝, 殷文武, 等. 2015-2018年我国登革热暴发流行病学特征分析[J]. 中华流行病学杂志, 2020, 41(5): 685-689. Mu D, Cui JC, Yin WW, et al. Epidemiological characteristics of dengue fever outbreaks in China, 2015-2018[J]. Chin J Epidemiol, 2020, 41(5): 685-689. DOI:10.3760/cma.j.cn112338-20190715-00523 |
| [19] |
岳玉娟, 刘小波, 郭玉红, 等. 2020-2022年中国登革热时空分布及相关环境因素分析[J]. 环境卫生学杂志, 2023, 13(5): 341-345. Yue YJ, Liu XB, Guo YH, et al. Spatio-temporal distribution and environmental factors of dengue fever in China, 2020-2022[J]. J Environ Hyg, 2023, 13(5): 341-345. DOI:10.13421/j.cnki.hjwsxzz.2023.05.006 |
| [20] |
Yue YJ, Liu XB, Xu M, et al. Epidemiological dynamics of dengue fever in mainland China, 2014-2018[J]. Int J Infect Dis, 2019, 86: 82-93. DOI:10.1016/j.ijid.2019.06.015 |
| [21] |
Zhang FC, Zhao H, Li LH, et al. Severe dengue outbreak in Yunnan, China, 2013[J]. Int J Infect Dis, 2014, 27: 4-6. DOI:10.1016/j.ijid.2014.03.1392 |
| [22] |
魏春, 郭小连, 杨锐, 等. 云南省2013-2020年登革热流行及聚集特征分析[J]. 中国媒介生物学及控制杂志, 2021, 32(6): 720-724, 743. Wei C, Guo XL, Yang R, et al. Epidemiological and cluster characteristics of dengue fever in Yunnan province, China, 2013-2020[J]. Chin J Vector Biol Control, 2021, 32(6): 720-724, 743. DOI:10.11853/j.issn.1003.8280.2021.06.013 |
| [23] |
Guo RN, Lin JY, Li LH, et al. The prevalence and endemic nature of dengue infections in Guangdong, South China: An epidemiological, serological, and etiological study from 2005-2011[J]. PLoS One, 2014, 9(1): e85596. DOI:10.1371/journal.pone.0085596 |
| [24] |
Lai SJ, Huang ZJ, Zhou H, et al. The changing epidemiology of dengue in China, 1990-2014: A descriptive analysis of 25 years of nationwide surveillance data[J]. BMC Med, 2015, 13(1): 100. DOI:10.1186/s12916-015-0336-1 |