 2023, Vol. 34
扩展功能
文章信息
- 刘全超, 朱丁, 邹亚明, 兰策介, 金辉
- LIU Quan-chao, ZHU Ding, ZOU Ya-ming, LAN Ce-jie, JIN Hui
- 江苏省无锡市2012-2021年蚊虫生态学监测结果分析
- An analysis of mosquito ecological surveillance results in Wuxi, Jiangsu Province, China, 2012-2021
- 中国媒介生物学及控制杂志, 2023, 34(4): 513-517
- Chin J Vector Biol & Control, 2023, 34(4): 513-517
- 10.11853/j.issn.1003.8280.2023.04.013
-
文章历史
- 收稿日期: 2023-02-10


2 无锡市疾病预防控制中心消毒与病媒生物防制科, 江苏 无锡 214000
2 Disinfection and Vector Control Department, Wuxi Center for Disease Control and Prevention, Wuxi, Jiangsu 214000, China
蚊虫隶属于昆虫纲(Insecta)双翅目(Diptera)蚊科(Culicidae),是重要的医学昆虫,能够传播疟疾、流行性乙型脑炎(乙脑)、登革热等传染病,全球每年约有7亿人罹患蚊媒传染病[1],严重威胁人类健康。蚊媒传染病的种类与蚊虫种类相关,致倦库蚊(Culex pipiens quinquefasciatus)在北美主要传播西尼罗热[2],斯氏按蚊(Anopheles stephensi)在非洲主要传播疟疾[3],埃及伊蚊(Aedes aegypti)在热带地区主要传播登革热和寨卡病毒病[4];在我国埃及伊蚊和白纹伊蚊(Ae. aegypti)主要传播登革热,雷氏按蚊(An. lesteri)和中华按蚊(An. sinensis)传播疟疾和丝虫病,三带喙库蚊(Cx. tritaeniorhynchus)传播乙脑等[5-7]。蚊媒传染病的流行风险与蚊密度也密切相关,登革热防控时,通过媒介伊蚊密度指标布雷图指数(BI)来评价登革热流行风险[8]。因此监测蚊虫种类和密度变化对蚊媒传染病流行预警具有重要意义。城市化过程中土地利用方式的变化会影响蚊虫种类组成以及密度消长[9],有潜在影响蚊媒传染病流行趋势的可能。江苏省无锡市城市化率较高,2012-2021年常住人口城镇化率为82.90%[10],城镇化已处于相对稳定状态。为了解江苏省无锡市高度城市化状态下蚊虫的演变特征,作者分析了2012-2021年无锡市蚊虫监测数据,以期为无锡市蚊媒传染病流行风险预警提供科学依据。
1 材料与方法 1.1 研究方法2012-2021年,在无锡市居民区、公园、医院、农户、牲畜棚等环境中设置蚊虫监测点,每个环境类型不少于4个监测点。监测方法参照GB/T 23797-2009 《病媒生物密度监测方法蚊虫》中的诱蚊灯法[11]。除牲畜棚外,其他均在外环境中进行,将捕获的蚊虫进行分类、计数。由市级疾病预防控制机构(疾控机构)对下级疾控机构和监测实施单位开展技术培训,对监测工作进行质量抽查和考核,对蚊虫分类鉴定、监测方法、监测工具等进行检查,并提供相应的技术支持。气象数据来源于天气后报网站:www.tianqihoubao.com,收集每日最低气温数值。
1.2 统计学分析分别应用Excel 2016、SPSS 21.0和Adobe Illustrator 2020软件进行数据整理、统计分析、图表修饰。通过蚊虫优势种群[12]、蚊密度(D)、多样性指数(H)、相似性指数(Rjk)分析蚊虫演变特征。采用监测前5日最低均温(Tmin5)分析蚊密度与气温的相关性[13]。
蚊密度是指在某点位蚊虫的密度,本研究采用在监测点位一定时间内使用诱蚊灯法捕获蚊虫数量计算,单位为只/(灯·h),计算公式如下:
|
多样性指数用来估算蚊虫多样性的高低,其包含2个成分:①种数;②各种间个体分配的均匀性。各种之间,个体分配越均匀,多样性指数值就越大,反之,个体分布越集中,多样性指数值越小[14]。计算公式如下:

|
式中,N表示全体物种个数,Pi为第i个种在全体物种中所占比例。
相似性指数用来表示不同生境之间的蚊虫相似程度,一般取值0~1,值越大表示不同生境之间的蚊虫相似性越高[15-16]。计算公式如下:
|
式中,Xij为蚊种i在群落j中的数量;Xik为蚊种i在群落k中的数量。
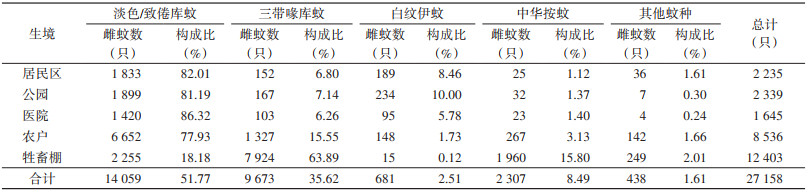
2 结果 2.1 蚊虫构成比共放置诱蚊灯3 777灯次,捕获雌蚊27 158只,其中优势种为淡色/致倦库蚊、三带喙库蚊,占比分别为51.77%、35.62%;常见种为中华按蚊,占比8.49%;偶见种为白纹伊蚊,占比为2.51%。不同环境中的蚊虫种类组成见表 1。
|
近10年来捕获蚊虫平均蚊密度为0.60只/(灯·h),蚊密度从2012年的1.18只/(灯·h)下降到2021年的0.13只/(灯·h),下降率为88.98%(t=1.177,P=0.084)。监测密度最高为2013年的牲畜棚,达到7.22只/(灯·h),最低为2021年的医院,平均为0.02只/(灯·h)。总蚊密度显著下降发生于2014年,从2013年最高点2.02只/(灯·h)下降至2014年的0.47只/(灯·h),降幅达到76.73%(t=1.761,P=0.011),其余相邻年份间变化均不明显,各蚊种及生境蚊密度变化见图 1、2。

|
| 注:白纹伊蚊与其他蚊种密度数值见右侧纵坐标。 图 1 2012-2021年江苏省无锡市不同蚊种密度逐年变化趋势 Figure 1 Yearly changes in densities of different mosquito species in Wuxi, Jiangsu Province, 2012-2021 |
| |

|
| 注:居民区、公园、医院蚊密度数值见右侧纵坐标。 图 2 2012-2021年江苏省无锡市各生境蚊密度逐年变化趋势 Figure 2 Yearly changes in mosquito density in different habitats in Wuxi, Jiangsu Province, 2012-2021 |
| |
无锡市2012-2021年蚊虫总平均密度季节消长呈双峰型,蚊虫活动出现在3-11月,活跃期为5-10月。总密度高点出现在8月,次高点出现在6月。各蚊种及生境平均密度季节消长均呈单峰型,以三带喙库蚊为主的牲畜棚密度高点出现在8月,以淡色/致倦库蚊为主的医院、居民区、农户密度高点出现在6月,中华按蚊以及白纹伊蚊密度高点均出现在8月。见图 3、4。

|
| 注:白纹伊蚊与其他蚊种密度数值见右侧纵坐标。 图 3 2012-2021年江苏省无锡市各蚊种密度逐月变化趋势 Figure 3 Monthly changes in densities of different mosquito species in Wuxi, Jiangsu Province, 2012-2021 |
| |

|
| 注:居民区、公园、医院蚊密度数值见右侧纵坐标。 图 4 2012-2021年江苏省无锡市各生境蚊密度逐月变化趋势 Figure 4 Monthly changes in mosquito density in different habitats in Wuxi, Jiangsu Province, 2012-2021 |
| |
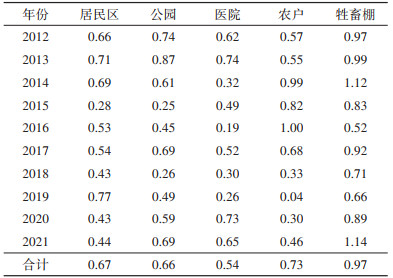
2012-2021年以来,无锡市常规蚊虫监测获取的优势蚊虫总密度平均多样性指数最高的生境为牲畜棚(0.97),之后依次为农户(0.73)、居民区(0.67)、公园(0.66)和医院(0.54)(表 2)。无锡市优势蚊虫的多样性指数波动平稳,经方差分析,不同年间差别无统计学意义(F=1.328,P=0.253);各生境多样性指数比较,经方差分析,差异有统计学意义(F=4.794,P=0.003),经最小显著差异方法(LSD)多重比较,公园、居民区、农户、医院之间多样性指数差异不明显,牲畜棚显著高于其余各生境(均P < 0.05)。见图 5。
|

|
| 图 5 2012-2021江苏省无锡市各生境蚊虫多样性指数比较 Figure 5 Comparison of mosquito diversity index in different habitats of Wuxi, Jiangsu Province, 2012-2021 |
| |
相似性分析显示,除牲畜棚外,各生境之间蚊虫相似度指数均较高,除2014年的农户、2020年的医院以及2021年的医院和公园,其余各生境间的相似度指数均 > 0.90;牲畜棚与其余各生境的相似度指数均较低,除了2014年牲畜棚与农户的相似度指数为0.63,其余均 < 0.45。
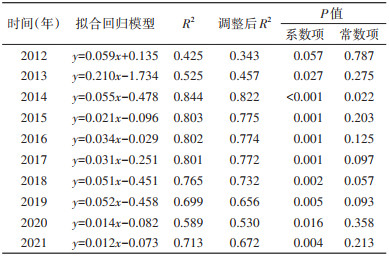
2.5 蚊密度与气温的相关性分析对2012-2021年蚊密度数据与监测前5日最低均温(Tmin5)数据逐年进行线性回归分析,发现除2012年(决定系数R2=0.343,t=2.274,P=0.057)以外,蚊密度与Tmin5呈线性相关(均P < 0.05),R2最低为2013年的0.457,最高为2014年的0.822。见表 3。
|
从蚊虫的生境构成来看,位于郊区农村的农户和牲畜棚的蚊虫数量占比大、多样性指数高,主要包括淡色/致倦库蚊、三带喙库蚊以及中华按蚊;位于城镇的居民区、公园、医院捕获的蚊虫均以淡色/致倦库蚊为主。其中三带喙库蚊和中华按蚊主要集中在牲畜棚,白纹伊蚊则主要分布在公园、居民区、医院等城镇点位,与马桢红等[17]研究结果相似。蚊密度于2013年显著增高出现峰值,是由三带喙库蚊和中华按蚊在2013年8月5日的牲畜棚(猪圈)生境监测中明显增高引起,这可能与当日棚内动物的数量以及当时强高温的天气状况(前5日有降水,当天最高气温40 ℃、最低气温30 ℃)有关。
无锡市蚊虫总平均密度季节消长呈现双峰型,与林敏珍等[18]研究结果相似,与吴海霞等[19]研究结果不同,这可能与无锡本地的梅雨季特征有关,蚊虫的繁殖与活动主要受降雨量、气温、湿度等因素的影响[20],无锡市一般在6月下旬至7月中旬进入梅雨季,频繁的降水影响蚊虫户外活动。无锡市优势蚊虫多样性指数年际波动较为平稳,而各生境的多样性指数结果显示牲畜棚的群落多样性显著高于农户、居民区、医院、公园等生境,可能是由于牲畜棚是室内监测,而其余生境均为户外监测,牲畜棚内环境阴暗潮湿、气流较小,且受气象因素影响不太明显。相似性分析中,农户与公园、居民区、医院等生境相似性较高且多样性指数差异不明显,这可能与无锡市较高的城镇化率有关,且无锡市基本无农户散养牲畜。牲畜棚则与其他环境相似性水平较低,可能是因为监测生境的蚊虫孳生环境不同,三带喙库蚊等喜食动物血主要出现在牲畜棚,而白纹伊蚊等喜食人血的则主要出现在医院、公园等环境。蚊虫密度与气温的相关性较为明显,随着气温的升高,蚊密度也呈现升高的趋势,这与众多研究结果相似[21-22],因此气温可作为蚊媒病预警的潜在风险指标之一。
2012-2021年无锡市蚊虫密度总体呈下降趋势,以淡色/致倦库蚊和三带喙库蚊为优势种,主要分布在郊区农村等区域;白纹伊蚊总体密度水平处于低位,主要集中于公园、医院等建成区,可能与监测方法的局限性有关,诱蚊灯法对白纹伊蚊的引诱效果有限。2019年起白纹伊蚊密度有回升趋势,且集中于农户等农村地区,提示在对淡色/致倦库蚊、三带喙库蚊防制的前提下,需要重视对农村地区白纹伊蚊的防制。
利益冲突 无
| [1] |
Khader SZA, Ahmed SSZ, Venkatesh KP, et al. Larvicidal potential of selected indigenous lichens against three mosquito species- Culex quinquefasciatus, Aedes aegypti and Anopheles stephensi[J]. Chin Herb Med, 2018, 10(2): 152-156. DOI:10.1016/j.chmed.2018.03.002 |
| [2] |
Petersen LR, Brault AC, Nasci RS. West Nile virus: Review of the literature[J]. JAMA, 2013, 310(3): 308-315. DOI:10.1001/jama.2013.8042 |
| [3] |
Talapko J, Škrlec Ⅰ, Alebić T, et al. Malaria: The past and the present[J]. Microorganisms, 2019, 7(6): 179. DOI:10.3390/microorganisms7060179 |
| [4] |
Monteiro FJC, Mourão FRP, Ribeiro ESD, et al. Prevalence of Dengue, Zika and Chikungunya viruses in Aedes (Stegomyia) aegypti (Diptera: Culicidae) in a medium-sized city, Amazon, Brazil[J]. Rev Inst Med Trop Sao Paulo, 2020, 62: e10. DOI:10.1590/S1678-9946202062010 |
| [5] |
边长玲, 龚正达. 我国蚊类及其与蚊媒病关系的研究概况[J]. 中国病原生物学杂志, 2009, 4(7): 545-551. Bian CL, Gong ZD. Mosquitoes and mosquito-borne diseases in China[J]. J Pathog Biol, 2009, 4(7): 545-551. DOI:10.13350/j.cjpb.2009.07.010 |
| [6] |
刘起勇. 新时代媒介生物传染病形势及防控对策[J]. 中国媒介生物学及控制杂志, 2019, 30(1): 1-6, 11. Liu QY. Epidemic profile of vector-borne diseases and vector control strategies in the new era[J]. Chin J Vector Biol Control, 2019, 30(1): 1-6, 11. DOI:10.11853/j.issn.1003.8280.2019.01.001 |
| [7] |
Liu BX, Mehmood K, Nabi F, et al. Mosquito-borne infectious diseases in China, 2019[J]. Travel Med Infect Dis, 2021, 41: 102050. DOI:10.1016/j.tmaid.2021.102050 |
| [8] |
Aryaprema VS, Xue RD. Breteau index as a promising early warning signal for dengue fever outbreaks in the Colombo district, Sri Lanka[J]. Acta Trop, 2019, 199: 105155. DOI:10.1016/j.actatropica.2019.105155 |
| [9] |
沈元, 孙俊, 兰策介, 等. 不同土地利用方式对蚊虫群落的影响[J]. 生态学杂志, 2012, 31(7): 1751-1755. Shen Y, Sun J, Lan CJ, et al. Effects of different land use types on mosquito community[J]. Chin J Ecol, 2012, 31(7): 1751-1755. DOI:10.13292/j.1000-4890.2012.0292 |
| [10] |
无锡市统计局, 国家统计局无锡调查队. 无锡统计年鉴2022[M]. 北京: 中国统计出版社, 2022: 50. Wuxi Bureau of Statistics, Wuxi Investigation Team of the National Bureau of Statistics. Wuxi statistical yearbook, 2022[M]. Beijing: China Statistics Press, 2022: 50. |
| [11] |
郭玉红, 刘京利, 鲁亮, 等. 诱蚊灯法与人工小时法捕蚊效果比较研究[J]. 中国媒介生物学及控制杂志, 2012, 23(6): 529-532. Guo YH, Liu JL, Lu L, et al. Comparative study on mosquito-trapping effects of lamp trapping method and labor hour method[J]. Chin J Vector Biol Control, 2012, 23(6): 529-532. |
| [12] |
Hernández L, Romero AG, Laundré JW, et al. Changes in rodent community structure in the Chihuahuan Desert México: Comparisons between two habitats[J]. J Arid Environ, 2005, 60(2): 239-257. DOI:10.1016/j.jaridenv.2004.03.013 |
| [13] |
孙立明, 阮朝良, 王洪, 等. 法定报告传染病的气象流行病学分析与探讨[J]. 医学综述, 2013, 19(21): 3944-3946. Sun LM, Ruan CL, Wang H, et al. The meteorological epidemiological analysis and discussion of the notifiable infectious diseases[J]. Med Recapitulate, 2013, 19(21): 3944-3946. DOI:10.3969/j.issn.1006-2084.2013.21.036 |
| [14] |
方精云, 沈泽昊, 唐志尧, 等. "中国山地植物物种多样性调查计划"及若干技术规范[J]. 生物多样性, 2004, 12(1): 5-9. Fang JY, Shen ZH, Tang ZY, et al. The protocol for the survey plan for plant species diversity of China's mountains[J]. Biodiversity Sci, 2004, 12(1): 5-9. DOI:10.3321/j.issn:1005-0094.2004.01.002 |
| [15] |
李慧蓉. 生物多样性和生态系统功能研究综述[J]. 生态学杂志, 2004, 23(3): 109-114. Li HR. Review on study of biodiversity and ecosyste mfunctioning[J]. Chin J Ecol, 2004, 23(3): 109-114. |
| [16] |
孙燕群, 段金伟, 陈磊磊, 等. 南京市蚊虫群落结构分析[J]. 预防医学, 2019, 31(10): 1029-1031. Sun YQ, Duan JW, Chen LL, et al. Analysis of mosquito community structure in Nanjing[J]. Prev Med, 2019, 31(10): 1029-1031. DOI:10.19485/j.cnki.issn2096-5087.2019.10.013 |
| [17] |
马桢红, 陈学良, 顾灯安. 江苏省苏州市2011-2015年蚊类群落结构及其分布特征[J]. 中国媒介生物学及控制杂志, 2018, 29(3): 271-273. Ma ZH, Chen XL, Gu DA. Characteristics of community structure and species distribution of mosquitoes in Suzhou city of Jiangsu province, 2011-2015[J]. Chin J Vector Biol Control, 2018, 29(3): 271-273. DOI:10.11853/j.issn.1003.8280.2018.03.013 |
| [18] |
林敏珍, 柯雪梅, 郭志南, 等. 2011-2016年厦门市蚊密度监测分析[J]. 中华卫生杀虫药械, 2019, 25(3): 235-237. Lin MZ, Ke XM, Guo ZN, et al. Analysis on mosquito density in Xiamen from 2011 to 2016[J]. Chin J Hyg Insect Equip, 2019, 25(3): 235-237. DOI:10.19821/j.1671-2781.2019.03.011 |
| [19] |
吴海霞, 鲁亮, 孟凤霞, 等. 2006-2015年我国蚊虫监测报告[J]. 中国媒介生物学及控制杂志, 2017, 28(5): 409-415. Wu HX, Lu L, Meng FX, et al. Reports on national surveillance of mosquitoes in China, 2006-2015[J]. Chin J Vector Biol Control, 2017, 28(5): 409-415. DOI:10.11853/j.issn.1003.8280.2017.05.001 |
| [20] |
仲洁, 何隆华. 气象因素对蚊虫密度影响研究进展[J]. 中国媒介生物学及控制杂志, 2015, 26(1): 95-99. Zhong J, He LH. Advances in research on impacts of meteorological factors on mosquito density[J]. Chin J Vector Biol Control, 2015, 26(1): 95-99. DOI:10.11853/j.issn.1003.4692.2015.01.028 |
| [21] |
刘美德, 姜江, 佟颖, 等. 北京市居民区中蚊虫密度与气象因素关系的研究[J]. 寄生虫与医学昆虫学报, 2021, 28(2): 76-84. Liu MD, Jiang J, Tong Y, et al. Relationship of meteorological factors to mosquito density in residential areas of Beijing[J]. Acta Parasitol Med Entomol Sin, 2021, 28(2): 76-84. DOI:10.3969/j.issn.1005-0507.2021.02.003 |
| [22] |
谢博, 冯磊, 顾盈培, 等. 气候因素对浦东新区蚊虫密度影响的效应分析[J]. 中国媒介生物学及控制杂志, 2019, 30(4): 430-433. Xie B, Feng L, Gu YP, et al. An analysis of the effect of climatic factors on mosquito density in Pudong New Area, Shanghai, China[J]. Chin J Vector Biol Control, 2019, 30(4): 430-433. DOI:10.11853/j.issn.1003.8280.2019.04.017 |