 2022, Vol. 33
扩展功能
文章信息
- 刘汉昭, 于思雨, 冯磊, 刘俊, 林晨, 郝莉鹏
- LIU Han-zhao, YU Si-yu, FENG Lei, LIU Jun, LIN Chen, HAO Li-peng
- 不同类型居住片区中不同白纹伊蚊密度监测指标间的相关性研究
- Correlations between density indices of Aedes albopictus monitored in different types of residential areas
- 中国媒介生物学及控制杂志, 2022, 33(4): 510-515
- Chin J Vector Biol & Control, 2022, 33(4): 510-515
- 10.11853/j.issn.1003.8280.2022.04.013
-
文章历史
- 收稿日期: 2022-02-18


2 复旦大学浦东预防医学研究院, 上海 200136
2 Fudan University Pudong Institute of Preventive Medicine, Shanghai 200136, China
白纹伊蚊(Aedes albopictus)通过叮人吸血传播登革热、黄热病等多种病毒性疾病[1-3]。近10年来,登革热在亚、非、美洲和西太平洋等100多个国家和地区发生流行[4],我国多个省份也相继出现登革热暴发疫情[5-7]。由于登革热缺乏可用疫苗和抗病毒药物,传播媒介监测和控制仍是最有效的预防控制措施[8]。当前,我国白纹伊蚊密度监测存在多种指标,如布雷图指数(BI)、容器指数(CI)、房屋指数(HI)、诱蚊诱卵指数(MOI)等,但各指标之间相关性有待进一步明确[9-10]。本研究针对2019年上海市浦东新区4类居住片区,开展白纹伊蚊密度监测指标的相关性研究,旨在为不同居住片区白纹伊蚊传播疾病的风险评估和有效控制提供科学依据。
1 材料与方法 1.1 调查地点根据浦东新区地域特点和居住类型选取28个居住片区,其中商品房小区6个(市区4个、城乡结合部2个),拆迁房小区8个(城乡结合部4个、郊区4个),农村合作社6个(均在郊区),其他居住片区8个(企业宿舍、建筑工地、城中村、学校宿舍各2个)。
1.2 调查方法参照文献[11],于2019年5-10月调查白纹伊蚊成蚊和幼蚊密度。采用幼蚊吸管法,调查CI和HI;采用诱蚊诱卵器(MOT)法,调查MOI;采用路径法,调查伊蚊路径指数;采用BI法,调查白纹伊蚊幼蚊密度;采用二氧化碳诱蚊灯法,调查白纹伊蚊成蚊密度。相关指标的计算公式如下:

|
式中,MOT为诱蚊诱卵器;路径指数单位为处/km。
1.3 统计学分析利用SPSS 18.0软件对白纹伊蚊相关调查数据进行统计学分析,通过Pearson相关性分析方法对各指标之间的相关性进行分析,相关系数用r表示,检验水准α=0.05(双侧检验)。
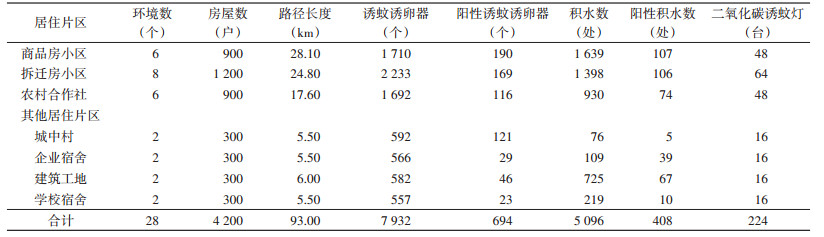
2 结果 2.1 基本情况在上海市浦东新区共调查28个居住片区,监测居民户4 200户,外环境路径长度93.00 km;布放MOT 7 932个,阳性694个;调查中小型积水5 096处,阳性积水408处;布放二氧化碳诱蚊灯224台。见表 1。
|
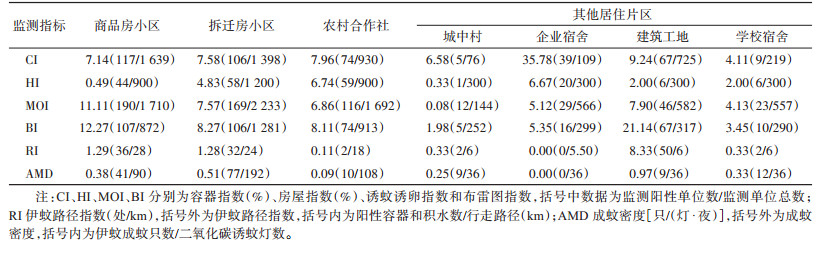
从5-10月的平均水平看,CI最高的居住片区为企业宿舍(35.78%),最低为学校宿舍(4.11%);HI最高为农村合作社(6.74%),最低为城中村(0.33%);MOI最高为商品房小区(11.11),最低为城中村(0.08);BI最高为建筑工地(21.14),最低为城中村(1.98);伊蚊路径指数最高为建筑工地(8.33处/km),最低为企业宿舍(0处/km);白纹伊蚊成蚊密度最高为建筑工地[0.97只/(灯·夜)],最低为企业宿舍[0只/(灯·夜)](表 2)。CI、HI、伊蚊路径指数、白纹伊蚊成蚊密度的峰值主要集中在7和9月,MOI峰值在6和7月,BI在5和9月(图 1)。其中,CI最高峰出现在8月的城中村,HI最高峰出现在7月的商品房小区,MOI最高峰出现在8月的城中村,BI最高峰出现在7月的商品房小区,伊蚊路径指数最高峰出现在5月的建筑工地,白纹伊蚊成蚊密度最高峰出现在7月的拆迁房小区。
|

|
| 图 1 上海市浦东新区不同类型居住片区的白纹伊蚊密度指标随季节变化趋势 Figure 1 Seasonal variation of population density indices of Aedes albopictus in different types of residential areas in Pudong New Area |
| |
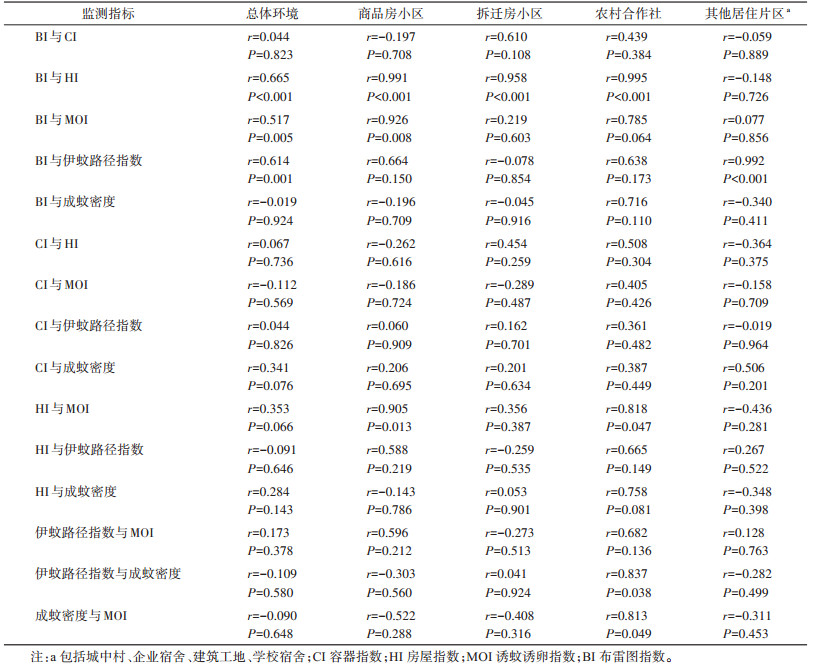
从总体环境的监测指标相关性看,BI与HI、BI与MOI、BI与伊蚊路径指数均呈正相关(r=0.665、0.517、0.614,均P < 0.05),通过回归模型拟合曲线显示亦呈正相关(图 2)。从具体居住片区的监测指标相关性看,商品房小区的BI与HI、BI与MOI、HI与MOI均呈正相关(r=0.991、0.926、0.905,均P < 0.05),拆迁房小区的BI与HI呈正相关(r=0.958,P=0.001);农村合作社的BI与HI、HI与MOI、伊蚊路径指数与成蚊密度、成蚊密度与MOI均呈正相关(r=0.995、0.818、0.837、0.813,均P < 0.05),其他居住片区(城中村、企业宿舍、建筑工地、学校宿舍)的BI与伊蚊路径指数呈正相关(r=0.992,P < 0.001)。见表 3。

|
| 图 2 上海市浦东新区总体环境白纹伊蚊密度监测指标相关性的回归模型拟合曲线 Figure 2 Regression model fitting curves of correlations between population density monitoring indices of Aedes albopictus in the general residential areas in Pudong New Area |
| |
|
研究发现,蚊虫对环境具有高度选择性,即使是同一地区不同环境间亦存在明显差异[12]。比较分析同一区域不同居住片区白纹伊蚊密度监测指标的相关性,选择针对性强、敏感度高的指标评估白纹伊蚊密度风险,既节省监测单位的人力和物力,又能提高监测指标的科学性。
本研究发现,浦东新区4类28个居住片区总体的监测指标中,BI与HI呈正相关,研究结果与Romero-Vivas和Falconar[13]基于Pearson的相关分析发现BI与HI之间呈正相关一致,与黄坤等[14]对我国重点省份媒介伊蚊幼蚊密度指数相关性研究中云南省各监测县BI与HI呈高度正相关的结论一致。从具体的居住片区监测指标相关性看,商品房小区、拆迁房小区、农村合作社的BI与HI亦呈正相关,这也进一步表明,BI与HI相关性较强,因此在商品房小区、拆迁房小区、农村合作社等环境中,建议结合具体情况选择BI和HI中的一种作为常规监测指标,避免重复监测。
总体环境中,BI与伊蚊路径指数呈正相关。其他居住片区(城中村、企业宿舍、建筑工地、学校宿舍)中BI与伊蚊路径指数亦呈正相关关系,而商品房小区、拆迁房小区、农村合作社的BI与伊蚊路径指数均无正相关关系。伊蚊路径指数多用于评估室外环境幼蚊孳生密度,因此在城中村、企业宿舍、建筑工地、学校宿舍等外环境占比较大的区域,建议在BI与伊蚊路径指数中任选1项监测,而商品房小区、拆迁房小区、农村合作社中,可将BI和伊蚊路径指数分开监测和评估。
总体环境的BI与MOI呈正相关,其中商品房小区的BI与MOI亦呈正相关关系,与刘小波等[10]对我国南方重点省份BI和MOI的相关性分析发现,广西壮族自治区和广东省的BI与同期MOI呈正相关的结论趋于一致。但不同居住片区的BI与MOI不一定呈正相关关系,如研究对象中的拆迁房小区、农村合作社和其他居住类型的BI与MOI无相关性,这在国内其他研究中也得到证实,如江毅民等[15]在2007-2014年广州市白纹伊蚊密度相关性研究和茌静等[16]以深圳市某医院休息花园为试验现场对BI和MOI进行Spearman相关分析,结果均显示BI与MOI无正相关关系。媒介伊蚊幼蚊孳生地数量的多少会对MOI产生直接影响[14]。若居住片区存在大量的积水容器,媒介伊蚊产卵的水体多,BI增高,媒介伊蚊选择MOT产卵的概率就会降低,MOI降低。因此,建议商品房小区中不必同时开展BI与MOI监测,拆迁房小区、农村合作社和其他居住类型以互为补充的形式选择BI和MOI监测指标。
本研究分析的6类监测指标均受到不同地点和时间的自然及社会等诸多因素的影响,研究本身仍然存在一定的局限性。总之,针对不同居住片区的特点,合理选择监测方法,才能更好地对区域媒介伊蚊的风险进行科学预警。
利益冲突 无
| [1] |
王丕玉, 周红宁. 白纹伊蚊(Aedes albopictus)实验室饲养研究[J]. 医学动物防制, 2002, 18(9): 497-498. Wang PY, Zhou HN. Studies on the rearing of Aedes albopictus at laboratory[J]. Chin J Pest Control, 2002, 18(9): 497-498. |
| [2] |
江毅民, 严子锵. 我国亚热带地区登革热发生机制[J]. 中国媒介生物学及控制杂志, 2008, 19(1): 80-81. Jiang YM, Yan ZQ. Occurrence mechanism of dengue fever in subtropical areas of China[J]. Chin J Vector Biol Control, 2008, 19(1): 80-81. DOI:10.3969/j.issn.1003-4692.2008.01.038 |
| [3] |
杨舒然, 刘起勇. 白纹伊蚊的全球分布及扩散趋势[J]. 中国媒介生物学及控制杂志, 2013, 24(1): 1-4. Yang SR, Liu QY. Trend in global distribution and spread of Aedes albopictus[J]. Chin J Vector Biol Control, 2013, 24(1): 1-4. |
| [4] |
Grard G, Caron M, Mombo IM, et al. Zika virus in Gabon (Central Africa)-2007:A new threat from Aedes albopictus[J]. PLoS Negl Trop Dis, 2014, 8(2): e2681. DOI:10.1371/journal.pntd.0002681 |
| [5] |
文艳苹, 汪皓秋, 于新芬, 等. 2018年杭州市登革热流行病学及病原特征研究[J]. 中华微生物学和免疫学杂志, 2021, 41(2): 119-125. Wen YP, Wang HQ, Yu XF, et al. Epidemiological and etiological characteristics of dengue fever in Hangzhou in 2018[J]. Chin J Microbiol Immunol, 2021, 41(2): 119-125. DOI:10.3760/cma.j.cn112309-20200914-00430 |
| [6] |
罗超, 陈琼, 谭仕碧, 等. 重庆市万州区2019年登革热暴发疫情流行特征及相关因素[J]. 中国热带医学, 2021, 21(7): 654-657, 662. Luo C, Chen Q, Tan SB, et al. Epidemic characteristics and influential factors of dengue fever in Wanzhou, Chongqing, 2019[J]. China Trop Med, 2021, 21(7): 654-657, 662. DOI:10.13604/j.cnki.46-1064/r.2021.07.08 |
| [7] |
蒋力云, 刘远, 苏文哲, 等. 广州市2019年登革热确诊病例空间聚集性及登革病毒E基因进化特征分析[J]. 中华流行病学杂志, 2021, 42(5): 878-885. Jiang LY, Liu Y, Su WZ, et al. Spatial autocorrelation of dengue cases and molecular biological characteristics of envelope gene of dengue virus in Guangzhou, 2019[J]. Chin J Epidemiol, 2021, 42(5): 878-885. DOI:10.3760/cma.j.cn112338-20201015-01238 |
| [8] |
孟凤霞, 王义冠, 冯磊, 等. 我国登革热疫情防控与媒介伊蚊的综合治理[J]. 中国媒介生物学及控制杂志, 2015, 26(1): 4-10. Meng FX, Wang YG, Feng L, et al. Review on dengue prevention and control and integrated mosquito management in China[J]. Chin J Vector Biol Control, 2015, 26(1): 4-10. DOI:10.11853/j.issn.1003.4692.2015.01.002 |
| [9] |
刘小波, 郭玉红, 吴海霞, 等. 2015-2017年我国媒介伊蚊幼蚊监测结果分析[J]. 中国媒介生物学及控制杂志, 2018, 29(4): 325-330. Liu XB, Guo YH, Wu HX, et al. National surveillance on larval Aedes mosquito in China, 2015-2017[J]. Chin J Vector Biol Control, 2018, 29(4): 325-330. DOI:10.11853/j.issn.1003.8280.2018.04.001 |
| [10] |
刘小波, 吴海霞, 郭玉红, 等. 2016年中国媒介伊蚊密度监测结果分析[J]. 疾病监测, 2018, 33(2): 144-149. Liu XB, Wu HX, Guo YH, et al. Surveillance on the density of Aedes mosquitoes in China, 2016[J]. Dis Surveill, 2018, 33(2): 144-149. DOI:10.3784/j.issn.1003-9961.2018.02.008 |
| [11] |
中华人民共和国国家质量监督检验检疫总局, 中国国家标准化管理委员会. GB/T 23797-2009病媒生物密度监测方法蚊虫[S]. 北京: 中国标准出版社, 2009. General Administration of Quality Supervision, Inspection and Quarantine of the People's Republic of China, Standardization Administration of China. GB/T 23797-2009 Surveillance methods for vector density-Mosquito[S]. Beijing: China Standard Press, 2009. |
| [12] |
高强, 周毅彬, 曹晖, 等. 住区与绿地环境成蚊侵害状况及公共卫生影响分析[J]. 中华卫生杀虫药械, 2016, 22(1): 40-45. Gao Q, Zhou YB, Cao H, et al. Status and public health impact of mosquito infestation in residential and green areas in Shanghai downtown[J]. Chin J Hyg Insect Equip, 2016, 22(1): 40-45. DOI:10.19821/j.1671-2781.2016.01.013 |
| [13] |
Romero-Vivas CME, Falconar AKI. Investigation of relationships between Aedes aegypti egg, larvae, pupae, and adult density indices where their main breeding sites were located indoors[J]. J Am Mosq Control Assoc, 2005, 21(1): 15-21. DOI:10.2987/8756-971X(2005)21[15:IORBAA]2.0.CO;2 |
| [14] |
黄坤, 郭玉红, 吴海霞, 等. 我国重点省份媒介伊蚊幼蚊密度指数相关性研究[J]. 中国媒介生物学及控制杂志, 2019, 30(4): 395-399. Huang K, Guo YH, Wu HX, et al. A study of the correlation between density indices of Aedes vector larvae in key provinces of China[J]. Chin J Vector Biol Control, 2019, 30(4): 395-399. DOI:10.11853/j.issn.1003.8280.2019.04.009 |
| [15] |
江毅民, 严子锵, 胡志刚, 等. 诱蚊诱卵指数作为蚊虫密度监测指标适用性的探讨[J]. 热带医学杂志, 2015, 15(11): 1555-1557. Jiang YM, Yan ZQ, Hu ZG, et al. Applicability of MOI as a density index in surveillance of mosquitoes[J]. J Tropic Med, 2015, 15(11): 1555-1557. DOI:10.3969/j.issn.1672-3619.2015.11.031 |
| [16] |
茌静, 古文媚, 陈戊申, 等. 3种媒介伊蚊监测方法在登革热疫点中的应用及相关性研究[J]. 中国媒介生物学及控制杂志, 2015, 26(5): 495-497, 508. Chi J, Gu WM, Chen WS, et al. Application and correlation of three vector Aedes monitoring methods in dengue epidemic spots[J]. Chin J Vector Biol Control, 2015, 26(5): 495-497, 508. DOI:10.11853/j.issn.1003.4692.2015.05.016 |