 2021, Vol. 32
扩展功能
文章信息
- 孙钦同, 韩英男, 刘言, 赖世宏, 王学军, 康殿民
- SUN Qin-tong, HAN Ying-nan, LIU Yan, LAI Shi-hong, WANG Xue-jun, KANG Dian-min
- 应用自回归移动平均(ARIMA)模型预测山东省鼠密度趋势
- Application of autoregressive integrated moving average model in predicting the trend of rodent density in Shandong province, China
- 中国媒介生物学及控制杂志, 2021, 32(6): 744-748
- Chin J Vector Biol & Control, 2021, 32(6): 744-748
- 10.11853/j.issn.1003.8280.2021.06.018
-
文章历史
- 收稿日期: 2021-05-12


鼠类能携带细菌、病毒、寄生虫等多种病原体,可传播鼠疫、肾综合征出血热(HFRS)等疾病,是多种疾病的传播媒介[1]。鼠密度是单位面积或空间内监测到的鼠类数量或活动量,鼠密度监测是鼠类防制的基础性工作,是制订鼠类防制措施和评价防制效果的依据。自回归移动平均(autoregressive integrated moving average,ARIMA)模型是一种时间序列分析研究方法,可以分析一组随时间变化而互相关联的动态数据,对有季节效应的序列进行建模,其中乘积季节模型可以提取出时间序列的季节效应、长期趋势和随机效应的相互影响[2]。本研究利用2010—2018年山东省鼠密度监测数据,构建基于R 3.6.2软件的ARIMA乘积季节模型,筛选最优模型对2019年山东省鼠密度进行预测、检验,为科学防制鼠传疾病提供参考依据。
1 材料与方法 1.1 资料来源整理汇总2010—2019年山东省国家级病媒生物监测点(济南、青岛和聊城市)的监测数据。按照《全国病媒生物监测方案(试行)》[3]《全国病媒生物监测方案》(国卫办疾控函〔2016〕215号)[4]和《山东省病媒生物监测实施方案》,采用夹(笼)夜法进行监测。因2016年《全国病媒生物监测方案》鼠密度监测频率变更,在每年的奇数月开展鼠密度监测,故本研究采用奇数月监测数据用于建模。ARIMA模型拟合采用2010年1月至2018年11月鼠密度监测数据,2019年1—11月鼠密度监测数据用于ARIMA模型检验。
1.2 研究方法使用Excel 2007软件录入2010—2019年山东省国家级监测点鼠密度监测数据,使用R 3.6.2软件分析鼠类季节变化趋势,采用ARIMA模型进行建模与预测,检验水准α=0.05。
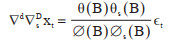
ARIMA乘积季节模型是一种时间序列预测方法,其基本思想是将随着时间推移而形成的数列视为随机序列,应用数学模型进行描述,从而根据既往序列值来预测未来值[5]。该模型主要应用于拟合本身具有平稳性或经差分处理或对数转换后具有平稳性的时间序列。平稳时间序列中,序列的性质不会随时间的推移而发生改变,且对任意的滞后阶数,序列的自相关性也不会发生改变[6]。其表达式如下[5]:
|
其中: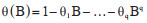
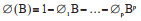
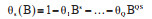

ARIMA模型有多种形式,其中ARIMA(p,d,q)(P,D,Q)s能够将时间序列中季节性和非季节性因素相结合,p、d、q分别是自回归的阶数、差分的阶数和移动平均的阶数;P、D、Q分别是季节自回归的阶数、季节差分的阶数和季节移动平均的阶数,s代表季节的周期。
1.3 ARIMA建模基本步骤 1.3.1 序列平稳化时间序列具有平稳性是ARIMA建模的前提条件,而非平稳序列采用差分或数据变换使数据平稳,可通过单位根(augmented Dickey-Fuller,ADF)检验来验证序列平稳性。
1.3.2 模型的识别、创建p和q值的估计是根据序列自相关函数(autocorrelation function,ACF)图和偏自相关函数(partial autocorrelation function,PACF)图的截尾或拖尾情况来确定,参数P和Q一般采用低阶到高阶逐步尝试[7]。
1.3.3 参数估计模型参数的估计和假设检验。
1.3.4 模型诊断根据模型的残差序列是否为白噪声序列,判断所建立的模型是否合适。
1.3.5 模型预测应用对2010年1月至2018年11月鼠类监测数据进行最优ARIMA模型拟合,预测2019年1—11月监测月份的鼠类密度,根据2019年实际监测数据评估预测效果。
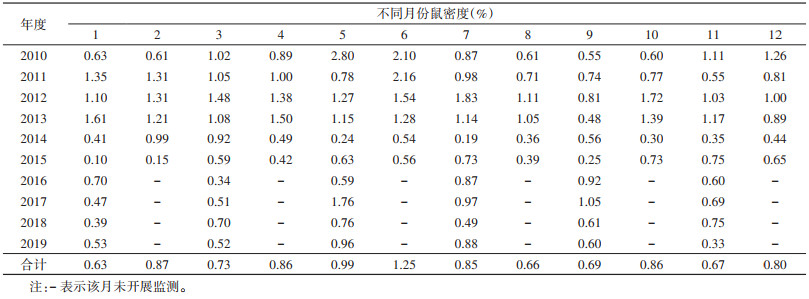
2 结果 2.1 山东省2010—2019年鼠种构成比及季节消长趋势共捕获鼠类1 496只,鼠密度为0.80%,以褐家鼠(Rattus norvegicus)和小家鼠(Mus musculus)为主要鼠种,构成比分别为49.53%和40.64%,鼠密度分别为0.40%和0.32%。总体来看,山东省鼠密度1年中有2个高峰,分别在5和7月。见表 1。
|
将2010—2018年山东省国家级监测点鼠密度绘制成时间序列图,可以看出鼠密度存在一定的趋势性和季节性,属非平稳序列(图 1)。应用R 3.6.2软件diff()函数对原始数据进行1阶6步季节差分,以消除时间序列趋势性和季节影响(图 2)。经adf.test()函数进行ADF检验,P=0.015,差分后数据满足平稳性要求。

|
| 图 1 山东省2010年1月至2018年11月鼠密度时间序列图 Figure 1 Time series diagram of rodent density in Shandong province from January 2010 to November 2018 |
| |

|
| 图 2 经1阶非季节性差分和1阶季节性差分后的鼠密度序列图 Figure 2 Sequence diagram of rodent density after first-order non-seasonal difference and first-order seasonal difference |
| |
原始序列经过一阶季节性及非季节性差分,d和D=1,初步得出ARIMA(p,1,q)(P,1,Q)6模型,这里6表示以6个月为1个周期,对差分后的序列分别做ACF(图 3)和PACF(图 4)图。

|
| 图 3 经差分后的自回归图 Figure 3 Autoregressive diagram after difference |
| |

|
| 图 4 经差分后的偏自回归图 Figure 4 Partial autoregressive diagram after difference |
| |
ARIMA模型中参数的确定主要根据ACF图和PACF图的截尾或拖尾的情况,并结合赤迟信息量准则(Akaike information criterion,AIC)值和标准化贝叶斯信息准则(Bayesian information criterion,BIC)值。自相关图表明,在1阶后落入置信区间,q=1,而偏自相关图表明拖尾,p=0。根据差分次数和数据的周期性,初步判断模型为ARIMA(0,1,1)(P,1,Q)6。从周期上看,PACF逐渐减为0,ACF在1阶后减为0,Q=1,且结合相关文献研究,P和Q取值通常不超过2,可采用低阶到高阶的顺序进行多次调试[6-8]。根据以上信息,对模型检验结果进行了调试,最终确定了3个备选模型(表 2)。根据模型的AIC和BIC值均最小为最佳模型。

采用Ljung-Box检验可判断模型的残差序列是否为白噪声,若P > 0.05,则显示模型的残差为白噪声。结果显示,3个备选模型的残差均为白噪声。其中ARIMA(0,1,1)(0,1,1)6模型AIC和BIC值最小。参数估计值和白噪声检验结果见表 2。
2.2.5 模型预测和效果评估根据拟合的最优模型,对2019年山东省国家级监测点鼠密度进行预测,结果显示,2019年监测的鼠密度实测值均在预测值的95%置信区间(confidence interval,CI)范围内,该模型预测的鼠密度与实际监测情况基本一致。见图 5、表 3。

|
| 图 5 2010—2019年山东省鼠密度实际值与模型预测值分布 Figure 5 Distribution of the observed and predicted values of rodent density in Shandong province, 2010-2019 |
| |

|
时间序列是通过利用研究对象产生的随时间变化的历史数据而得出的规律,是一种预测未来值的统计方法。ARIMA乘积季节模型能够较好地将时间序列的趋势性与随机效应相结合,现已成功地运用于疾病和病媒生物密度的预测[6-13]。
鼠类是鼠疫耶尔森菌、HFRS汉城型汉坦病毒的主要宿主,是已知的多种疾病的重要传播媒介[8]。2010—2019年山东省国家级监测点鼠类密度监测显示,捕获的主要鼠种是褐家鼠和小家鼠,两者占比达89.52%,其他为黑线姬鼠(Apodemus agrarius)和黄胸鼠(R. tanezumi),占比较低,与其他省份研究结果类似[14-15]。2016年由于原国家卫生和计划生育委员会印发新版《全国病媒生物监测方案》[4],降低了鼠类监测频率,故选择2010—2019年单数月的鼠密度监测数据,可以避免2016年以后因未开展监测带来的数据缺失问题。基于本研究数据,拟合出了ARIMA(0,1,1)(0,1,1)6乘积季节模型,通过该模型预测出2019年鼠密度监测数据,预测值均落入95%CI,且真实值与预测值的相对误差在0.04~0.73。通过对鼠密度监测数据的季节性趋势研究发现,鼠密度具有明显的周期性和趋势性,因此通过ARIMA模型可以很好地对山东省2010—2018年鼠密度监测数据进行拟合分析,2019年的预测值与监测值拟合较好,可用于对鼠密度监测数据的短期预测和动态分析。时间序列预测模型与病媒生物监测信息系统相结合,提高了监测效率和质量,为传染病防控工作提供了有力支持[8]。
在鼠类早期预测预警中,可将鼠密度预测值的95%预警区间设为警戒线,当实测鼠密度明显超出警戒线时,应警惕鼠传疾病的暴发,及时开展灭鼠措施。还可将鼠类防制工作后的监测数据与预测数据进行比较,用于评价防制效果[12]。
在传染病疫情的预测中,模型的预测能力往往受制于传染病防控策略和自然条件[11],具体到本研究,鼠密度易受人类活动、气候和环境等因素影响,如每年4月开展爱国卫生运动,因此我们要根据实际情况,不断积累经验,对模型不断完善和修正,以适应实际情况[16]。
志谢 本次研究工作得到山东省各有关市疾病预防控制中心病媒生物控制同仁的大力支持,特此志谢利益冲突 无
| [1] |
Meerburg BG, Singleton GR, Kijlstra A. Rodent-borne diseases and their risks for public health[J]. Crit Rev Microbiol, 2009, 35(3): 221-270. DOI:10.1080/10408410902989837 |
| [2] |
Li Q, Guo NN, Han ZY, et al. Application of an autoregressive integrated moving average model for predicting the incidence of hemorrhagic fever with renal syndrome[J]. Am J Trop Med Hyg, 2012, 87(2): 364-370. DOI:10.4269/ajtmh.2012.11-0472 |
| [3] |
中华人民共和国卫生部. 全国病媒生物监测方案(试行)[Z]. 北京: 中国疾病预防控制中心, 2005. Ministry of Health of the People's Republic of China. National vector surveillance program (Trial)[Z]. Beijing: Chinese Center for Disease Control and Prevention, 2005. |
| [4] |
中华人民共和国卫生和计划生育委员会. 全国病媒生物监测方案[Z]. 北京: 中国疾病预防控制中心, 2016. The People's Republic of China Health and Family Planning Commission. National vector surveillance program[Z]. Beijing: Chinese Center for Disease Control and Prevention, 2016. |
| [5] |
王燕. 应用时间序列分析[M]. 北京: 中国人民大学出版社, 2015: 83-106. Wang Y. Applying time series analysis[M]. Beijing: Renmin University of China Press, 2015: 83-106. |
| [6] |
田庆, 刘永鹏, 张晶晶, 等. ARIMA乘积季节模型在山东省肺结核发病预测中的应用[J]. 山东大学学报(医学版), 2021, 59(7): 112-118. Tian Q, Liu YP, Zhang JJ, et al. Application of ARIMA multiplicative seasonal model in the prediction of pulmonary tuberculosis incidence in Shandong province[J]. J Shandong Univ(Health Sci), 2021, 59(7): 112-118. DOI:10.6040/j.issn.1671-7554.0.2021.0049 |
| [7] |
言晨绮, 王瑞白, 刘海灿, 等. ARIMA模型预测2018-2019年我国肺结核发病趋势的应用[J]. 中华流行病学杂志, 2019, 40(6): 633-637. Yan CQ, Wang RB, Liu HC, et al. Application of ARIMA model in predicting the incidence of tuberculosis in China from 2018 to 2019[J]. Chin J Epid, 2019, 40(6): 633-637. DOI:10.3760/cma.j.issn.0254-6450.2019.06.006 |
| [8] |
高文, 黄钢, 马丽华, 等. 差分自回归移动平均模型在河北省鼠密度监测信息系统中的应用研究[J]. 中国媒介生物学及控制杂志, 2017, 28(3): 265-268. Gao W, Huang G, Ma LH, et al. Application of autoregressive integrated moving average (ARIMA) model in information system for rodent surveillance in Hebei province[J]. Chin J Vector Biol Control, 2017, 28(3): 265-268. DOI:10.11853/j.issn.1003.8280.2017.03.018 |
| [9] |
王永斌, 郑瑶, 柴峰, 等. 基于周期分解的ARIMA模型在甲肝发病率预测中的应用[J]. 现代预防医学, 2015, 42(23): 4225-4229. Wang YB, Zheng Y, Chai F, et al. Application of ARIMA model based on seasonal decomposition in prediction on incidence of Hepatitis A, China[J]. Mod Prev Med, 2015, 42(23): 4225-4229. |
| [10] |
运玲, 王福才, 张秋芬, 等. ARIMA模型在德国小蠊密度季节消长预测中应用及抗药性[J]. 中国公共卫生, 2020, 36(3): 410-415. Yun L, Wang FC, Zhang QF, et al. Prediction of seasonal density fluctuation with autoregressive integrated moving average model and determination of pesticide resistance in Blattella germanica[J]. Chin J Public Health, 2020, 36(3): 410-415. DOI:10.11847/zgggws1124086 |
| [11] |
傅伟杰, 谢昀, 曾志笠, 等. 三种模型在江西省流感样病例预测中的应用与比较[J]. 中华疾病控制杂志, 2019, 23(1): 101-105. Fu WJ, Xie Y, Zeng ZL, et al. Application and comparison of three models for the prediction of influenza-like illness in Jiangxi province[J]. Chin J Dis Control, 2019, 23(1): 101-105. DOI:10.16462/j.cnki.zhjbkz.2019.01.021 |
| [12] |
肖珊, 陈立章, 龙建勋, 等. 基于R语言自回归积分移动平均模型在长沙市三带喙库蚊密度预测中的应用[J]. 医学动物防制, 2020, 36(3): 278-281. Xiao S, Chen LZ, Long JX, et al. Application of R-based autoregressive integrated moving average model in the prediction of Culex tritaeniorhynchus density in Changsha city[J]. J Med Pest Control, 2020, 36(3): 278-281. DOI:10.7629/yxdwfz202003021 |
| [13] |
潘欢弘, 朱蒙曼, 刘晓青. ARIMA乘积季节模型在江西省手足口病发病预测中的应用[J]. 现代预防医学, 2018, 45(1): 1-4, 7. Pan HH, Zhu MM, Liu XQ. Application of ARIMA product seasonal model in the incidence prediction of hand, foot and mouth disease, Jiangxi[J]. Mod Prev Med, 2018, 45(1): 1-4, 7. |
| [14] |
张家勇, 丁俊, 白玉银, 等. 辽宁省2006-2015年鼠类密度及种群结构分析[J]. 中国媒介生物学及控制杂志, 2017, 28(1): 51-55. Zhang JY, Ding J, Bai YY, et al. Analysis of rodent density and population structure in Liaoning province from 2006 to 2015[J]. Chin J Vector Biol Control, 2017, 28(1): 51-55. DOI:10.11853/j.issn.1003.8280.2017.01.014 |
| [15] |
吴瑜燕, 龚震宇, 侯娟, 等. 浙江省2011-2013年病媒生物监测结果分析[J]. 中国媒介生物学及控制杂志, 2015, 26(4): 394-397. Wu YY, Gong ZY, Hou J, et al. Analysis of vector surveillance from 2011 to 2013 in Zhejiang province, China[J]. Chin J Vector Biol Control, 2015, 26(4): 394-397. DOI:10.11853/j.issn.1003.4692.2015.04.017 |
| [16] |
桂腾叶, 陈硕, 隗立志, 等. 基于ARIMA的传染病流行趋势预测及防治对策[J]. 电子科技, 2015, 28(12): 48-51. Gui TY, Chen S, Kui LZ, et al. Prediction and countermeasures of infectious diseases based on ARIMA[J]. Electron Sci Tech, 2015, 28(12): 48-51. DOI:10.16180/j.cnki.issn1007-7820.2015.12.013 |