地壳和地幔中的固体岩石具有显著的黏弹性性质,即在低温和快速变化的载荷作用下变形由可逆的弹性应变占主导,而在高温和缓慢变化的载荷作用下变形以不可逆的黏性流动为主。
弹性岩石圈的定义以及弹性岩石圈厚度的确定是地球动力学研究的中心课题。事实上,弹性岩石圈并没有一个截然的下界面。弹性岩石圈的一种定义方法是借助于岩石的黏弹性松弛时间(黏度与弹性模量之比)。如定义弹性岩石圈内松弛时间大于一千万年[1],相当于干橄榄石温度低于675 ℃、湿橄榄石温度低于475 ℃。考虑到一般以1 300 ℃等温线定义热岩石圈与软流圈界面[1],弹性岩石圈应看作是热岩石圈的一个组成部分。为论述方便起见,下文中一律将弹性岩石圈以下的热岩石圈部分称作黏性岩石圈。显然,整个热岩石圈都具有黏弹性性质(虽然在弹性岩石圈中以弹性变形为主,而在黏性岩石圈中以黏性变形为主),且弹性岩石圈向黏性岩石圈的过渡是主要由温度连续变化导致的渐变而非突变。根据松弛时间定义的弹性岩石圈厚度在原理上无懈可击,但由于地下岩石的黏度无法精确测量,并不能实际应用于具体区域的弹性岩石圈厚度确定。
在地球动力学研究中,弹性岩石圈厚度通常由弹性板弯曲分析反推,即通过以弹性薄板在静岩恢复力(浮力)作用下弯曲的解析解[1]拟合实测岩石圈弯曲导致的地形(如岛链、海沟的外缘隆起位置)来反演岩石圈的抗弯刚度进而确定弹性岩石圈等效厚度。这样得到的弹性岩石圈厚度与根据松弛时间定义的弹性岩石圈厚度是否一致并没有经过严格的检验。
严格来说,弹性岩石圈的厚度应当是载荷作用时间的函数。在地震波传播的时间尺度上,整个地壳和地幔都表现出弹性性质,而在地质时间尺度上,弹性变形只在近地表的弹性岩石圈内占主导,黏性流动则主导弹性岩石圈以下地幔岩石的变形(如地幔对流)。岩石圈对各种不同时间尺度载荷的响应可以反映相应时间尺度下的弹性岩石圈厚度。如对震后变形[2-7]、冰后回弹[8-10]、俯冲过程[11-14]和岩石圈弯曲[15-19]等问题的黏弹性模拟可以约束相应载荷作用时间下的弹性岩石圈厚度。
描述岩石圈弯曲的物理模型经历了从简单到复杂的过程。单层弹性薄板加无黏流体地基的模型[20-28]是描述岩石圈弯曲变形最简单且应用最广泛的模型。通过对比模型预测和火山、沉积物等载荷作用下地表形态的实际观测数据,可以研究弹性岩石圈厚度与板块年龄及载荷作用时间的依赖关系[29-31]。基于这种模型,Watts等[32]曾通过海底地形反演计算全球范围内9 758处弹性岩石圈的厚度。
为克服弹性板弯曲模型结果与时间无关的缺陷,之后又发展出了均匀黏度黏弹性薄板模型[33-36]。Walcott[33]采用均匀黏度黏弹性薄板模型研究大洋和大陆岩石圈的弹性厚度; Lambeck和Nakiboglu[37]给出多层弹性板、均匀黏度黏弹性板以及弹性层叠加黏弹性层模型的解析解,并计算海洋岩石圈的有效弯曲刚度。为了更好地反映黏度随深度的变化,文献[18, 38]采用多层黏弹性模型,并解释弹性厚度大范围变化的观测数据。
除解析方法外,数值模拟方法也越来越多地应用于岩石圈弯曲问题研究。如,Zhong等[10]采用三维球坐标有限元模型研究不可压缩地球介质在自重作用下的冰后回弹问题;Zhong和Watts[17]采用三维直角坐标有限元模型计算岩石圈在表面载荷作用下的黏弹性变形和应力,其中考虑了复杂的非线性黏弹性流变效应,但同样假设材料为不可压缩的,与地震波速给出的岩石圈泊松比远低于0.5的观测事实明显不符。
本文采用黏度随深度连续变化的黏弹性本构模型统一描述弹性岩石圈与黏性岩石圈,并建立有限元模型求解在表面垂向载荷(对海山或岛链载荷等的一般化处理)作用下的岩石圈弯曲问题。利用经典弹性板弯曲解析解,我们将本研究黏弹性模拟计算得到的外缘隆起位置随载荷作用时间的变化转换成弹性岩石圈厚度随时间的变化,并与由松弛时间定义的弹性岩石圈厚度随时间的变化进行定量对比。因此,本研究不但实现了弹性岩石圈向黏性岩石圈的逐渐自然过渡,而且能够对弹性岩石圈两种传统定义(即松弛时间定义和弹性板弯曲定义)的一致性加以严格检验。
1 弹性岩石圈的两种传统定义及其联系弹性岩石圈的传统定义包括弹性板弯曲定义和松弛时间定义两种[1]。
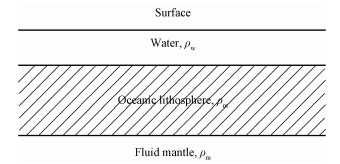
在弹性板弯曲定义中,将弹性岩石圈之下的地幔介质近似为应力完全松弛因而处于静水压状态的流体,而弹性岩石圈由弹性薄板近似,如图 1所示[1]。
|
Download:
|
| 图 1 大洋岩石圈受外载荷作用而发生弯曲 Fig. 1 The oceanic lithosphere deflected by an applied load | |
依据弹性薄板弯曲理论,利用实测岩石圈在表面载荷作用下发生弯曲导致的地形(如岛链、海沟的外缘隆起位置)能够反演岩石圈的抗弯刚度进而确定弹性岩石圈等效厚度[39]。有效弹性厚度Te与薄板抗弯刚度D之间的定量关系为
| $ {T_{\rm{e}}} = {\left[ {\frac{{12(1 - {\nu ^2})D}}{E}} \right]^{\frac{1}{3}}}, $ | (1) |
式中:弹性参数E和ν分别为杨氏模量和泊松比。
根据松弛时间定义[1]的弹性岩石圈实质上是要求弹性岩石圈内的黏弹性松弛时间大于载荷作用时间,即载荷作用在弹性岩石圈中尚未松弛,而在下伏黏性岩石圈中已经松弛。根据Turcotte和Schubert[1]的分析,初始应力σ0松弛一半需要的时间为
| $ {\tau _{\rm{r}}} = \frac{3}{{2E{C_1}\sigma _0^2}}{{\rm{e}}^{{E_{\rm{a}}}/RT}}. $ | (2) |
假定杨氏模量E=70 GPa,松弛时间τr=107 a,初始应力σ0=100 MPa,对于干的橄榄石Ea=523 kJ·mol-1,C1=4.2×10⁵ MPa-3·s-1,由公式(2)给出弹性岩石圈底界相当于干橄榄石温度675 ℃,而对于湿的橄榄石Ea=398 kJ·mol-1,C1=5.5×10⁵ MPa -3·s-1,由公式(2)给出弹性岩石圈底界相当于475 ℃等温线。
以上两种弹性岩石圈的定义之间没有直接联系。基于松弛时间定义的弹性岩石圈理论上合理,但因黏度难以直接测量无法广泛应用,而基于弹性板弯曲定义的弹性岩石圈则广泛应用于实际弹性岩石圈厚度的确定。
2 有限元模型 2.1 物理模型本研究采用的物理模型如图 2所示。在线状分布的地表垂向载荷(海山或岛链载等)作用下的岩石圈弯曲问题近似模拟为平面应变问题。岩石圈底部采用弹簧型边界条件模拟静水恢复力。上表面加载区域指定为垂向载荷线性变化,其余区域指定为自由边界。左侧边界指定为对称边界,而右侧边界位移固定。

|
Download:
|
| 图 2 物理模型 Fig. 2 Physical model | |
我们用Maxwell模型黏弹性体代表岩石圈。假设弹性变形体积可压缩,但弹性模量和泊松比不随深度变化;黏度则指定为随深度连续变化的情形[1]
| $ \eta = C{\rm{exp}} \left( {\frac{{{E_{\rm{a}}}}}{{RT}}} \right), $ | (3) |
式中:C为指前系数、Ea为活化能、T为绝对温度、R为普适气体常数。因为岩石圈所受压力较低,忽略压力对黏度的影响。本文考虑的黏度变化是与Karato和Wu[40]的结论相符的。他们指出位错蠕变在高温(例如大洋中脊)时是重要的,而低温时扩散蠕变占主导。由于海山或岛链载荷作用的时间尺度较大(>1 Ma),在这个时间尺度内岩石圈有相当部分的浅部低温区域经历了应力松弛,因此扩散蠕变是一个合理的假设[18]。设软流圈温度为Tm=1 300 ℃,指前系数C可以用参考软流圈黏度ηref表示
| $ {\eta _{{\rm{ref}}}} = C{\rm{exp}} \left( {\frac{{{E_{\rm{a}}}}}{{R{T_{\rm{m}}}}}} \right). $ | (4) |
因而式(3)可以重新写为
| $ \eta (y) = {\eta _{{\rm{ref}}}}{\rm{exp}}\left[ {\frac{{{E_{\rm{a}}}}}{R}\left( {\frac{1}{{T(y)}} - \frac{1}{{{T_{\rm{m}}}}}} \right)} \right] $ | (5) |
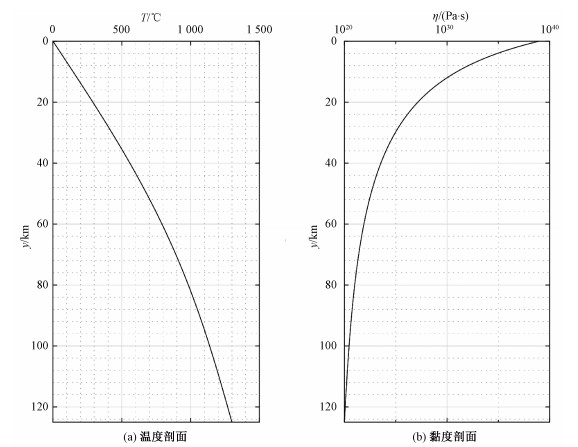
只要给定温度随深度的变化以及活化能Ea与参考软流圈黏度ηref就可以用式(5)确定黏度随深度的变化。Watts和Zhong[18]以及Watts等[16]曾用这样的扩散蠕变黏度公式结合板块冷却模型[41]和分层均匀黏弹性结构研究岩石圈弯曲和等效弹性厚度问题。他们推荐的参数组合是Ea=120 kJ/mol,ηref=1020 Pa·s。本文采用同样的参数设定,以方便模型及结果比较。
从式(5)可以看出温度是控制黏度的关键因素。我们采用板块冷却模型[41]计算岩石圈内温度分布
| $ \begin{array}{l} {\kern 1pt} {\kern 1pt} {\kern 1pt} {\kern 1pt} {\kern 1pt} {\kern 1pt} {\kern 1pt} {\kern 1pt} {\kern 1pt} {\kern 1pt} {\kern 1pt} {\kern 1pt} {\kern 1pt} {\kern 1pt} {\kern 1pt} {\kern 1pt} {\kern 1pt} {\kern 1pt} {\kern 1pt} {\kern 1pt} {\kern 1pt} {\kern 1pt} {\kern 1pt} {\kern 1pt} {\kern 1pt} {\kern 1pt} {\kern 1pt} {\kern 1pt} {\kern 1pt} {\kern 1pt} {\kern 1pt} {\kern 1pt} {\kern 1pt} {\kern 1pt} {\kern 1pt} {\kern 1pt} {\kern 1pt} {\kern 1pt} {\kern 1pt} {\kern 1pt} {\kern 1pt} {\kern 1pt} {\kern 1pt} {\kern 1pt} {\kern 1pt} {\kern 1pt} {\kern 1pt} {\kern 1pt} {\kern 1pt} {\kern 1pt} {\kern 1pt} {\kern 1pt} {\kern 1pt} {\kern 1pt} T(y) = {T_0} + ({T_1} - {T_0})\\ \left[ {\frac{y}{{{y_{L0}}}} + \frac{2}{\pi }\sum\limits_{n = 1}^\infty {\frac{1}{n}} {\rm{exp}}\left( { - \frac{{\kappa {n^2}{\pi ^2}{t_s}}}{{y_{L0}^2}}} \right){\rm{sin}}\left( {\frac{{n\pi y}}{{{y_{L0}}}}} \right)} \right], \end{array} $ | (6) |
式中:y是深度,ts为大洋岩石圈年龄,yL0是热岩石圈最大厚度,κ是热扩散系数,Tm和T0分别是软流圈和海底温度。模型参数取值见表 1。
|
|
表 1 模型参数 Table 1 Modeling parameters |
对年龄给定为80 Ma的大洋岩石圈,得到的温度和黏度随深度变化分别由图 3(a)和3(b)给出。
|
Download:
|
| 图 3 模拟采用的岩石圈温度和黏度剖面 Fig. 3 Adopted profiles of temperature and viscosity in the modeled lithosphere | |
假设岩石圈上表面受到不随时间变化的垂向载荷作用是关于y轴对称的,为减小计算量,只考虑x>0部分的岩石圈弯曲即可。垂向载荷函数指定为
| $ p(x) = \left\{ {\begin{array}{*{20}{c}} {{p_0}\left( {1 - \frac{2}{{{l_0}}} \cdot x} \right),}&{0 < x < \frac{{{l_0}}}{2};}\\ {0,}&{\frac{{{l_0}}}{2} < x < \frac{l}{2}.} \end{array}} \right. $ | (7) |
由于模拟问题是线性的,计算位移与应力均与施加的载荷成正比,而黏弹性松弛过程及外缘隆起的时间演化均与施加载荷的绝对大小无关。
岩石圈下表面受到软流圈静水恢复力与岩石圈下表面垂向位移成正比,即
| $ q(x) = kv(x), $ | (8) |
这里k=(ρm-ρw)g,ρm和ρw分别是岩石圈之下软流圈和岩石圈之上海水的密度,g是重力加速度,v(x)是岩石圈下表面的垂向位移。
2.2 数学模型岩石圈弯曲过程中,应力张量σij满足准静态平衡方程
| $ {\sigma _{ij,j}} = 0, $ | (9) |
位移与小应变之间满足几何方程
| $ {\varepsilon _{ij}} = \frac{1}{2}({u_{i,j}} + {u_{j,i}}). $ | (10) |
式中:ui为i方向上的位移,而应力与应变由体积可压缩的三维Maxwell体本构方程相联系,即
| $ {\sigma _{ij}} + \frac{\eta }{\mu }\frac{{{\rm{d}}{\sigma _{ij}}}}{{{\rm{d}}t}} = \left( {\frac{{{\sigma _{kk}}}}{3} + \frac{\eta }{\mu }\lambda \frac{{{\rm{d}}{\varepsilon _{kk}}}}{{{\rm{d}}t}}} \right){\delta _{ij}} + 2\eta \frac{{{\rm{d}}{\varepsilon _{ij}}}}{{{\rm{d}}t}}. $ | (11) |
式中:λ, μ为弹性拉梅常数;η为黏度(见式(5))。利用平面应变εzz=0的条件,三维问题可简化为二维问题。
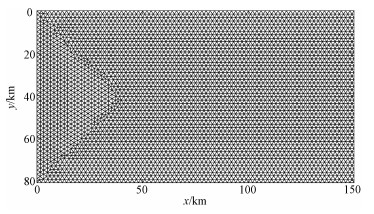
2.3 数值模型用有限元软件COMSOL[42]数值计算上文定义的岩石圈弯曲问题。模拟的黏弹性岩石圈为2 000 km×81 km的长方形区域。除精度检验外,本文结果一律基于参考模型计算。在参考模型中,采用5阶三角形单元对计算域进行剖分,共有126 520个单元,总自由度数为8 864 562。在区域的右半部分最大单元尺寸小于2 km,而x < l/4的左半部分的网格最大单元尺寸小于1 km。图 4给出部分区域(0 < x < 150 km)最大单元尺寸为2 km的网格剖分(实际计算所用的最大单元尺寸为1 km的网格剖分因网格过密不易分辨)。参考模型计算时间步长与模拟涉及的时间尺度有关。本研究的载荷作用时间尺度量级为1~1 000 Ma,所以黏度小于1021 Pa·s量级的热岩石圈中应力已经完全松弛[17],因此我们把数值模型黏度的下限设为1021 Pa·s。此黏度对应的松弛时间约为τmin=1 000 a。模拟计算过程中,分4个阶段逐渐加大时间步长:t=0~1 Ma阶段,时间步长为Δt1=100 a; t=1~10 Ma阶段,时间步长为Δt2=1 000 a;t=10~100 Ma阶段,时间步长为Δt3=0.01 Ma;t=100~1 000 Ma阶段,时间步长为Δt4=0.1 Ma。数值模型的计算精度检验由下文给出。
|
Download:
|
| 图 4 部分模型域的计算网格剖分 Fig. 4 Computational mesh in part of the modeling domain | |
为了验证数值模拟的计算精度,我们比较了不同网格尺寸、单元阶次和时间步长的模拟结果。
在网格单元尺寸的检验中,在参考模型网格的基础上,将最大网格尺寸加倍,单元数从参考模型的126 520减少到31 906,自由度从8 864 562减少到2 237 512。在单元离散阶次的检验中,将单元阶次从参考模型的5阶减小到4阶,自由度从8 864 562减少到5 826 450。在计算时间步长的检验中,将参考模型每一阶段采用的时间步长都增加到2.5倍,4阶段的最大步长依次为250、2 500、25 000和250 000 a。
以上3种检验模型的结果与参考模型比较由图 5示出。图中对比的是上表面t=100 Ma时刻x=0处的垂向位移。网格变疏、离散阶次减小、时间步长增大的结果在图 4中依次由加号、叉号、星号标记对应的线表示。结果显示4条曲线几乎完全重合,网格变疏、离散阶次减小、时间步长增大的3种检验模型相对于参考模型相对误差最大值的量级分别为10-6、10-8和10-9,证明本文得到的结果对计算网格、单元阶次及时间步长的选取不敏感,具有足够的计算精度。

|
Download:
|
| 图 5 数值模拟计算精度检验 Fig. 5 Accuracy tests for numerical modeling results | |
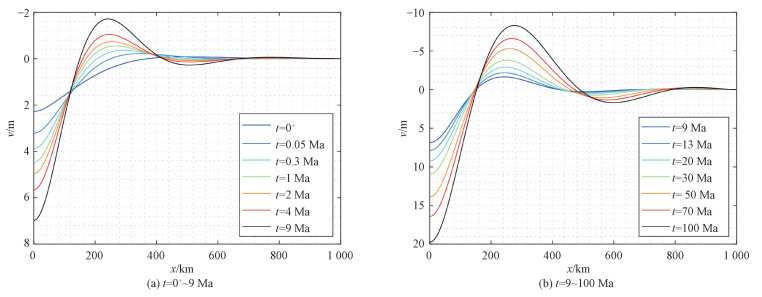
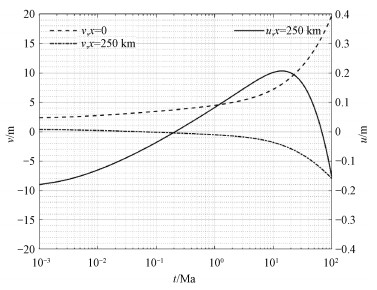
本节给出的模拟结果均基于参考模型。岩石圈上表面的垂向位移随着载荷加载时间的变化如图 6所示。图 6(a)与图 6(b)分别绘出t=0+~9 Ma与t=9~100 Ma两个时间段的垂向位移随x坐标的变化。图 6(a)中的t=0+解是程序给出的瞬时弹性位移解(图 8中t=0+结果表示瞬时弹性应力)。结果表明,前一时间段外缘隆起向内(加载一侧)运动,而后一时间段外缘隆起向外移动,即随着载荷作用时间的增加,外缘隆起与载荷中心处的距离先减小后增大。
|
Download:
|
| 图 6 岩石圈上表面的垂直方向位移随载荷作用时间的变化 Fig. 6 Vertical displacement of the upper surface of the lithosphere as a function of loading time | |

|
Download:
|
| 图 8 岩石圈黏弹性应力松弛过程 Fig. 8 Processes of viscoelastic stress relaxation in the lithosphere | |
上表面载荷中心处(x=0)的垂向位移,以及上表面x=250 km处的垂向位移与水平位移随时间的连续变化如图 7所示。图 7除清楚表明载荷中心与外缘隆起相反的垂向运动外,也清楚地反映了外缘隆起区域存在先内后外的水平运动特征。
|
Download:
|
| 图 7 计算位移的时间演化 Fig. 7 Evolution of the computed displacement | |
数值模拟得到的黏弹性应力松弛过程由图 8给出。图中绘出的是x=0处水平和垂向正应力σxx, σyy以及x=250 km处的水平方向正应力σxx和剪应力τxy在不同时刻随深度的变化。图 8表明,岩石圈中应力的黏弹性松弛是一个持续的动力学过程。在加载之后,岩石圈整个厚度均产生弹性响应,水平正应力随深度近乎线性分布,与弹性薄板假设很接近。随着载荷作用的持续,岩石圈深部的应力逐渐松弛,而浅部的正应力持续增加,岩石圈的弹性厚度因而持续减小。外缘隆起下方区域的剪应力呈现先增加后减小的趋势。这样的剪应力演化过程与外缘隆起区域先内后外的水平运动特征是一致的。
3.2 讨论Turcotte和Schubert[1]给出利用岩石圈弹性弯曲产生的外缘隆起位置反推出弹性岩石圈厚度的经典公式
| $ {T_{\rm{e}}} = {\left[ {\frac{{3(1 - {\nu ^2})({\rho _{\rm{m}}} - {\rho _{\rm{w}}})g}}{{E{\pi ^4}}}x_{\rm{b}}^4} \right]^{\frac{1}{3}}}. $ | (12) |
由外缘隆起的位置xb可计算弹性岩石圈厚度Te;Te随xb的单调变化图像如图 9(a)所示。图 9(b)给出本研究计算得到的外缘隆起位置随时间的演化规律。图 9(b)表明,外缘隆起与载荷中心的距离先是持续减小,直到t=9 Ma达到最小值242 km。而后,外缘隆起与载荷中心的距离又随时间持续单调递增直到1 000 Ma。

|
Download:
|
| 图 9 弹性岩石圈厚度与外缘隆起位置之间的关系以及外缘隆起位置随载荷作用时间的变化 Fig. 9 The classical relationship between the thickness of elastic lithosphere and the position of outer peripheral bulge (a) and the predicted position of outer peripheral bulge as a function of loading time (b) | |
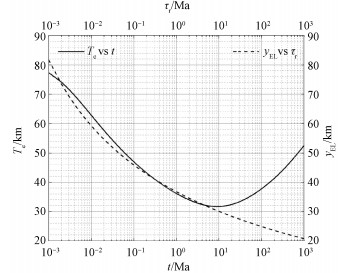
结合图 9(a)和9(b),即将本文模拟得到的外缘隆起位置变化由公式(12)转换成弹性岩石圈厚度,得到图 10所示的Te随加载时间的演化曲线。由于外缘隆起区域先内后外的水平运动导致图 10中Te先随加载时间减小而后又随时间增加。显然,弹性厚度随时间增加阶段的结果是违反物理规律的。因此,可以得到结论:前人广泛采用的利用外缘隆起位置反演弹性岩石圈厚度的做法具有严重缺陷,在载荷作用时间超过9 Ma以后会严重高估弹性岩石圈厚度。
|
Download:
|
| 图 10 弹性岩石圈两种传统定义给出的厚度对比 Fig. 10 Comparison between the thickness values calculated based on two classical definitions of elastic lithosphere | |
事实上,即使在载荷作用时间小于9 Ma的时间内,利用外缘隆起位置反演得到的弹性岩石圈厚度与根据松弛时间定义的弹性厚度也有明显的区别。根据Turcotte和Schubert[1]的公式
| $ {\tau _r} = \frac{{3\eta (y)}}{E}, $ | (13) |
我们计算了本文所用黏度剖面对应的深度yEL随松弛时间的变化关系,并绘制在图 10中。如果用松弛时间大于载荷作用时间作为弹性岩石圈的定义,显然松弛时间曲线对应于弹性厚度的另一种定义。
图 10清楚地表明,两种定义给出的弹性厚度仅在0.2~5.0 Ma的时间范围内较为符合(差异不超过0.64 km,且在t=0.30 Ma和t=4.5 Ma时两线重合)。在载荷作用时间小于0.2 Ma时,两种定义有显著差别但总体趋势一致。在t=0.001 Ma时两条曲线差距最大(4.4 km),接着差异慢慢减小到零(t=0.001 8 Ma),随后逐渐增大到3.64 km(t=0.008 Ma)后又逐渐减小。在t>5 Ma时,两种定义给出的弹性岩石圈厚度差异随时间快速增大。由于松弛时间定义的弹性厚度yEL是直接由模型给定的光滑单调变化的黏度剖面计算得到的,图 10中两条曲线间差距的复杂交替变化完全由岩石圈黏弹性松弛导致的外缘隆起移动特征造成。由图 9(b)可以看出,外缘隆起位置随加载时间对数的变化先后经历了斜率增加到接近常斜率、而后斜率又逐渐减小为零、最后斜率反向并逐渐增加的复杂演变。正是岩石圈黏弹性松弛的复杂性导致弹性岩石圈两种定义给出的厚度曲线出现多次交叉的现象。
4 结论本文利用变黏度可压缩黏弹性有限元模型定量研究岩石圈弯曲的黏弹性松弛问题。模拟结果显示,外缘隆起位置具有先向弯曲中心运动后向弯曲外侧移动的特点,反向运动发生在载荷作用约9 Ma后。由于经典弹性板弯曲理论给出外缘隆起与弹性岩石圈厚度的单调正相关关系,据此反演的弹性岩石圈厚度不能应用于载荷作用超过9 Ma情形。否则,会出现弹性岩石圈厚度随加载时间增加的荒谬结果,违反岩石圈黏弹性松弛的物理规律。进一步与基于松弛时间的弹性岩石圈厚度定义进行对比,本文模拟结果表明,由基于弹性板弯曲解利用外缘隆起位置约束的弹性岩石圈厚度仅在载荷持续0.2~5.0 Ma的时间段内能够给出较为合理的结果,误差不超过0.64 km。在载荷作用时间小于0.2 Ma时,基于两种传统定义给出的弹性岩石圈厚度总体趋势一致,但差异最大可达4.4 km。而在载荷作用时间大于5 Ma时,两种定义给出的弹性厚度差异随时间快速增大。两种传统定义给出的弹性岩石圈厚度曲线出现多次交叉的现象,明确揭示岩石圈弯曲的黏弹性松弛是一个复杂的动力学过程,因此在确定弹性岩石圈厚度的地球动力学相关研究中应当充分考虑黏弹性松弛的影响。
| [1] |
Turcotte D L, Schubert G. Geodynamics[M]. 3rd ed. Cambridge, UK: Cambridge University Press, 2014.
|
| [2] |
Diao F, Wang R, Wang Y, et al. Fault behavior and lower crustal rheology inferred from the first seven years of postseismic GPS data after the 2008 Wenchuan earthquake[J]. Earth and Planetary Science Letters, 2018, 495: 202-212. Doi:10.1016/j.epsl.2018.05.020 |
| [3] |
Freed A M, Hashima A, Becker T W, et al. Resolving depth-dependent subduction zone viscosity and afterslip from postseismic displacements following the 2011 Tohoku-oki, Japan earthquake[J]. Earth and Planetary Science Letters, 2017, 459: 279-290. Doi:10.1016/j.epsl.2016.11.040 |
| [4] |
Crawford O, Al-Attar D, Tromp J, et al. Forward and inverse modelling of post-seismic deformation[J]. Geophysical Journal International, 2017, 208(2): 845-876. Doi:10.1093/gji/ggw414 |
| [5] |
Hu Y, Buergmann R, Banerjee P, et al. Asthenosphere rheology inferred from observations of the 2012 Indian Ocean earthquake[J]. Nature, 2016, 538(7625): 368-372. Doi:10.1038/nature19787 |
| [6] |
Hoechner A, Sobolev S V, Einarsson I, et al. Investigation on afterslip and steady state and transient rheology based on postseismic deformation and geoid change caused by the Sumatra 2004 earthquake[J]. Geochemistry Geophysics Geosystems, 2011, 12(7): Q07010. Doi:10.1029/2010GC003450 |
| [7] |
Klein F W. Lithospheric flexure under the Hawaiian volcanic load:internal stresses and a broken plate revealed by earthquakes[J]. J Geophys Res-Solid Earth, 2016, 121(4): 2400-2428. Doi:10.1002/2015JB012746 |
| [8] |
Caron L, Metivier L, Greff-Lefftz M, et al. Inverting glacial isostatic adjustment signal using Bayesian framework and two linearly relaxing rheologies[J]. Geophysical Journal International, 2017, 209(2): 1126-1147. Doi:10.1093/gji/ggx083 |
| [9] |
Tanaka Y, Klemann V, Martinec Z, et al. Spectral-finite element approach to viscoelastic relaxation in a spherical compressible Earth:application to GIA modelling[J]. Geophysical Journal International, 2011, 184(1): 220-234. Doi:10.1111/j.1365-246X.2010.04854.x |
| [10] |
Zhong S J, Paulson A, Wahr J. Three-dimensional finite-element modelling of Earth's viscoelastic deformation:effects of lateral variations in lithospheric thickness[J]. Geophysical Journal International, 2003, 155(2): 679-695. Doi:10.1046/j.1365-246X.2003.02084.x |
| [11] |
Capitanio F A, Morra G, Goes S. Dynamic models of downgoing plate-buoyancy driven subduction:subduction motions and energy dissipation[J]. Earth and Planetary Science Letters, 2007, 262(1/2): 284-297. |
| [12] |
Capitanio F A, Morra G, Goes S. Dynamics of plate bending at the trench and slab-plate coupling[J]. Geochemistry Geophysics Geosystems, 2009, 10(4): Q04002. Doi:10.1029/2008gc002348 |
| [13] |
Guest A, Schubert G, Gable C W. Stress field in the subducting lithosphere and comparison with deep earthquakes in Tonga[J]. J Geophys Res-Solid Earth, 2003, 108(B6): 2288. Doi:10.1029/2002jb002161 |
| [14] |
Gurnis M, Eloy C, Zhong S J. Free-surface formulation of mantle convection.2. Implication for subduction-zone observables[J]. Geophysical Journal International, 1996, 127(3): 719-727. Doi:10.1111/j.1365-246X.1996.tb04050.x |
| [15] |
Hunter J, Watts A B. Gravity anomalies, flexure and mantle rheology seaward of circum-Pacific trenches[J]. Geophysical Journal International, 2016, 207(1): 288-316. Doi:10.1093/gji/ggw275 |
| [16] |
Watts A B, Zhong S J, Hunter J. The behavior of the lithosphere on seismic to geologic timescales[J]. Annual Review of Earth and Planetary Sciences, 2013, 41(1): 443-468. Doi:10.1146/annurev-earth-042711-105457 |
| [17] |
Zhong S, Watts A B. Lithospheric deformation induced by loading of the Hawaiian Islands and its implications for mantle rheology[J]. J Geophys Res-Solid Earth, 2013, 118(11): 6025-6048. Doi:10.1002/2013JB010408 |
| [18] |
Watts A B, Zhong S. Observations of flexure and the rheology of oceanic lithosphere[J]. Geophysical Journal International, 2000, 142(3): 855-875. Doi:10.1046/j.1365-246x.2000.00189.x |
| [19] |
Zhong S J. Dynamics of crustal compensation and its influences on crustal isostasy[J]. J Geophys Res-Solid Earth, 1997, 102(B7): 15287-15299. Doi:10.1029/97JB00956 |
| [20] |
Gunn R. A quantitative evaluation of the influence of the lithosphere on the anomalies of gravity[J]. Journal of the Franklin Institute, 1943, 236: 47-65. Doi:10.1016/S0016-0032(43)91198-6 |
| [21] |
Barrell J. The strength of the earth's crust[J]. Journal of Geology, 1914, 22(8): 729-741. Doi:10.1086/622189 |
| [22] |
Kim S S, Wessel P. Flexure modelling at seamounts with dense cores[J]. Geophysical Journal International, 2010, 182(2): 583-598. Doi:10.1111/j.1365-246X.2010.04653.x |
| [23] |
Forsyth D W. Subsurface loading and estimates of the flexural rigidity of continental lithosphere[J]. Journal of Geophysical Research-Solid Earth and Planets, 1985, 90(B14): 2623-2632. |
| [24] |
Wessel P. A reexamination of the flexural deformation beneath the Hawaiian-islands[J]. J Geophys Res-Solid Earth, 1993, 98(B7): 12177-12190. Doi:10.1029/93JB00523 |
| [25] |
Contreras-Reyes E, Garay J. Flexural modeling of the elastic lithosphere at an ocean trench:a parameter sensitivity analysis using analytical solutions[J]. Journal of Geodynamics, 2018, 113: 1-12. Doi:10.1016/j.jog.2017.11.004 |
| [26] |
Contreras-Reyes E, Osses A. Lithospheric flexure modelling seaward of the Chile trench:implications for oceanic plate weakening in the Trench Outer Rise region[J]. Geophysical Journal International, 2010, 182(1): 97-112. |
| [27] |
Manriquez P, Contreras-Reyes E, Osses A. Lithospheric 3-D flexure modelling of the oceanic plate seaward of the trench using variable elastic thickness[J]. Geophysical Journal International, 2014, 196(2): 681-693. Doi:10.1093/gji/ggt464 |
| [28] |
杨永章, 李金岭, 松本晃治, 等. 利用全月重力/地形导纳估计月球弹性层厚度[J]. 中国科学院大学学报, 2018, 35(4): 463-467. |
| [29] |
Watts A B. Analysis of isostasy in the world's oceans. 1. Hawaii-Emperor seamount chain[J]. Journal of Geophysical Research, 1978, 83(NB12): 5989-6004.
|
| [30] |
Watts A B, Cochran J R. Gravity anomalies and flexure of lithosphere along Hawaiian-Emperor seamount chain[J]. Geophysical Journal of the Royal Astronomical Society, 1974, 38(1): 119-141. Doi:10.1111/j.1365-246X.1974.tb04112.x |
| [31] |
Caldwell J G, Turcotte D L. Dependence of the thickness of the elastic oceanic lithosphere on age[J]. Journal of Geophysical Research, 1979, 84(NB13): 7572-7576. Doi:10.1029/JB084iB13p07572 |
| [32] |
Watts A B, Sandwell D T, Smith W H F, et al. Global gravity, bathymetry, and the distribution of submarine volcanism through space and time[J]. J Geophys Res-Solid Earth, 2006, 111(B8): B08408. Doi:10.1029/2005jb004083 |
| [33] |
Walcott R I. Flexural rigidity, thickness, and viscosity of lithosphere[J]. Journal of Geophysical Research, 1970, 75(20): 3941-3954. Doi:10.1029/JB075i020p03941 |
| [34] |
Sleep N H, Snell N S. Thermal contraction and flexure of mid-continent and Atlantic marginal basins[J]. Geophysical Journal of the Royal Astronomical Society, 1976, 45(1): 125-154. Doi:10.1111/j.1365-246X.1976.tb00317.x |
| [35] |
Quinlan G M, Beaumont C. Appalachian thrusting, lithospheric flexure, and the paleozoic stratigraphy of the eastern interior of north-America[J]. Canadian Journal of Earth Sciences, 1984, 21(9): 973-996. Doi:10.1139/e84-103 |
| [36] |
Mcnutt M K, Parker R L. Isostasy in Australia and evolution of compensation mechanism[J]. Science, 1978, 199(4330): 773-775. Doi:10.1126/science.199.4330.773 |
| [37] |
Lambeck K, Nakiboglu S M. Seamount loading and stress in the ocean lithosphere:2. Viscoelastic and elastic-viscoelastic models[J]. Journal of Geophysical Research:Solid Earth (1978-2012), 1981, 86(B8): 6961-6984. Doi:10.1029/JB086iB08p06961 |
| [38] |
Courtney R C, Beaumont C. Thermally-activated creep and flexure of the oceanic lithosphere[J]. Nature, 1983, 305(5931): 201-204. Doi:10.1038/305201a0 |
| [39] |
Watts A B. Isostasy and flexure of the lithosphere[M]. Cambridge: Cambridge University Press, 2001.
|
| [40] |
Karato S, Wu P. Rheology of the upper mantle:a synthesis[J]. Science, 1993, 260(5109): 771-778. Doi:10.1126/science.260.5109.771 |
| [41] |
Parsons B, Sclater J G. Analysis of variation of ocean-floor bathymetry and heat-flow with age[J]. Journal of Geophysical Research, 1977, 82(5): 803-827. Doi:10.1029/JB082i005p00803 |
| [42] |
Comsol. COMSOL multiphysics programming reference manual[M]. COMSOL INC, 2016.
|
 2020, Vol. 37


