 2016, Vol. 33


Large-scale instruments and equipments of universities are the most important material basis for teaching and scientific research, and reflect the comprehensive capabilities of colleges and the level of scientific research[1]. Recent years, domestic and foreign universities made many attempts to share instruments and equipments. China has already the laws and regulations on scientific instruments sharing such as interim measures for the administration of the central management of the national large scientific instruments, and the methods for the management of instruments and equipments in colleges and universities[2]. The resource sharing of instruments in universities has been considered as a system, which has been shaped in the specific practice and theoretical exploration. However, instruments remote sharing and collaboration platform has not been fully realized. We still need to study and explore this field.
According to the ministry of education statistics, in China, there are 20% of university instruments and equipments are in completely idle state, and the annual use time of 40% of precious precision analysis instruments in 170 universities is less than 500 h, which directly reduces the efficiency of education investment[3]. In order to improve the situation, it is necessary to analyze the reasons of affecting the instrument resource efficiency and to take effective measures.
Instrument Booking and Billing System of Chinese Academy of Sciences Version 2.0, IBBS@CAS for short, was put to use in 2009. It makes important contributions to institutions for the instruments resource sharing, increases facility utilization, and reduces operating cost. However, with the growth of user number, system capacity faces with bottleneck. In existing system many problems were exposed, which directly led to the fact that the installation rates and usage rates of the IBBS@CAS were both at relatively low levels.
To improve the IBBS@CAS system performance, three institutions including School of Computer and Control Engineering, Institute of Computing Technology Chinese Academy of Sciences, and Computer Network Information Center have cooperated together. In the work of enhancing the system, there are many tasks we should undertake. In this paper, we only talk about the work of system analysis and optimization for which experiments were carried out on the simulation environment. For the IBBS@CAS system, there are many factors that affect the performance of web application such as network bandwidth and working load. We analyze system functional demands and architecture design, conduct performance testing, sum up the various factors which influence the performance. Our solution proposed in this study is mainly on the configuration parameter adjustment of database, web server, and load balancing server.
1 IBBS@CAS system 1.1 OverviewIBBS@CAS aims to increase the service efficiency of the instruments and save the users' and managers' time by providing the scientific personnel with all the kinds of instruments information. Each instrument has its card terminal to ensure that researchers use instruments conveniently, which reduces the work intensity of the instrument management personnel.
By 2013, there are a total of 86 research institutes using this system. The data in back-end database shows that it has 31 423 users and 8 252 instruments, and the instruments which have been installed with the card swiping system are over 50%. The system processed more than 510 000 orders at 2013. IBBS@CAS system gradually realizes cross-regional equipment use and operation, data statistics, and real-time response.
However, according to incomplete statistics, there are only 3 000 active users and 2 855 active instruments in the system. That is to say, active users accounted for only 10% and percentage of active instruments is approximately 35%.
Although the functions of IBBS@CAS can content users' demands, the utilization rate is lower. Through analyzing this system, we find that the reasons of low usage rate have five tips which are described as follows.
(i) Slow response: The response time of booking function is too long. On the other hand, the database has lots of slow queries.
(ii) Frequent failure: The card swiping system has many exceptions and failures that lead to the fact that the research institutes must restart the program every day, even every two hours.
(iii)Poor user experience: Low efficiency of business processes and mobility and personalized customization difficulties causing poor user experience.
(iv) Scalability difficult: System tends to saturate and the scalability of instrument is very difficult.
(v) Poor flexibility: System upgrade is restricted.
For more comprehensive understanding of the system, we will introduce a system use case of the main functions and system architecture.
1.2 Booking scenarios 1.2.1 Business platformsThe business framework of IBBS@CAS has five platforms: the Core Business Platform, Information Resource Center, Monitor System, Information Exchange Platform, and Mobile APP.
The Core Business Platform includes eight functional modules and covers a total of 38 sub-functions such as equipment purchase, maintenance, and instrument reservation. The business is mainly based on instrument booking service as the main function.
Information Resource Center integrates all kinds of information to carry out the statistical analysis and to provide support for the decision-making of equipment. Information Exchange Platform, which is based on the standard specification of data exchange, implements the data exchange and information sharing between the Core Business System, ARP System, and the Smart Card System. Monitor Service and Display System collect the service information to carry out all-round monitoring, and ensure the system's self-management. At the same time, system integrates with existing ARP system for synchronous information.
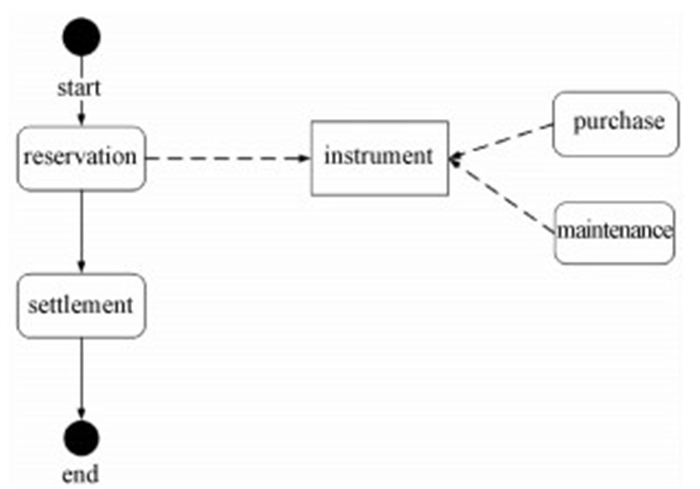
1.2.2 Core business use caseInstrument reservation service is the main function in this system (Fig. 1). For instrument management, it has three main aspects: purchase, maintenance, and reservation. The process of reservation and using instrument is described as follows.
(i) Users fill out the application form.
(ii) Instrument management personnel reviews the information on the form.
(iii) If examination is passed, users can use the instrument in the booking period and swipe the card to record the start time.
(iv) Users swipe to record the end time when they finish experiment.
(v) Pay for it.

|
Download:
|
|
Fig. 1 Core business flow |
|
Technical architecture refers to the infrastructure to support the critical applications including hardware, software, interface definition, technical standards, and so on.
The system has three layers architecture: access layer, application layer, and infrastructure layer (Fig. 2). The external access of this system includes mobile APP, the swipe card terminal server, the third-party system (ARP), and so on. Each research institute system accesses service through the swipe card terminal server. At application layer, the core business platform includes business module and workflow engine which uses distributed service framework. Load balancing service implements the dynamic allocation strategy of the request load of the deployed nodes. Distributed cache service provides an independent buffer to the relative static hotspot data to improve the data query speed and reduce the IO pressure. Distributed coordination service adopts zookeeper framework. Distributed database at infrastructure layer is used to store instruments data.

|
Download:
|
|
Fig. 2 System architecture |
|
The challenges to enhanced system are shown as follows.
(i) There are difficulties in rewriting system.
(ii) In the process of optimization, the system must keep online.
(iii) For its complex multi-layer distributed architecture, it is hard to find out the performance bottlenecks.
2 Current methodologyIn this section, we provide an overview of the existing typical solutions for improving the performance of web application system and discuss whether these solutions are suitable for our system.
Website is divided into two parts: front and back. The mainly part of the impact of user access is the front page. The background is used to achieve the function of the site such as users' registration.
2.1 Front-end optimizationIn all the optimization solutions, front-end optimization is the first step[4]. Steve Souder is a performance optimization expert in Google. His "performance golden rule"[5] describes that 80%~90% of the user response time is spent in the download and process resources and only 10%~20% of the time is spent on downloading HTML document[4, 6].
In the front-end optimization methods, the main goal is to reduce the loading time by lowering the generate traffic. Another part of the optimization process is to reduce the number of resources required by the page in order to optimize the loading time for the end client [7].
Here are some methods for optimizing front-end.
2.1.1 Browser cacheCache is a common method in optimization. HTTP requests some resources frequently such as static resource, CSS, but these resources update frequency is low. In this case, the files are suggested to cache in the browser end. This can reduce the server pressure. If there are enough spaces, the file should always be cached[8].
2.1.2 Page layoutThe browser will render the entire page after downloading all the CSS, but after loading the JavaScript, it will be immediately executed. This action is easy to cause page loading slowly. The best way to improve performance is to put CSS on the top of the page and the JavaScript at the bottom of the page.
2.1.3 CDNContent delivery network (CDN) is essentially a cache. An end user makes a request that is directed to a CDN edge server[9]. If the request file is cached, the CDN content server directly returns a default file. Otherwise, the CDN content server directs a request for the file to the origin server to retrieve the file, after which the file is cached on the CDN content server for subsequent use in servicing other requests[10]. With the fastest speed access to data, it can reduce the load of the data center.
2.1.4 Reverse proxyReverse proxy is a server that transparently hands off requests to another server[11]. Reverse proxy web server accepts HTTP requests. All access requests must go through the proxy server at first. Through cache configuration, it can accelerate web request. When the user first visits to static content, static content is cached on the reverse proxy server. Other users to access the content can be directly from the proxy server to return. Sometimes the proxy server will cache some popular dynamic web page.
Front-end optimization can significantly speed up page loading time, and reduce the response time of the system. These solutions are effective for the web application system. However, as mentioned above, our experiment environment is the simulation system of IBBS@CAS and system has no source code. So it is difficult to rewrite system. Although these front-end optimization strategies are useful for performance optimization, these solutions are not suitable for the optimization of our system.
2.2 Back-end optimization 2.2.1 Server-side· Distributed cache
Distributed cache is essentially a hash table, the data cache in the form of a pair of key and value which are stored in the memory hash table. Distributed cache is to cache deployment to multiple servers in a cluster, and the cluster provides caching services. There are two architectural approaches.
(i) JBoss cache, which needs synchronization updated of distributed cache.
(ii) Memcache, a distributed cache which does not communicate with each other.
JBoss cache is a transactional replicated, either synchronous or asynchronous, cache system designed to cache frequently accessed java objects in order to dramatically improve the application performance[12]. In JBoss distributed cache, each server caches the same data in a cluster and needs to update communications.
In the memcached centralized cache cluster, cache and application are separated. Caching system deployed on a group of dedicated server, and the application server through the routing algorithms such as consistency hash algorithms to select the cache server to remote access cache data.
· Asynchronous
System uses the message queue to make system call asynchronously. The user requests return immediately after the data is sent to the message queue. Then the message queue consumer process gets data from the message queue, and asynchronously writes to the database. In the case of high concurrency, it alleviates the pressure on the database.
IBBS@CAS was originally designed to implement the distributed JBoss server. Here we focus on the optimization of Jboss server.
2.2.2 Database· Read/Write splitting
Database server has two servers: master and slave. It can effectively reduce the pressure of database. The master server provides write operation, and slave servers provide read operations. When the master server is written, the data should be synchronized to the slave servers and it ensure the integrity of the database.
· Indexes
Each database has its own specific indexes, and candidate indexes are compared with existing indexes to determine whether the existing indexes can be reused or modified in the specific application [13]. In the IBBS@CAS, the main factor that affects the performance of the database is query performance. Adding indexes or caching query keyword should be the best way to improve database performance.
In the next section, we build a simulation system, and conduct performance testing and log analyses to find out system bottleneck.
3 System testing and log analysisIBBS@CAS is the instrument booking and billing platform based on B/S mode and includes a number of subsystems such as detection booking.
In order to solve the performance problem of this system, we need to test system under the simulation environment of the whole system and analyze system log to find out the limitations of the software and functional design.
3.1 System testing 3.1.1 Testing environmentTesting environment is completely independent of the actual system but consistent with the real environment. Considering the actual system of three-level architecture, we build the academy level sharing server (business server and data server), the level of credit card server (Win2003+SQLServer2008) and client.
3.1.2 Testing contentPerformance testing can evaluate the merit of system, identify the vulnerability of the system, and provide basis for optimization system[14]. For this IBBS@CAS system, performance testing is mainly for the core functions of server and database.
Under the simulation environment, we analyze and test the system in many aspects. First, we monitor number change of the connection pools of database and analyze the parameters of the database configuration. Secondly, we compile statistics and analyze the log of database servers and identify SQL request processing bottlenecks and the database table structure design flaws. Thirdly, we conduct function testing and performance testing in the simulation environment to find the functional request which caused system request delay. Fourthly, through analyzing the running log of JBoss and web servers, system configuration, and other analyses, we find out the connection pool configuration and system configuration problems.
3.2 Log analysisThe web requests and the interaction between server, site, and visitor create data that are stored in a log file [15]. We compile statistics and analyze the log data to discover the reason of the faults and errors which occurred in operation.
3.2.1 Log collectionThe main objects of the log collection are the system log and the database log. Due to the differences in the system architecture, the log of the central node and the log of each research institute have obvious differences. We collected the JBoss running log and system log from the center node. Under the framework of the JBoss, the running status of the program level is recorded in the JBoss log. System log records user's usage information and system abnormal data.
In order to guarantee timeliness of log information, here we mainly analyze log data of research institute in 2014. The time ranges of the system log of the research institutes are showed in Table 1.
|
|
Table 1 Log time ranges of institutes |
· Log feature extraction
Through the pre-processing of log files, we found that in the log there are focuses in two events:
(i) users' usage information including user login and user operation, and
(ii) exception information in the operation of the system including abnormal shutdown and transmission error.
Feature extraction is statistic and records the characteristics of information. For example, according to the abnormal characteristics of the system, we extract the information from the following key words:
Features: (Fault|Abnormal|Failure|Error)
· Analysis algorithm
After the completion of the feature analysis and extraction, we can analyze the log data based on these features. According to the types of abnormal and user usage, we judge the running situation of the system and system load.
In our analysis algorithm, the input is filesDir which is the name of a directory containing log files to analyze, and the output is the statistical data of each day and each month. For each log file f in the directory fileDir, we check each line ln in f and analyze the feature message. If ln has the feature information, we extract its date or month and information.
By using this algorithm, the key features of the log files are analyzed. We can obtain the result of statistics data daily and monthly and analyze these statistical results intuitionally. Algorithm pseudo code is as follows.
1 for each log file f in directory filesDir do
2 read f
3 for each line ln in f do
4 analyze feature message
5 If ln has error information then
6 extract date d and information info
7 If dayMap contains (d, info) then
8 Increase the count of (d, info)
9 else put (d, info) into dayMap, count 1
10 end if
11 extract month mon and information info
12 If monMap contains (mon, info) then
13 Increase the count of (mon, info)
14 else put (mon, info) into monMap, count 1
15 end if
16 end if
17 end for
18 end for
19 Return dayMap, monMap
3.2.3 Center node log analysisDue to the particularity of system architecture, center node log analysis is listed separately. We conduct a comprehensive analysis to center node logs through the statistics and analyze the system load, system usage, and abnormal situation.
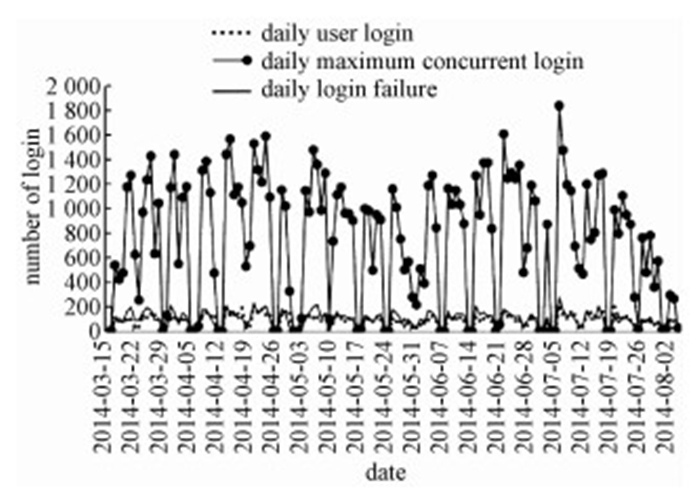
· Load statistical
We statistics the maximum amount of concurrent login, the number of login and the number of failures at the system center node from 15 March 2014 to August 6, 2014. Details shows in the following Fig. 3.

|
Download:
|
|
Fig. 3 User behavior analysis |
|
As shown in Fig. 3, the trends of the three curves are consistent and the statistical values show periodic changes. In weekends and on holidays the trough values appeared, and the peaks appeared on the working days. During the time interval, the number of login users went up to the highest of 1 837. That is to say, the user login activity had a total of 1 837 times on 7 July 2014. On that day there was the biggest amount of concurrent login. There were 275 users online at the same time. The times of login failure and daily maximum concurrent login are measured in high coincidence. When concurrency is large, the login failure times are high. This reflects that login failure may increase when system has a large amount of concurrent. Login failure usually appears when the user inputs wrong user name or password. It reflects the processing ability of this system needs to be improved. The number of user login is less than 2 000 on the working days. The daily concurrency values do not exceed 200. The current usage of system is not much as a whole.
· Database query performance
Slow query has a great effect on the performance of the system. However, this system has lots of slow queries and makes the system response slower. We compiled statistics on the number of database queries which operation times more than 100 ms. The results are shown in Fig. 4. In this figure, we can know the number of slow queries in each month of 2014. Although the total amount of more than 0.1 ms slow queries in each mouth is not too much, considering around 1 000 users usage on the working days, the ratio can't be ignored.

|
Download:
|
|
The august 2014 log file only collected in August 6th, so the number of results are less. Fig. 4 Number of database slow queries |
|
In aspect of database query time, we counted the biggest query time per day. One of the slowest time appeared on 8 April 2014 and the query time reached 327.5 seconds.
In addition, the database also had abnormality during operation. The abnormality includes that the database is not connection or has a null value. The cause of these abnormalities could be that database performance is not enough or the program inspections of input data format is not enough.
· JBoss abnormal analysis
Through the log analysis of JBoss, we found a lot of program running errors. The main exceptions are Batch Update Exception, EOF Exception, Generic JDBC Exception, Index Out Of Bounds Exception, and View Expired Exception.
Batch Update Exception and Generic JDBC Exception were associated with the database. EOF Exception and Index Out Of Bounds Exception were caused by improper programming. View Expired Exception was generally caused by inappropriate configuration framework. Because one exception may cause other abnormalities, the true abnormality quantity and statistical quantity may show certain differences.
Through system testing and log analysis, we find that with the number of concurrent users increasing web server load is heavy than before, which leads to system slower. Our study shows that the system server and database server should be considered with care. These two factors are close to the web performance.
4 Solutions for IBBS@CAS 4.1 Performance improvement approach 4.1.1 Functional testingBefore the implementation of the optimization measures, we test the system functional response under 200 concurrent access users. There are six test scenarios which are described as follows.
· List search
The time from click on "booking application" button to page loaded completely. Test the performance of getting a data list from the server side.
· Server-side validation
It refers to booking instrument processing time -click on a certain date then click on "add" button, enter the booking time, the total time from the click on "OK" button to add an appointment succeed. Some parameters are sent to the server, test the performance of waiting for the server to verify the legitimacy and return the results.
· Form submission
The time from test booking form all filled out and click the "submit" button to the success of the appointment. Submit the system form to the server. test the performance of the server inserts/updates the form data to the database.
· Query instrument
The time returned by query a particular instrument. Test the performance of query.
· Select instrument
The time from select an instrument to return.
· Composition scenario
Combination above all scenarios.
4.1.2 Oracle database optimizationFor database optimization, the main method is to modify parameters configuration of database.
(i) Check system initial state
Record initial state and parameter information of database firstly. For example, the main parameters we should record are the original parameter values about processes.
(ii) System parameter adjustment
Modify and increase parameter values, and reduce load pressure.
(iii) Data structure adjustment
Create an index for the database fields.
4.1.3 Web server configurationOptimization is mainly aimed at the central cluster node and changing the configuration of server.
(i) Change JBoss service
There are four JBoss servers in our system. We backup the JBoss directory files for three servers except the last server. The JBoss directory file of the last server covers the original JBoss directory file of the other three servers.
(ii) Increase memory allocation parameter.
(iii) Modify thread pool configuration, and increase the parameter values.
(iv) Modify log output configuration.
4.1.4 Load balance server regulationHere we mainly modify the weight of each server load distribution, in the total weight of 200 cases. Two servers' weights are 20 respectively, the other one is 70 and the last one is 90.
4.2 Comparison of resultsWe record the results before and after optimization of central node. The details of comparisons are shown in Table 2. In the built optimization environment, under the six testing scenarios of 200 concurrent users, test continued for 15 min and we obtained a series of results.
|
|
Table 2 Comparison of optimization results |
As shown in Table 2, under the condition of 200 concurrent users continuously tested for 15 min, the average system response time of list search reduced from 107.6 s to 3.7 s and the error rate reduced from 8% to 2%. The average response time of the form submission, querying instrument, selection of instrument slightly increased, but the max response time significantly decreased. System error rate was not stable, and the composition scenario error rate increased significantly.
5 ConclusionWithout affecting the normal operation of the system in improving its performance, optimization solutions need to consider many factors. In our study, to enhance the IBBS@CAS version 2.0 system, first we studied the related technologies to improve the performance of the web application, and analyzed the different optimization strategies of front-end, the server, and the database.
Then we built a simulation environment to conduct performance testing and log analysis, and summed up the bottleneck of system performance. Finally we proposed our suitable measures which mainly aimed at the optimization of database and web server optimization. Our solution is proposed under restrictive condition of system, and it is different from traditional methods.
The further work in our study tries to apply the methods of simulation environment to the real system, continuous tracking, and maintenance of the IBBS@CAS 2.0 version system. On the other hand, we will change internal architecture and upgrade the 2.0 version system.
The authors would like to thank two institutions of Chinese Academy of Sciences (Institute of Computing Technology and Computer Network Information Center of University) for beneficial collaboration and for providing experimental supports. The authors also thank the Institutes of biophysics, chemistry, and semiconductors, and the SINANO for providing the collection of user behavior data.
| [1] | HU Y Y. Effective improvement of the use efficiency of large-scale instruments and equipment[J]. Research and Exploration in Laboratory , 2013 (1) :180–183. |
| [2] | Zeng X S. Review of large-scale instrument and equipment sharing in university[J]. Experiment Science and Technology , 2012, 10 (5) :183–185. |
| [3] | Cao A H. Research and exploration on improving the use benefit of large equipment in universities[J]. China Modern Educational Equipment , 2009 (7) :9–12. |
| [4] | Ling P P. Based on Web Application Front-end performance optimization[C]//Electronic and Mechanical Engineering and Information Technology (EMEIT), 2011 International Conference on. IEEE, 2011, 1:234-237. |
| [5] | Souders S. The performance golden rule[EB/OL]. (2012-05-20)[2015-11-20].http://www.stevesouders.com/blog/2012/02/10/the-performance-golden-rule. |
| [6] | Souders S. High performance websites[M]. Sebastopol(CA): O'Reilly Media, 2007 : 146 . |
| [7] | Iliev I, Dimitrov G P. Front end optimization methods andtheir effect[C]//Information and Communication Technology, Electronics and Microelectronics (MIPRO), 201437th International Convention on. IEEE, 2014:467-473. |
| [8] | Reddy M, Fletcher G P. An adaptive mechanism for Web browser cache management[J]. Internet Computing, IEEE , 1998, 2 (1) :78–81. DOI:10.1109/4236.656085 |
| [9] | Davis A T, Parikh J, Pichai S, et al. Java application framework for use in a content delivery network (CDN):U.S. Patent 7127713[P/OL]. 2006-10-24.http://www.freepatentsonline.com/7127713.html. |
| [10] | Leighton F T, Lewin D M. HTML delivery from edge-of-network servers in a content delivery network (CDN):U.S. Patent 6996616[P/OL]. 2006-02-07.http://www.freepatentsonline.com/6996616.html. |
| [11] | Reese W. Nginx:the high-performance web server and reverse proxy[J]. Linux Journal , 2008, 2008 (173) :2. |
| [12] | Fong C K. A study in deploying self-organized Map (SOM) in an open source J2EE cluster and caching s ystem[C]//Complex Medical Engineering, 2007. CME 2007. IEEE/ICME International Conference on. IEEE, 2007:778-781. |
| [13] | Smith G S, Pant S. Database index design based upon request importance and the reuse and modification of similar existing indexes:U.S. Patent 5404510[P/OL]. 1995-04-04. http://www.freepatentsonline.com/5404510.html. |
| [14] | Wu Q, Wang Y. Performance testing and optimization of J2EE-based web applications[C]//Education Technology and Computer Science (ETCS), 2010 Second International Workshop on. IEEE, 2010, 2:681-683. |
| [15] | Burton M C, Walther J B. The value of web log data in use-based design and testing[J]. Journal of Computer-Mediated Communication , 2001, 6 (3) :0–0. DOI:10.1111/j.1083-6101.2001.tb00121x |