2. 中国科学院国家天文台, 北京 100101;
3. 西藏大学理学院物理系, 拉萨 850000;
4. 中国科学院大学, 北京 100049
2. National Astronomical Observatories, Chinese Academy of Sciences, Beijing 100101, China;
3. Department of Physics, College of Science, Tibet University, Lhasa 850000, China;
4. University of Chinese Academy of Sciences, Beijing 100049, China
宇宙线是来自外太空的高能粒子,主要由质子、原子核等带电粒子组成,并有光子等极少部分不带电成分。人们对宇宙线产生与传播的认识主要来自气球、卫星、地面观测站对宇宙线及γ射线的观测。银河系内的宇宙线产生于超新星遗迹、恒星形成区、年轻星团、脉冲星和新星等天体[1],其中不带电成分沿直线传播,而带电成分则在银河系内不均匀的磁场中不断进行回旋运动,表现出一种类似扩散的过程,可以通过扩散系数来描述[2],容易知道它与介质的不规则运动即湍动造成的磁场紊乱有关,磁湍动强度越大,扩散系数越小。
宇宙线的扩散系数通常可以通过测量某些标志性原子核数目的比值得到[1-2]。以硼碳比为例,一般认为宇宙线中的碳核主要来自于宇宙线加速地,而硼核则完全由宇宙线中的碳、氧等重元素与星际介质的碰撞过程产生。硼碳比(B/C)正比于R-δ,其中R为宇宙线粒子的刚度,即粒子动量与电量的比值(R=p/Ze),δ为宇宙线扩散系数中的指数部分(D∝Rδ)。对于Kolmogrov湍动,δ等于1/3;对于Kraichnan湍动,δ则为1/2。此外,在扩散过程中,宇宙线还会与周围物质作用产生次级粒子,包括甚高能γ光子。它主要来自电子与宇宙微波背景辐射光子的逆康普顿散射以及质子与星际介质碰撞产生的中性π介子的衰变[2-3]。因此γ射线源周围的宇宙线在传播过程中会在其周围产生一个较明亮的TeV晕[4-5],利用TeV晕的表面亮度曲线也能得到该源附近的宇宙线扩散系数[6]。
HAWC (the high-altitude water Cherenkov gamma-ray observatory) 对Geminga附近的甚高能γ射线观测表明,这颗脉冲星附近的粒子扩散系数远低于银河系的平均值[6-8],这样的结果表明银河系中粒子的扩散系数很有可能是不均匀的。较低的扩散系数可能来源于这颗脉冲星周围的星际介质较强的磁湍动,这可能产生于其前身星或脉冲星晕的能量注入[9], 或仅仅因为其恰好处在一个更大的磁湍动较强的区域中。对于上述2种情况,除宇宙线外,其他天体(例如中性氢云)也会受到湍动的影响,表现出与同类型天体不同的性质。本文尝试研究Geminga周围中性氢云的湍动特性,进而探究Geminga周围宇宙线慢扩散的成因。
湍动在星际介质中无处不在,是其演化的关键物理过程之一。各种观测证实,湍动是在各个空间尺度下被驱动产生的,并逐级向下发展为更小尺度的湍动[10-12]。星际介质的高雷诺数使其拥有充分发展的湍动,并具体表现为密度与速度波动的空间自相似性。对中性氢21 cm谱线的观测表明,密度与速度的空间功率谱在pc尺度下甚至AU尺度下展现出幂律谱的特性[13-14]。这使得空间功率谱分析成为探测与量化星际介质小尺度结构强有力的工具。而由于磁冻结效应,磁湍动与星际介质密度的湍动息息相关,因此可以利用星际介质的密度空间功率谱在一定程度上估计其磁湍动的强度。
1 数据与处理本文采用GALFA(galactic Arecibo L-band feed array) HI巡天的数据。GALFA HI巡天是由阿雷西博305 m射电望远镜完成的一次大范围中性氢巡天项目,在2011年首次发布数据。该巡天的分辨率为4′,速度分辨率为0.2 km/s,灵敏度为60~140 mK[15]。
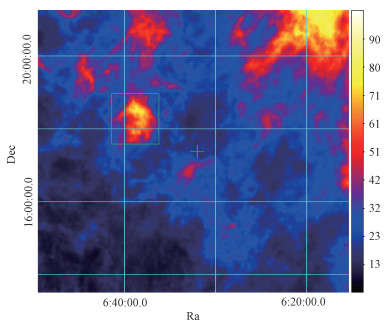
从中选取以Geminga,即(l, b)=(195.1°, 4.3°)(J2000)为中心的10°×10°天区,速度-40~40 km/s的数据。由于Geminga所在位置背离银心方向且至地球的距离只有250+20-60 pc[16],因此,根据银河系旋转曲线模型,视向速度在0 km/s附近的中性氢云适合作为本研究的示踪天体。观察各速度频道的亮温度图(图 1,中心十字为Geminga位置),发现速度在-7.00~0.36 km/s区间内,在Geminga的左上方(图 1绿框内)有一片相对其他位置更明亮且独立的中性氢云。

|
Download:
|
| 图 1 赤道坐标系下v=-5.52 km/s时的亮温度图 Fig. 1 Brightness temperature map at v=-5.52 km/s in equatorial coordinate | |
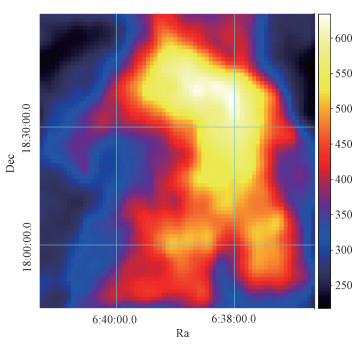
云的大小约为1.5°×1.5°,中心距Geminga约1.7°。截取该部分作为本文分析研究的对象。叠加截取该部分各个速度频道的亮温度数据,得到其中性氢谱线对速度积分后亮温度分布图,如图 2所示,以下简称积分亮温度图。

|
Download:
|
| 图 2 赤道坐标系下所选中性氢云的积分亮温度图 Fig. 2 Integrated brightness temperature map of the selected neutral hydrogen cloud in equatorial coordinate | |
对于光学薄的介质,可以从中性氢21 cm谱线积分亮温度图推测它的中性氢柱密度。对于给定速度v、速度带宽δv和动力学温度Tk的中性氢气体,有21 cm谱亮温度
| $T_{\mathrm{B}}(v)=T_k(1-\exp (-\tau(v))), $ | (1) |
其中
| $\tau(v)=\frac{N_{\mathrm{H}}(v)}{\mathrm{C} \times T_k \delta v}$ | (2) |
式中:NH(v)是当前条件下的中性氢柱密度,C=1.823×1018 cm-2·K-1·km-1·s[17]。因此,对于光学薄的气体,近似有
| $N_{\mathrm{H}}(v)=\mathrm{C} \times T_{\mathrm{B}}(v) \delta v .$ | (3) |
观察积分亮温度图,亮温度峰值出现在右上角,为634 K·km/s,速度带宽为7.36 km/s,对应NH仅为8.51×1020 cm-2,表明该云为光学薄,吸收对亮度影响可以忽略不计。
2 空间功率谱分析空间功率谱分析是一种分析星际介质中湍动场的常用方法,该方法对选定的一片星际介质的柱密度分布图或质心速度分布图(velocity centroid map)进行分析,并由此得到星际介质密度场和速度场的湍动特性。为验证Geminga周围星际介质的湍动特性是否特殊,对选取的中性氢云进行密度场的空间功率谱分析,即对密度场进行傅里叶分析,然后对功率谱进行幂律谱的拟合,获得其谱指数[18]。谱指数包含有关湍动能量输入与耗散尺度的信息,可以用它推测该云中湍动是否较强。对于满足2个条件(光学薄且视线方向尺度大于等于横向尺度)的介质,密度波动与积分亮温度图的空间功率谱形状一致,谱指数相等。也就是说,在满足上述2个条件下,可以通过测量中性氢柱分布图的二维功率谱得到密度分布的三维功率谱[14]。对于该云,第1个条件已经满足(见前面柱密度计算),横向尺度为1.25°,在该处对应7.36 km/s, 1.73 pc的采样速度带宽应该能带来足够大的视线方向尺度,同样满足第2个条件,因此密度三维空间功率谱可直接由其21 cm谱线积分亮温度图的谱得出。
二维空间功率谱是自相关函数的傅里叶变换,在实际计算中,可以先进行傅里叶变换,再取其模的平方,即
| $P(k)=F(k) \times F^*(k)=|F(k)|^2, $ | (4) |
其中
| $k=\frac{2 \pi}{L}, $ | (5) |
式中:k为波数,L为尺度,F(k)为所研究区域的傅里叶变换,在本文中即所选中性氢云的积分亮温度图的傅里叶变换。得到二维空间功率谱后,可以直接利用椭圆幂律谱模型
| $\begin{aligned} \log P= & A\left[\left(q^2 \cos ^2 \theta+\sin ^2 \theta\right) x^2+\right. \\ & 2\left(1-q^2\right) x y \sin \theta \cos \theta+ \\ & \left.\left(q^2 \sin ^2 \theta+\cos ^2 \theta\right)\right]^{\Gamma / 2},\end{aligned} $ | (6) |
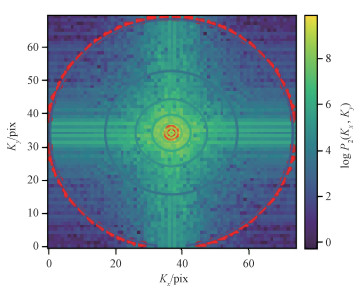
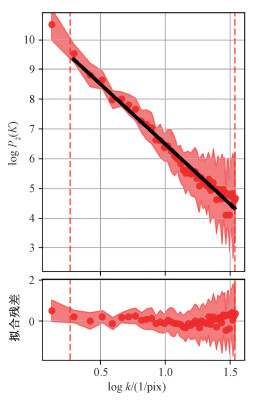
得到其谱指数,其中q是椭圆的离心率,θ是相对xy坐标系的方向角,Γ是椭圆幂律模型的谱指数。在考虑湍动各向同性的条件下,椭圆进一步简化为圆形,谱指数的计算也进一步简化:对二维功率谱进行处理时,将其在对数坐标下分为距离相等的若干圆圈,以图 3中红圈为例,它们代表一个个特定的波数k,然后计算每2个相邻圆圈组成的环内的平均值和均方根值,作为空间功率谱每个波数对应的功率值(图 4上的红点)与误差(图 4上的红色阴影)。最后利用最小二乘法对一维功率谱进行线性拟合,得到其谱指数与误差。

|
Download:
|
| 图 3 所选中性氢云的二维空间功率谱 Fig. 3 2D spatial power spectrum of the selected cloud | |

|
Download:
|
| 图 4 所选中性氢云空间功率谱的线性拟合(上)与拟合残差(下) Fig. 4 Linear fitting (top) and residuals (bottom) of the 2D spatial power spectrum of the selected cloud | |
具体操作过程中,使用python的TurbuStat包[19]完成上述所有步骤,并最终得到功率谱。该云的二维空间功率谱如图 3所示。各向同性假设下的空间功率谱如图 4所示,对功率谱拟合得到的谱指数为-4.0±0.1,拟合残差较小,所得结果符合幂律谱分布。
3 结果与讨论Armstrong等[20]通过脉冲星的星际闪烁现象研究距离小于1 kpc的星际介质的电子密度功率谱,发现在约2 000~1010 km的尺度上,谱指数为-3.7。再与色散量测量(dispersion measure)、法拉第效应的旋转量测量(rotation measure)等结果结合,进一步证实在约2 000~1015 km的横跨10个量级的尺度上,电子的密度功率谱可以很好地被谱指数为-11/3的Kolmogrov湍动谱描述。表明在暖电离气体中,在超过10个量级的尺度上,能量从大尺度传递到小尺度的过程中,能量损失几乎可以忽略不计,完全符合Kolmogrov湍动谱的预期[21]。
此外,中性氢的密度功率谱也常被用来描述银河系内不同区域中性气体的湍动特性,例如Crovisier和Dickey[13]; Green[22]; Dickey等[23]; Samir和Nirupam[24]; Kalberla和Haud[25]。
在上述工作中,有一些研究是基于各个独立的速度切片做出的,这些速度切片不满足视线方向尺度大于横向尺度的条件,因此分析这些星际介质柱密度分布图的二维空间功率谱只能得到密度场二维空间功率谱的信息。为方便与我们研究的中性氢云的三维空间功率谱相比较,根据Kolmogorov湍动理论[26],将二维空间功率谱的谱指数减1进行比较。综合起来可以发现,无论是本地的、猎户臂中的,还是更远处的星际介质,谱指数大都在-2.2~-4。更具体来说,在视向速度绝对值小于25 km/s的本地中性气体中,功率谱指数普遍大于-3.0[25]。对于视向速度在-20~-80 km/s间的中性气体(距离在1.5~13 kpc),谱指数可以达到-4.0[23]。
本文研究的中性氢气体云视向速度在-7.00~0.36 km/s,功率谱指数为-4.0。谱指数落在银河系中性氢功率谱指数分布范围的低端边缘。但是与其所在的本地中性氢星云的功率谱指数相比,却明显偏小。有以下几种潜在原因可以导致谱指数出现变化:1)视线方向尺度大于横向尺度的条件不满足。此时,我们所测量的密度功率谱中会额外包含速度湍动的信息,使得功率谱变平[24]。银河系冷中性氢气体的湍动速度弥散为4.0 km/s[27]。我们选取的中性氢云的视向速度宽度为7.36 km/s,大于4.0 km/s,因此测量到的谱指数不会因为视线方向尺度不足而偏离真实值。2)我们所研究的中性氢云周围存在一个垂直于视线方向的非常有序的磁场。冷中性氢云会倾向于沿磁场方向分布,而呈现出纤维状结构。此时中性氢云的湍动不再是各向同性的,垂直于磁场方向的湍动谱会明显变陡[28]。在图 1和图 3中,中性氢云不存在明显的纤维状结构和不对称结构。因此这也不是导致我们研究的中性氢云谱指数偏小的原因。3)在从大尺度结构向小尺度结构传递过程中一部分能量转化为热能而导致能量损失。功率谱描述的是能量在不同尺度上的分布。当能量在传递过程中出现损失时,小尺度团块获得的能量减少,功率谱自然会变陡。在本项研究中,选取的中性氢云的尺度大约为1.2°。由于使用数据的空间分辨率为4′,优于对本地中性气体的研究[25]所使用数据的分辨率(16.2′),因此我们得到的功率谱包含更小尺度(4′~16′)的湍动信息。然而在16′~1.2°范围内,两者是有重叠的,这段范围内谱指数的不同无法用能量损失简单解释。此外在图 4中,功率谱并没有在尾端出现谱指数变化,因此能量损失致功率谱变陡的假设似乎也不成立。
宇宙线的扩散系数与星际介质的湍动模式密切相关。扩散系数的指数部分可以表示为4+α,其中α为星际介质功率谱指数[29]。对Geminga TeV晕亮度随半径变化的研究表明,晕中粒子的扩散系数相对银河系平均值更小。这个结果暗示Geminga周围星际介质的湍动能谱可能与其他区域不同,从而导致扩散系数偏低。对于本文中研究的中性氢云,其功率谱指数为-4.0±0.1,与视向速度绝对值<25 km/s的本地中性氢云的功率谱指数明显不同。如果假设本文中中性氢功率谱的测量是真实无偏差的,该结果似乎可以解释Geminga周围的特殊粒子扩散系数。
4 总结与展望空间功率谱分析是分析星际介质湍动特性的常用方法。利用GALFA HI巡天数据,在Geminga附近选取一块相对独立的中性氢云进行了空间功率谱分析。首先对该云21 cm谱线的积分亮温度图进行傅里叶变换并取其模的平方,得到其二维空间功率谱,然后对二维功率谱按方位角进行平均,得到中性氢云的空间功率谱,其谱指数为-4.0±0.1。与银河系内本地中性氢云的功率谱相比,该谱明显偏陡。分析中性氢云功率谱偏陡的可能原因,排除了视线方向所取的“厚度”不足、垂直于视线方向的有序磁场、能量损失等因素的影响。该中性氢云的谱指数与Geminga TeV晕中粒子扩散系数的测量,同时指向Geminga周围存在一个区域,其中星际介质湍动的特性与周围区域的湍动特性不同。后续工作中,将在Geminga附近选取更多的中性氢云进行功率谱分析。在此基础上研究中性氢云湍动能谱相对Geminga位置是如何变化的,使本文研究的结论更有说服力。与阿雷西博射电望远镜相比,我国的FAST射电望远镜有更好的空间分辨率和灵敏度[30]。这使得我们可以更精确地研究中性氢云的功率谱,探究不同类型宇宙线加速源附近星际介质的湍动特性。
| [1] |
Biermann L. Origin and propagation of cosmic rays[J]. Annual Review of Nuclear Science, 1953, 2: 335-364. Doi:10.1146/annurev.ns.02.120153.002003 |
| [2] |
Strong A W, Moskalenko I V, Ptuskin V S. Cosmic-ray propagation and interactions in the galaxy[J]. Annual Review of Nuclear and Particle Science, 2007, 57: 285-327. Doi:10.1146/annurev.nucl.57.090506.123011 |
| [3] |
Hinton J A, Hofmann W. Teraelectronvolt astronomy[J]. Annual Review of Astronomy and Astrophysics, 2009, 47: 523-565. Doi:10.1146/annurev-astro-082708-101816 |
| [4] |
Tatischeff V, Gabici S. Particle acceleration by supernova shocks and spallogenic nucleosynthesis of light elements[J]. Annual Review of Nuclear and Particle Science, 2018, 68: 377-404. Doi:10.1146/annurev-nucl-101917-021151 |
| [5] |
Reynolds S P. Supernova remnants at high energy[J]. Annual Review of Astronomy and Astrophysics, 2008, 46: 89-126. Doi:10.1146/annurev.astro.46.060407.145237 |
| [6] |
Abeysekara A U, Albert A, Alfaro R, et al. Extended gamma-ray sources around pulsars constrain the origin of the positron flux at Earth[J]. Science, 2017, 358(6365): 911-914. Doi:10.1126/science.aan4880 |
| [7] |
Yuan Q, Lin S J, Fang K, et al. Propagation of cosmic rays in the AMS-02 era[J]. Physical Review D, 2017, 95(8): 083007. Doi:10.1103/physrevd.95.083007 |
| [8] |
Aguilar M, Cavasonza L A, Ambrosi G, et al. Precision measurement of the boron to carbon flux ratio in cosmic rays from 1.9 GV to 2.6 TV with the alpha magnetic spectrometer on the International Space Station[J]. Physical Review Letters, 2016, 117(23): 231102. Doi:10.1103/PhysRevLett.117.231102 |
| [9] |
Breitschwerdt D, Tautz R C, Avillez M A. Impact of supernovae on the interstellar medium and the heliosphere[M]. Cham: Springer, 2016. Doi:10.1007/978-3-319-20794-0_18-1
|
| [10] |
Stutzki J, Bensch F, Heithausen A, et al. On the fractal structure of molecular clouds[J]. Astronomy and Astrophysics, 1998, 336: 697-720. |
| [11] |
Stanimirović S, Staveley-Smith L, Dickey J M, et al. The large-scale HI structure of the small magellanic cloud[J]. Monthly Notices of the Royal Astronomical Society, 1999, 302(3): 417-436. Doi:10.1046/j.1365-8711.1999.02013.x |
| [12] |
Elmegreen B G, Kim S, Staveley-Smith L. A fractal analysis of the HI emission from the large magellanic cloud[J]. The Astrophysical Journal Letters, 2001, 548(2): 749-769. Doi:10.1086/319021 |
| [13] |
Crovisier J, Dickey J M. The spatial power spectrum of galactic neutral hydrogen from observations of the 21-cm emission line[J]. Astronomy & Astrophysics, 1983, 122: 282-296. |
| [14] |
Deshpande A A, Dwarakanath K S, Goss W M. Power spectrum of the density of cold atomic gas in the galaxy toward Cassiopeia A and cygnus A[J]. The Astrophysical Journal Letters, 2000, 543(1): 227-234. Doi:10.1086/317104 |
| [15] |
Peek J E G, Heiles C, Douglas K A, et al. The GALFA-HI survey: data release 1[J]. The Astrophysical Journal Letters Supplement Series, 2011, 194(2): 20. Doi:10.1088/0067-0049/194/2/20 |
| [16] |
Faherty J, Walter F M, Anderson J. The trigonometric parallax of the neutron star Geminga[J]. Astrophysics and Space Science, 2007, 308: 225-230. Doi:10.1007/s10509-007-9368-0 |
| [17] |
Kulkarni S R, Heiles C. The atomic component[M]//Interstellar Processes. Dordrecht: Springer Netherlands, 1987: 87-122. DOI: 10.1007/978-94-009-3861-8_5.
|
| [18] |
Miville-Deschênes M A, Joncas G, Falgarone E, et al. High resolution 21 cm mapping of the Ursa Major Galactic Cirrus: power spectra of the high-latitude HI gas[J]. Astronomy & Astrophysics, 2003, 411(2): 109-121. Doi:10.1051/0004-6361:20031297 |
| [19] |
Koch E W, Rosolowsky E W, Boyden R D, et al. TurbuStat: turbulence statistics in Python[J]. The Astronomical Journal, 2019, 158(1): 1. Doi:10.3847/1538-3881/ab1cc0 |
| [20] |
Armstrong J W, Rickett B J, Spangler S R. Electron density power spectrum in the local interstellar medium[J]. The Astrophysical Journal Letters, 1995, 443: 209. Doi:10.1086/175515 |
| [21] |
Ferrière K. Plasma turbulence in the interstellar medium[J]. Plasma Physics and Controlled Fusion, 2020, 62(1): 014014. Doi:10.1088/1361-6587/ab49eb |
| [22] |
Green D A. A power spectrum analysis of the angular scale of galactic neutral hydrogen emission towards l = 140°, b = 0°[J]. Monthly Notices of the Royal Astronomical Society, 1993, 262(2): 327-342. Doi:10.1093/mnras/262.2.327 |
| [23] |
Dickey J M, Mcclure-Griffiths N M, Stanimirović S, et al. Southern galactic plane survey measurements of the spatial power spectrum of interstellar HI in the inner galaxy[J]. The Astrophysical Journal Letters, 2001, 561(1): 264-271. Doi:10.1086/323409 |
| [24] |
Choudhuri S, Roy N. Turbulent power spectrum in warm and cold neutral medium using the galactic HI 21 cm emission[J]. Monthly Notices of the Royal Astronomical Society, 2019, 483(3): 3437-3443. Doi:10.1093/mnras/sty3342 |
| [25] |
Kalberla P M W, Haud U. Turbulent power distribution in the local interstellar medium[J]. Astronomy & Astrophysics, 2019, 627: A112. Doi:10.1051/0004-6361/201834533 |
| [26] |
Kolmogorov A. The local structure of turbulence in incompressible viscous fluid for very large Reynolds numbers[J]. Proceedings of the Royal Society of London Series A: Mathematical and Physical Sciences, 1991, 434(1890): 9-13. Doi:10.1098/rspa.1991.0075 |
| [27] |
Radhakrishnan V, Murray J D, Lockhart P, et al. The Parkes survey of 21-centimeter absorption in discrete-source spectra. Ⅱ. Galactic 21-centimeter observations in the direction of 35 extragalactic sources[J]. The Astrophysical Journal Letters Supplement Series, 1972, 24: 15. Doi:10.1086/190248 |
| [28] |
Kalberla P M W, Kerp J, Haud U, et al. HI anisotropies associated with radio-polarimetric filaments: steep power spectra associated with cold gas[J]. Astronomy & Astrophysics, 2017, 607: A15. Doi:10.1051/0004-6361/201629627 |
| [29] |
Berezinskii V, Bulanov S, Dogiel V, et al. Astrophysics of cosmic rays[M]. Amsterdam: North Holland, 1990.
|
| [30] |
Nan R D. Five hundred meter aperture spherical radio telescope (FAST)[J]. Science in China Series G, 2006, 49(2): 129-148. Doi:10.1007/s11433-006-0129-9 |
 2024, Vol. 41


