 2026, Vol. 56


2. 中国海洋大学海洋与大气学院,山东 青岛 266100
高空西风急流是位于对流层顶附近相对狭窄且高速流动的强气流带[1]。其中,欧亚-太平洋急流(Eurasian-Pacific jet, EPJ)作为北半球高空西风急流中最强劲的分支,是中纬度大气环流的关键组成部分,其变化对区域乃至全球尺度的天气气候异常具有重要调控作用。EPJ的位置偏移与强度变化一方面直接调控亚太地区的天气气候格局,其南北偏移是亚洲大气环流季节转换的核心标志[2],能够显著影响我国东部夏季降水的空间分布[3-4],且急流增强时东亚冬季风强度同步增强[5];另一方面EPJ可通过波导效应诱发下游北美地区的天气气候异常,急流向极偏移与美国南部大平原夏季极端干旱事件的发生存在显著关联[6],急流的异常变化还可通过改变大气河的登陆位置,进而调控北美风暴路径的演变[7]。
依据热成风原理,中纬度西风急流受热带和极地之间经向温度梯度的支配,急流核的强度和位置与经向温差中心的强度和位置具有很好的对应关系[8]。近几十年来,北极地区地表升温速率是全球平均的4倍以上[9],即北极放大效应,可能导致经向温度梯度发生变化,进而驱动西风急流对应变化。多模式的模拟结果也表明,随着CO2浓度增加,南北半球的纬向平均西风急流在各个季节都呈现增强并向极偏移的趋势[10-11]。但在季节和区域尺度上,急流的变化特征更为复杂,例如北大西洋上空急流在所有季节都存在显著的向极偏移趋势,而欧亚大陆上空急流只在冬季和夏季有明显极移趋势[12-13];在特定区域和季节,例如初夏的亚太地区、晚冬的美洲-大西洋地区和冬/春季的东太平洋,西风急流向赤道方向移动[11, 14]。
现有急流相关研究多聚焦于冬、夏两季,例如急流的气候态特征[15],以及其与冬夏季风[16-17]、降水[18]、风暴轴[19]等天气气候现象的关联;对于过渡季节(春、秋季)和急流完整季节循环的演变过程,目前仍缺乏系统性认知。然而,春、秋季急流的重要性亦不可小觑:春季急流的变异会影响雨带进退与更替[20]、沙尘天气发生[21]、倒春寒过程[22]等;秋季急流的变化则会作用于秋季降水[23]、初冬大气环流调整和温度异常[24]等过程。
值得注意的是,急流的变异并非孤立于单个季节,而是存在显著的季节依赖性,不同季节的急流特征之间存在内在关联与传承效应。例如,东亚温带急流区经向风存在显著的季节连续演变(冬季强北风→春季减弱→夏季弱南风→秋季转北风并增强),并关联东亚大气环流调整、季风爆发等跨季节天气气候过程[25]。这种季节依赖性使得急流的完整季节演变过程呈现出复杂的耦合特征,当前学界对这一方面的认知仍较为薄弱,而季节依赖经验正交函数(Season-reliant empirical orthogonal function, S-EOF)恰好能够精准捕捉变量随季节演变的主导变异模态。
综上,为探究EPJ跨季节演变规律及其影响因子,本研究采用S-EOF方法,系统解析EPJ随季节演变的主导变异模态,并进一步探究调控这些模态的关键海洋-大气环流因子。
1 数据与方法本研究使用美国国家冰雪数据中心(National Snow and Ice Data Center, NSIDC)的海冰密集度(Sea ice concentration, SIC)数据,及第五代欧洲中期天气预报中心(European Centre for Medium-Range Weather Forecasts, ECMWF)大气再分析数据集(Fifth-generation of ECMWF atmospheric reanalysis for climate, ERA5),包括200 hPa纬向风(200 hPa Zonal Wind, U200)、表皮温度(Skin temperature, SKT)、海表面温度(Sea surface temperature, SST)、气温(Temperature, T)、500 hPa位势高度(500 hPa Geopotential height, Z500)以及海平面气压(Sea level pressure, SLP)数据。数据时间跨度为1979—2022年,水平空间分辨率为1°×1°,时间分辨率为逐日。其中,SKT在海洋上表征海表面温度,在陆地上则表征地表温度。
经验正交函数分析是一种广泛应用于气象气候研究的时间序列分析方法[26-28]。该方法能够将复杂变量场的时空变化线性分解为若干正交空间模态及其对应时间主成分的组合。为进一步解析随季节演变的变率模态,Wang和An[29]进一步提出了S-EOF方法。Wu等[30]应用S-EOF方法成功揭示了东亚气候的季节演变特征。同样地,Hou等[31]利用该方法识别出太平洋降水异常的两个主要季节演变模态,并阐明该模态与厄尔尼诺-南方涛动(El Niño-southern oscillation, ENSO)及太平洋年代际振荡的联系。
本研究以200 hPa纬向西风速大于20 m·s-1作为每个格点单日急流事件的判定标准。统计每个格点当月急流发生日数与当月总日数的比值,得到急流发生月频率。再对全年12个月的月频率进行平均,得到急流发生年频率。此外,本研究采用季节平均的U200距平场进行S-EOF分解,即先对各季节所包含月份的月平均资料进行算术平均,得到季节平均场后,再扣除对应季节的气候态得到距平场。
急流轴纬度定义为200 hPa纬向风经向廓线的最大值所在纬度。针对EPJ研究区域,先计算每个经度上纬向风最大值对应的纬度,即该经度的急流轴纬度;再对区域内所有经度的急流轴纬度进行平均,最终得到EPJ区域平均急流轴纬度。
经向温度梯度定义为相邻纬圈的气温差(南减北),正值表示南暖北冷。Niño3.4指数定义为Niño3.4区域(5°S—5°N,170°W—120°W)区域平均SST异常。北极涛动(Arctic oscillation, AO)指数定义为20°N以北区域日平均SLP异常场EOF分解第一模态对应的时间系数[32]。
为聚焦年际变率,所有数据均移除了线性趋势。同时,为确保与主成分(Principal components, PC)时间序列具有可比性,所有指数序列均实施了标准化处理。
2 欧亚-太平洋急流的气候态特征本研究将200 hPa纬向西风大于20 m·s-1的区域定义为高空西风急流区。图 1展示了急流发生频率及U200的气候态分布。如图所示,欧亚-太平洋上空存在一个显著的急流区,该区域西风风速最强、南北摆动范围最小,气候态最大风速可达44 m·s-1。北半球急流主要位于中纬度地区,其高频发生区与强风速区在空间分布上高度一致,表明急流发生频率与急流强度密切相关。急流发生频率最大中心比急流核最大风速中心略偏北约5~10个纬距,急流核最大风速中心位于日本上空,地中海南部也存在一个极大风速中心。

|
( 红框表示EPJ区域。等值线间隔4 m·s-1,起绘值20 m·s-1。The red box denotes the EPJ region. Contour interval is 4 m·s-1, and starting value is 20 m·s-1. ) 图 1 北半球高空西风急流发生频率(填色)及U200(等值线)的年平均气候态分布 Fig. 1 Annual mean climatological distribution of occurrence frequency of the upper-level westerly jet (shaded) and U200 (contours) in the Northern Hemisphere |
本文选取图 1红框标示的区域(20°N—50°N,10°W—150°W)作为EPJ研究区域,包含了急流高频发生区与强风速区。基于该区域内U200风速与急流轴纬度的气候态季节循环特征(见图 2),将全年划分为四个季节:春季(4—5月,AM),急流强度持续减弱,急流轴开始显著北抬;夏季(6—9月, JJAS),急流强度降至全年谷值,急流轴位置达到全年最北;秋季(10—11月,ON),急流强度逐步增强,急流轴开始持续南撤;冬季(12月—次年3月, DJFM),急流强度达到全年峰值,急流轴位置处于全年最南,稳定维持于30°N附近。

|
( 细虚线为12个月平均的年平均值,粗虚线为年平均值±1倍标准差。The thin dashed line denotes the annual mean averaged over 12 months, and the thick dashed lines denote the annual mean ±1 standard deviation. ) 图 2 EPJ区域平均(a) U200风速与(b)急流轴纬度的逐月气候态 Fig. 2 Monthly climatology of averaging (a) U200 wind speed and (b) jet axis latitude in the EPJ region |
通过对EPJ区域的U200距平场进行S-EOF分解[29]得到EPJ区域的高空急流时空主模态特征,其中季节顺序为夏季-秋季-冬季-次年春季。本文以不同季节开始排列四季的顺序设计了S-EOF的分解方案,进行了四组敏感性分析,发现前两个模态反映的急流时空特征基本保持稳定,且该顺序得到的主模态方差贡献最大,因此本文主要基于这一组最优方案的结果进行分析。各模态的方差贡献分布表明(见图 3),前6个模态的累计方差贡献达52%。方差贡献最大的前两个模态中,第一模态最显著且独立于第二模态,其方差贡献为17.53%;第二模态方差贡献为9.62%,尽管与后续模态的独立性未通过显著性检验,但其仍可能具有物理意义并反映EPJ时空变化的复杂性。

|
图 3 基于North经验法则的S-EOF模态显著性检验 Fig. 3 Significance test of the S-EOF modes using North's rule of thumb |
EPJ的S-EOF前两个主模态均反映了欧亚-太平洋急流的年际振荡特征(见图 4(a)和4(f))。PC1的最大值出现在1997年,其余大于一倍标准差的正值年份还有1982、2002、2015年;PC1的最小值发生在1998年,其余超过一倍标准差的负值年份还有1988、1999、2007、2008、2011、2020年。根据ENSO事件时间表[33]可以发现,PC1的正值年份多是ENSO暖位相(厄尔尼诺,El Niño)发展年,而负值年份则多是ENSO冷位相(拉尼娜,La Niña)发展年,表明第一模态与ENSO的发展紧密联系。PC2的最大值也出现在1997年,其余大于一倍标准差的正值年份还有1984、2002、2014、2017年;PC2的最小值发生在1995年,其余超过一倍标准差的负值年份还有1991、1992、2004、2006、2013、2018年。

|
( 等值线表示季节气候态U200,间隔8 m·s-1,起绘值20 m·s-1。红框表示EPJ区域。打点区域通过α=0.05显著性检验。0表示同年,+1表示后一年。Contours denote the seasonal climatology of U200, with an interval of 8 m·s-1 and starting from 20 m·s-1. The red box denotes the EPJ region. Stippled regions are significant at α=0.05 level. Year 0 denotes the same year, and year +1 denotes the subsequent year. ) 图 4 S-EOF前两个模态的标准化主成分时间序列及其回归的U200距平场 Fig. 4 Standardized principal component time series of the first two S-EOF modes and their regressed U200 anomaly fields |
功率谱结果(见图 5)显示,PC1和PC2都以随机波动(接近白噪声,自相关系数接近于0)为主,PC1存在3个弱显著周期(约10.75、5.38、3.07 a),其中年际周期与ENSO典型周期(2—7 a)契合;PC2存在1个弱显著周期(3.91 a)。

|
( 红色虚线为白噪声检验临界值。The red dashed lines denote the critical values of the white noise test. ) 图 5 PC1、PC2的功率谱密度估计 Fig. 5 Power spectral density estimates of PC1 and PC2 |
前两个模态急流随季节演变的空间分布特征分别体现了急流核的南北位置摆动和强度随季节变化的特征。由于PC1和PC2分别回归的四个季节EPJ区域的U200距平场与S-EOF前两个模态特征向量场的空间相关非常高,空间相关系数多达到0.99以上,最小也在0.97,因此这里用更大范围的回归场代替特征向量场(图略)进行分析。
第一模态(见图 4(b)—(e))主要体现了EPJ的经向振荡特征,当PC1呈正相位时,气候态急流南侧西风增强而北侧减弱,表明急流整体向赤道方向南移;反之,急流整体向极地方向北移,反映了急流南北位移的年际振荡特征。该信号自夏季出现并持续至次年春季,其中秋冬季节最为显著。第二模态(见图 4(g)—(j))主要体现了次年春季北太平洋急流核减弱(增强)、急流范围经向扩张(收窄)的变化特征,在其他季节信号不显著。在PC2正值年份的次年春季,北太平洋急流核心区西风减弱,而其南北两侧西风加强,表明急流核强度减弱同时急流范围向南北扩张变宽;反之,急流核强度增强同时急流范围经向收窄。
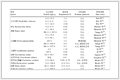
4 欧亚-太平洋急流主模态年际振荡的驱动因子 4.1 秋冬季节急流的经向振荡模态根据热成风原理,中纬度高空西风急流的变化是由南北经向温度梯度驱动的,因此本研究重点关注影响中纬度南北热力差异的下垫面加热因子。第一模态SKT距平的回归场中,同年夏季至次年春季赤道中东太平洋出现显著持续性增暖(见图 6),且PC1与Niño3.4指数呈显著正相关(见表 1,r>0.6,p<0.01),表明第一模态表征的急流年际变化与ENSO事件密切关联,其正(负)相位对应El Niño(La Niña)事件的发展年。值得注意的是,PC1与Niño3.4指数的相关系数在秋、冬季最高,分别达0.88和0.87。对应地,冬季Niño3.4指数回归至U200距平也能得到类似的模态(见图 7)。此外,Niño3.4回归场与PC1回归场(见图 4(b)—(e))高度正相关(见表 1,r>0.9,p=0),表明ENSO发展阶段热带海温异常很可能是秋冬季急流经向位移年际振荡模态的主导因素。当El Niño在秋冬季趋于成熟位相时,赤道地区异常加热增强,使得经向温度梯度的大值区偏南(见图 8),有利于急流轴南侧西风增强、北侧减弱(见图 7),驱动高空西风急流向南偏移;而在La Niña发展年的秋冬季,赤道太平洋海温异常变冷,经向温度梯度的大值区偏北,从而导致急流异常北抬。

|
( 等值线表示季节气候态U200,间隔8 m·s-1,起绘值20 m·s-1。红框表示EPJ区域,黄框表示Niño3.4区。打点区域通过α=0.05显著性检验。0表示同年,+1表示后一年。Contours denote the seasonal climatological U200, with an interval of 8 m·s-1 and starting from 20 m·s-1. The red box denotes the EPJ region, and the yellow box denotes the Niño3.4 region. Stippled regions are significant at α=0.05 level.Year 0 denotes the same year, and year +1 denotes the subsequent year. ) 图 6 PC1回归的各季节SKT距平场 Fig. 6 SKT anomaly fields in each season regressed by PC1 |
|
表 1 PC1与Niño3.4指数的时间相关系数及对应U200回归场的空间相关系数 Table 1 Temporal correlation coefficients between PC1 and the Niño3.4 index, and spatial correlation coefficients between their corresponding regressed U200 fields |

|
( 等值线表示季节气候态U200,间隔8 m·s-1,起绘值20 m·s-1。红框表示EPJ区域。打点区域通过α=0.05显著性检验。0表示同年,+1表示后一年。Contours denote the seasonal climatological U200, with an interval of 8 m·s-1 and starting from 20 m·s-1. The red box denotes the EPJ region. Stippled regions are significant at α=0.05 level.Year 0 denotes the same year, and year +1 denotes the subsequent year. ) 图 7 冬季Niño3.4指数回归的各季节U200距平场 Fig. 7 U200 anomaly fields in each season regressed by the winter Niño3.4 index |

|
( 等值线表示季节气候态U200,间隔8 m·s-1,起绘值20 m·s-1。红框表示EPJ区域。打点区域通过α=0.05显著性检验。0表示同年。Contours denote the seasonal climatological U200, with an interval of 8 m·s-1 and starting from 20 m·s-1. The red box denotes the EPJ region. Stippled regions are significant at α=0.05 level. Year 0 denotes the same year. ) 图 8 冬季Niño3.4指数回归的1 000~200 hPa整层平均经向温度梯度距平场 Fig. 8 1 000~200 hPa vertically averaged meridional temperature gradient anomaly fields regressed by the winter Niño3.4 index |
本研究揭示的秋冬季欧亚-太平洋急流演变特征,与任雪娟和张耀存[34]关于冬季急流异常与海表加热异常关联的研究结论基本吻合;不同之处在于,本研究中东亚-西太平洋上空纬向风异常的范围更广、强度更强,且北太平洋中部的海温异常符号与前人研究相反。上述差异的产生,可能源于研究时段、研究区域及分析方法的不同:在研究时段上,本研究选取1979—2022年,前人研究则为1957—2002年,而2014年之后太平洋年代际振荡的空间模态已发生根本性改变[35],这一背景差异或为结果分歧的重要诱因;在研究区域上,本研究聚焦欧亚-太平洋全域急流的演变特征,前人则侧重东亚沿海至太平洋海域的急流变化;在分析方法上,本研究采用S-EOF分解,更能突出急流的季节依赖特征,而前人采用传统EOF方法。
4.2 次年春季北太平洋急流的南北扩张/收窄振荡模态第二模态的显著信号主要发生在次年春季的北太平洋上空,其他季节信号较弱(见图 4(g)—(j))。在PC2正值年份中,次年春季北太平洋纬向风异常呈现显著的经向三极子结构:急流核心区西风减弱,其南北两侧西风增强(见图 4(j)),反映了急流核强度的减弱(增强)与急流范围的南北扩张(收窄)。
北极通常受低压系统控制,中纬度地区则对应高压系统,即AO正位相模态。AO在冬季位相最为明显[32],且具有一定的季节持续性,其信号可由冬季持续至次年春季(见图 9(a)—(d))。研究表明,晚冬AO信号能够通过激发源自北极、向东南方向传播至亚洲中高纬地区的罗斯贝波列,引发早春地表气温的异常变化[36]。

|
( 等值线表示季节气候态U200,间隔8 m·s-1,起绘值20 m·s-1。打点区域通过α=0.05显著性检验(SIC场α=0.1)。图 9(e)中绿框表示ATI定义范围,其余子图中红框表示EPJ区域。0表示同年,+1表示后一年。Contours denote the seasonal climatological U200, with an interval of 8 m·s-1 and starting from 20 m·s-1. Stippled regions are significant at α=0.05 level (SIC at α=0.1). The green box in Fig. 9 (e) denotes the ATI-defined region, and the red box in the remaining subplots denotes the EPJ region. Year 0 denotes the same year, and year +1 denotes the subsequent year. ) 图 9 PC2回归的同年冬季或次年春季距平场 Fig. 9 Anomaly fields for the same-year winter or subsequent spring regressed by PC2 |
在AO负(正)位相年份的次年春季,大气中激发出向东南方向传播的遥相关异常环流(见图 9(c)),并由此造成中-东西伯利亚地区及其北冰洋沿岸的地表冷(暖)异常(见图 9(e))。这一热力异常会增强(减弱)北太平洋急流区北侧的经向温度梯度,进而驱动急流发生相应的结构调整(见图 4(j))。同期的海平面气压场上也表现出从北冰洋欧亚沿岸-白令海-东北太平洋的“+-+”(“-+-”)波列结构(见图 9(d)),与200 hPa风场异常的波列结构配置相一致(见图 4(j))。
除此之外,AO还可通过调控大气环流驱动北极海冰变异,该过程与地表温度异常具有良好的协同性。北冰洋欧亚大陆沿岸的海冰密集度出现异常增加(减少)的特征(见图 9(f)),与该地区地表温度异常降低(升高)特征(见图 9(e))相一致。当AO处于负位相时,北大西洋东北部海域会出现显著的东北风异常,可能通过冷平流与海冰平流输送,促进巴伦支海-喀拉海与欧亚大陆北部沿海的海温降低与海冰增长[37]。根据海冰-反照率正反馈机制,地表冷却(升温)直接促进海冰增长(减少),而海冰增长(减少)又通过增大反照率进一步强化地表冷却(升温)效应。
为量化热力异常对急流的影响,定义亚洲温度指数(Asia temperature index, ATI)为区域(60°N—80°N,100°E—180°)平均SKT异常(见图 9(e)中绿色方框)。将ATI回归至春季各变量距平场(见图 10),所得空间模态与PC2回归场高度一致,空间相关场均为显著正相关(见表 2)。

|
( 等值线表示春季气候态U200,间隔8 m·s-1,起绘值20 m·s-1。打点区域通过α=0.05显著性检验(SIC场α=0.1)。红框表示EPJ区域,图 10(a)中绿框表示ATI定义范围。Contours denote the seasonal climatological U200, with an interval of 8 m·s-1 and starting from 20 m·s-1. Stippled regions are significant at α=0.05 level (SIC at α=0.1). The red box denotes the EPJ region, and the green box in Fig. 10 (a) denotes the ATI-defined region. ) 图 10 春季ATI回归的春季距平场 Fig. 10 Spring anomaly fields regressed by the spring ATI |
|
|
表 2 春季ATI回归场与PC2次年春季回归场的空间相关系数 Table 2 Spatial correlation coefficients between the spring ATI regression fields and the subsequent spring PC2 regression fields |
相关分析结果显示,PC2与冬季AO指数呈显著负相关(r=-0.40,p<0.01),与次年春季ATI同样呈显著负相关(r=-0.59,p<0.01);而冬季AO指数与次年春季ATI则呈显著正相关(r=0.28,p<0.1)。该结果与上述机制分析结论高度一致,充分证实由AO引发的地表热力异常是驱动第二模态北太平洋急流变化的主导因子。
5 结论与讨论本研究基于1979—2022年的ERA5再分析资料与NSIDC海冰资料,通过S-EOF方法,揭示了EPJ季节演变的主模态特征及其驱动机制(见图 11),强调了过渡季节急流变率研究,进一步深化了中纬度天气气候异常的机理认知,主要结论如下:
第一模态主要表征秋冬季欧亚-太平洋急流的经向振荡,正(负)位相时急流整体南(北)移,其方差贡献为17.53%。该模态正负位相年份分别与El Niño、La Niña发展年相对应,且PC1与Niño3.4指数的秋冬季相关系数高达0.87~0.88(p<0.01),表明该模态由热带太平洋海表温度异常,即ENSO主导。在El Niño(La Niña)发展年,赤道中东太平洋持续增暖(变冷),通过改变对流层经向温度梯度,进而引起急流向南(北)偏移。
第二模态主要表征次年春季北太平洋急流的变化,正位相时急流核心区西风减弱并向南北两侧扩张,负位相时核心区西风增强并向中间收窄,其方差贡献为9.62%。该模态的驱动机制以AO为核心:AO具有季节持续性,冬季信号可延续至次年春季;负(正)位相AO激发向下游西伯利亚-太平洋的遥相关环流,造成中-东西伯利亚冷(暖)异常,增强其南侧的经向温度梯度,进而驱动急流结构调整。同时,AO通过调控大气环流影响北极海冰,经海冰-反照率正反馈强化热力异常。PC2与冬季AO指数和次年春季ATI都呈显著负相关,且冬季AO指数与次年春季ATI呈显著正相关,证实AO引发的热力异常是第二模态的主导因子。

|
图 11 EPJ前两个季节演变模态的特征及其驱动因子示意图 Fig. 11 Schematic diagram of characteristics and driving factors of the first two modes of EPJ seasonal variation |
本研究通过S-EOF方法,从连续的季节演变视角开展分析,而非仅强调单一季节的年际年代际变化,进而突出EPJ变化的季节依赖性,并揭示其季节演变主要模态的热带与中高纬度两种影响路径,即热带海温(ENSO)与高纬温度异常(AO)分别影响EPJ季节演变中急流位置(秋冬季)与强度(春季)的关键物理过程,为中纬度气候异常的跨季节预测提供一定的理论依据。
本研究聚焦的EPJ季节演变主模态以年际周期为主导,且呈现显著的气候内部变率特征,而气候内部变率是导致短期气候预测不确定性的核心因素之一[38]。气候耦合模式能否准确模拟EPJ的季节演变过程,捕捉其核心特征、周期信号及驱动因子,尚需基于多模式集合结果开展系统性评估。未来,在全球变暖背景下,ENSO及其相关环流异常可能发生显著调整[39];同时,北极放大效应[9]可能缩小北极与中纬度的温度梯度,引起AO的变化。ENSO与AO的变异可能进一步调控EPJ的季节演变,其未来变化趋势仍不明确。因此,后续研究将重点依托CMIP6多模式的历史模拟与未来情景数据,系统评估EPJ季节演变主模态在不同变暖情景下的变化特征, 并通过数值模式敏感性试验进一步厘清其内在物理机制。
| [1] |
Rossby C G. On the general circulation of the atmosphere in the middle latitudes[J]. Bulletin of the American Meteorological Society, 1947, 28: 255-279. DOI:10.1175/1520-0477-28.6.255 (  0) |
| [2] |
叶笃正, 陶诗言, 李麦村. 在六月和十月大气环流的突变现象[J]. 气象学报, 1958, 29(4): 249-263. Ye D Z, Tao S Y, Li M C. The abrupt change of circulation over northern hemisphere during June and October[J]. Acta Meteorologica Sinica, 1958, 29(4): 249-263. ( 0) |
| [3] |
Yu R C, Wang B, Zhou T J. Tropospheric cooling and summer monsoon weakening trend over East Asia[J]. Geophysical Research Letters, 2004, 31(22): L22212. ( 0) |
| [4] |
杜银, 张耀存, 谢志清. 东亚副热带西风急流位置变化及其对中国东部夏季降水异常分布的影响[J]. 大气科学, 2009, 33(3): 581-592. Du Y, Zhang Y C, Xie Z Q. Location variation of the East Asia subtropical westerly jet and its effect on the summer precipitation anomaly over eastern China[J]. Chinese Journal of Atmospheric Sciences (in Chinese), 2009, 33(3): 581-592. ( 0) |
| [5] |
况雪源, 张耀存, 刘健. 对流层上层副热带西风急流与东亚冬季风的关系[J]. 高原气象, 2008, 27(4): 701-712. Kuang X Y, Zhang Y C, Liu J. Relationship between subtropical upper-tropospheric westerly jet and East Asian winter monsoon[J]. Plateau Meteorology, 2008, 27(4): 701-712. ( 0) |
| [6] |
Bukovsky M S, McCrary R R, Seth A, et al. A mechanistically credible, poleward shift in warm-season precipitation projected for the U. S. southern Great Plains?[J]. Journal of Climate, 2017, 30(20): 8275-8298. DOI:10.1175/JCLI-D-16-0316.1 ( 0) |
| [7] |
Toride K, Hakim G J. Influence of low-frequency PNA variability on MJO teleconnections to North American atmospheric river activity[J]. Geophysical Research Letters, 2021, 48(13): e2021GL094078. DOI:10.1029/2021GL094078 ( 0) |
| [8] |
况雪源, 张耀存. 东亚副热带西风急流季节变化特征及其热力影响机制探讨[J]. 气象学报, 2006, 64(5): 564-575. Kuang X Y, Zhang Y C. The seasonal variation of the East Asian subtropical westerly jet and its thermal mechanism[J]. Acta Meteorologica Sinica, 2006, 64(5): 564-575. ( 0) |
| [9] |
Rantanen M, Karpechko A Y, Lipponen A, et al. The arctic has warmed nearly four times faster than the globe since 1979[J]. Communications Earth & Environment, 2022, 3: 168. ( 0) |
| [10] |
Lorenz D J, DeWeaver E T. Tropopause height and zonal wind response to global warming in the IPCC scenario integrations[J]. Journal of Geophysical Research: Atmospheres, 2007, 112: D10119. ( 0) |
| [11] |
Simpson I R, Shaw T A, Seager R. A diagnosis of the seasonally and longitudinally varying midlatitude circulation response to global warming[J]. Journal of the Atmospheric Sciences, 2014, 71(7): 2489-2515. DOI:10.1175/JAS-D-13-0325.1 ( 0) |
| [12] |
Pena-Ortiz C, Gallego D, Ribera P, et al. Observed trends in the global jet stream characteristics during the second half of the 20th century[J]. Journal of Geophysical Research: Atmospheres, 2013, 118(7): 2702-2713. DOI:10.1002/jgrd.50305 ( 0) |
| [13] |
Hallam S, Josey S A, McCarthy G D, et al. A regional (land-ocean) comparison of the seasonal to decadal variability of the Northern Hemisphere jet stream 1871-2011[J]. Climate Dynamics, 2022, 59: 1897-1918. DOI:10.1007/s00382-022-06185-5 ( 0) |
| [14] |
Zhou W Y, Leung L R, Lu J. Seasonally and regionally dependent shifts of the atmospheric westerly jets under global warming[J]. Journal of Climate, 2022, 35(16): 5433-5447. DOI:10.1175/JCLI-D-21-0723.1 ( 0) |
| [15] |
Zhang Y C, Kuang X Y, Guo W D, et al. Seasonal evolution of the upper-tropospheric westerly jet core over East Asia[J]. Geophysical Research Letters, 2006, 33(11): L11708. ( 0) |
| [16] |
廖清海, 高守亭, 王会军, 等. 北半球夏季副热带西风急流变异及其对东亚夏季风气候异常的影响[J]. 地球物理学报, 2004, 47(1): 10-18. Liao Q H, Gao S T, Wang H J, et al. Anomalies of the extratropical westerly jet in the north hemisphere and their impacts on East Asian summer monsoon climate anomalies[J]. Chinese Journal of Geophysics (in Chinese), 2004, 47(1): 10-18. ( 0) |
| [17] |
Jhun J G, Lee E J. A new East Asian winter monsoon index and associated characteristics of the winter monsoon[J]. Journal of Climate, 2004, 17(4): 711-726. DOI:10.1175/1520-0442(2004)017<0711:ANEAWM>2.0.CO;2 ( 0) |
| [18] |
Liang X Z, Wang W C. Association between China monsoon rainfall and tropospheric jets[J]. Quarterly Journal of the Royal Meteorological Society, 1998, 124(552): 2597-2623. DOI:10.1002/qj.49712455204 ( 0) |
| [19] |
Athanasiadis P J, Wallace J M, Wettstein J J. Patterns of wintertime jet stream variability and their relation to the storm tracks[J]. Journal of the Atmospheric Sciences, 2010, 67(5): 1361-1381. DOI:10.1175/2009JAS3270.1 ( 0) |
| [20] |
陈艳, 丁一汇, 陶云, 等. 云南雨季开始期东亚副热带西风急流变化和冷空气活动[J]. 热带气象学报, 2015, 31(5): 577-587. Chen Y, Ding Y H, Tao Y, et al. The variation of East Asian subtropical westerly jet and cold air activities during Yunnan rainy season onset[J]. Journal of Tropical Meteorology, 2015, 31(5): 577-587. ( 0) |
| [21] |
李雪, 刘晓东. 中国北方春季沙尘暴活动与高空西风急流变化的联系[J]. 高原气象, 2015, 34(5): 1292-1300. Li X, Liu X D. Relation of spring dust-storm activities in northern China and changes of upper westerlies[J]. Plateau Meteorology, 2015, 34(5): 1292-1300. ( 0) |
| [22] |
张胜才, 杨先荣, 张锦泉, 等. 春季西风急流异常对甘肃极端天气的影响[J]. 中国沙漠, 2012, 32(4): 1089-1094. Zhang S C, Yang X R, Zhang J Q, et al. Influence of abnormal westerly jet on extreme weather in spring in Gansu province[J]. Journal of Desert Research, 2012, 32(4): 1089-1094. ( 0) |
| [23] |
Wang Z Y, Zhou B T. Observed decadal transition in trend of autumn rainfall over central China in the late 1990s[J]. Journal of Climate, 2019, 32(5): 1395-1409. DOI:10.1175/JCLI-D-18-0112.1 ( 0) |
| [24] |
Xu X P, He S P, Zhou B T, et al. The role of mid-latitude westerly jet in the impacts of November Ural blocking on early-winter warmer Arctic-colder Eurasia pattern[J]. Geophysical Research Letters, 2022, 49(16): e2022GL099096. DOI:10.1029/2022GL099096 ( 0) |
| [25] |
张耀存, 王东阡, 任雪娟. 东亚高空温带急流区经向风的季节变化及其与亚洲季风的关系[J]. 气象学报, 2008, 66(5): 707-715. Zhang Y C, Wang D Q, Ren X J. Seasonal variation of meridional wind in temperate jet stream and its relationship to the Asian monsoon[J]. Acta Meteorologica Sinica, 2008, 66(5): 707-715. ( 0) |
| [26] |
Lorenz E N. Empirical Orthogonal Functions and Statistical Weather Prediction[R]. Science Report 1, Cambridge, Massachusetts: Statistical Forecasting Department of Meteorology, 1956.
( 0) |
| [27] |
Lin Z D, Lu R Y. Interannual meridional displacement of the East Asian upper-tropospheric jet stream in summer[J]. Advances in Atmospheric Sciences, 2005, 22(2): 199-211. DOI:10.1007/BF02918509 ( 0) |
| [28] |
Delcambre S C, Lorenz D J, Vimont D J, et al. Diagnosing northern hemisphere jet portrayal in 17 CMIP3 global climate models: twentieth-century intermodel variability[J]. Journal of Climate, 2013, 26(14): 4910-4929. DOI:10.1175/JCLI-D-12-00337.1 ( 0) |
| [29] |
Wang B, An S I. A method for detecting season-dependent modes of climate variability: S-EOF analysis[J]. Geophysical Research Letters, 2005, 32(15): L15710. ( 0) |
| [30] |
Wu B, Zhou T J, Li T. Seasonally evolving dominant interannual variability modes of East Asian climate[J]. Journal of Climate, 2009, 22(11): 2992-3005. DOI:10.1175/2008JCLI2710.1 ( 0) |
| [31] |
Hou X Y, Long D, Hong Y, et al. Seasonal to interannual variability of satellite-based precipitation estimates in the Pacific Ocean associated with ENSO from 1998 to 2014[J]. Remote Sensing, 2016, 8: 833. DOI:10.3390/rs8100833 ( 0) |
| [32] |
Thompson D W J, Wallace J M. The Arctic oscillation signature in the wintertime geopotential height and temperature fields[J]. Geophysical Research Letters, 1998, 25(9): 1297-1300. DOI:10.1029/98GL00950 ( 0) |
| [33] |
赵宗慈, 罗勇, 黄建斌. 全球变暖和厄尔尼诺事件[J]. 气候变化研究进展, 2023, 19(5): 663-666. Zhao Z C, Luo Y, Huang J B. Global warming and El Niño events[J]. Climate Change Research, 2023, 19(5): 663-666. ( 0) |
| [34] |
任雪娟, 张耀存. 冬季200 hPa西太平洋急流异常与海表加热和大气瞬变扰动的关系探讨[J]. 气象学报, 2007, 65(4): 550-560. Ren X J, Zhang Y C. Association of winter western Pacific jet stream anomalies at 200 hPa with ocean surface heating and atmospheric transient eddies[J]. Acta Meteorologica Sinica, 2007, 65(4): 550-560. ( 0) |
| [35] |
Werb B E, Rudnick D L. Remarkable changes in the dominant modes of north Pacific sea surface temperature[J]. Geophysical Research Letters, 2023, 50(4): e2022GL101078. DOI:10.1029/2022GL101078 ( 0) |
| [36] |
Zhou X, Han T T, Wang H J, et al. Enhanced influence of late-winter Arctic oscillation on early spring temperature in North and Northeast Asia[J]. Earth's Future, 2025, 13(1): e2024EF004958. DOI:10.1029/2024EF004958 ( 0) |
| [37] |
Wu B Y, Wang J. Possible impacts of winter Arctic Oscillation on Siberian high, the East Asian winter monsoon and sea-ice extent[J]. Advances in Atmospheric Sciences, 2002, 19(2): 297-320. DOI:10.1007/s00376-002-0024-x ( 0) |
| [38] |
Deser C. Certain uncertainty: The role of internal climate variability in projections of regional climate change and risk management[J]. Earth's Future, 2020, 8(12): e2020EF001854. DOI:10.1029/2020EF001854 ( 0) |
| [39] |
Fredriksen H B, Berner J, Subramanian A C, et al. How does El Niño-Southern Oscillation change under global warming-a first look at CMIP6[J]. Geophysical Research Letters, 2020, 47(22): e2020GL090640. DOI:10.1029/2020GL090640 ( 0) |
2. College of Oceanic and Atmospheric Sciences, Ocean University of China, Qingdao 266100, China