 2023, Vol. 22


2) Faculty of Food Science, Zhejiang Pharmaceutical University, Ningbo 315100, China;
3) Key Laboratory of Animal Protein Food Deep Processing Technology of Zhejiang Province, Ningbo University, Ningbo 315832, China
Fish is delicious and rich in protein, amino acids, high unsaturated fatty acids, and other nutrients essential for our healthy. Therefore, the demand for fish has been increasing because of the growing population size and people's pursuit of a healthy diet. However, the perishability of fish has been a big problem in satisfying the demands of the huge population (Prabhakar et al., 2020). During storage, enzymatic reaction and microbial contamination will result in the quality deterioration of fish (Wu et al., 2019). Hence, monitoring the freshness of fish has become increasingly crucial to consumers, retailers, and industries. Currently, traditional methods of evaluating the spoilage status of fish freshness include sensory assessment, microbial and chemical methods. In recent years, emerging methods such as electrochemistry (Vanegas et al., 2018; Li et al., 2019; Sun et al., 2020), Raman spectroscopy (Argyri et al., 2013; Liu et al., 2021; Zhong et al., 2021), electronic nose, electronic tongue and hyperspectral imaging techniques (Shi et al., 2018, 2019) have also been developed to indicate the fish freshness in the industrial food chain. Those approaches are highly sensitive and simple to use, while they are generally not applicable for real-time determination and require expensive instrument facilities. Thus, it is urgent to develop cost-efficient and non-destructive approaches for assessing the real-time freshness of fish and aquatic products (Mo et al., 2017).
Intelligent packaging methods are novel techniques capable of monitoring the shelf life, quality, safety, pH and gas/water vapor permeability of packaged food through sensors and conveying the information to the customer (Gholampour et al., 2021). Furthermore, intelligent packaging systems could track food status using multiple kinds of smart tags or equipment, time-temperature monitors, integrity indicators, ripeness sensors, biological sensors, and radio frequency sensors (Siro, 2012). The freshness indicator, as a kind of smart package, is a tiny indicating device printed on the package film or it's just like a package label (Chen et al., 2018). The principle of the freshness indicator is to produce a characteristic color reaction with specific reagents and enzyme action using some characteristic compounds produced in the process of food storage to induce the change of the indicator. Therefore, freshness indicators can be categorized into pH-sensing, microbesensing, H2S-sensing indicators and ethylene sensitive indicators. Among them, many pH-sensitive indicators, such as amines indicator (Zhong et al., 2018; Wells et al., 2019; Zhai et al., 2020; Quan et al., 2021) and carbon dioxide indicator (Rukchon et al., 2014; Yusufu et al., 2018; Lee et al., 2019), have received special attention in monitoring the freshness of food in recent years. Such indicator displays an observable color variation when the food pH changes. Consequently, consumers can quickly distinguish between fresh and spoiled food without opening the package, providing consumers with guarantees of the qualities and safeness of the food supply (Sani et al., 2021). Fish can produce volatile nitrogen compounds like TMA, bioamines, NH3 and DMA during the spoilage process owing to microbial decomposition (Efremenko and Mirsky, 2017). The pH value is increased by these compounds, which can be identified by pH-sensitive indicators. There is a few researches on freshness indicators developed for fish. For example, Chun et al. (2014) used a polymeric substrate liquor, which involved the pH-sensing stain bromocresol green (BCG), to produce an easy and low-cost freshness indicator that presented visible color changes following the TVB-N and TMA levels in mackerel fillet. Wells et al. (2019) proposed a novel colorimetry-based extruded plastic film indicating device containing the bromophenol blue to indicate the spoilage of cod. Ezati et al. (2021) reported a color indicator film of shikonin on the foundation of carboxymethyl cellulose and Nano celluloses for monitoring fish freshness, with distinct color change (from pink to bluish-violet) posterior to the 36 h preservation. Additionally, it can be applied in intelligent packaging applications to monitor fish. These sensing indicators comprise two vital parts, i.e., solid carrier and dyes susceptible to pH changes (Liu et al., 2020). Chemical synthetic dyes and natural dyes are frequently used as chromogenic agents for the development of indicators, such as BCG and anthocyanin. However, chemically synthesized indicators have potential hazards such as possible toxicity and dye migration. The structures of the anthocyanin are easily damaged and unstable (Freitas et al., 2020). Thus, exploring more distinctive, safer and effective indicator is still of great demand for intelligent packaging.
The primary goal of the present research is to design a simple and visible intelligent freshness indicator based on two types of protective membrane and pH-sensitive dye BCG to monitor the spoilage of fish. Meanwhile, sea bass (Lateolabrax japonicus) and salmon (Salmo salar) were selected as representatives of high economic value mariculture fish and high nutritional value raw edible fish, respectively, to verify the applicability of indicators in different species of fish. The colour durability and reaction to the TMA of the indicator was determined. Moreover, the association between the color variations of indicators and both fish spoilage in the process of storage under 4℃ was studied. The proposed indicating device is quite important for the fish processing industry and hence might harbor a remarkable practical significance.
2 Materials and Methods 2.1 Materials and ChemicalsBCG and dibutyl phthalate (DBP) were acquired from Sigma-Aldrich (America). TMA was bought from Aladdin Bio-Chemistry Technology Company (Shanghai, China). Cellulose acetate (CA) was acquired from Beijing Solar-Bio Science & Technology Co., Ltd. Acetone, 2-butanone, magnesium oxide (MgO), boric acid (H3BO3), glass petri dishes and filter papers were acquired from Chemical Reagent Company (Shanghai, China). Every chemical was of analytical grade and utilized with no purifying process unless otherwise specified. PTFE (0.22 μm of pore diameter) and TUP membrane were provided by Filter Expert Co. (Zhejiang, China) and Yaoming Plastic Factory (Guangdong, China). Sea bass and salmon were bought from a regional market (Ningbo, China).
2.2 Fabrication of IndicatorFreshness indicator was prepared with a coating of BCG-polymer mix. An aliquot of 0.6 g CA was dissolved in 20 mL of a mix of acetone and butanone (1:1). Posterior to the full dissolution by sonication (KQ5200DE, Kunshan, China), an aliquot of 0.62 g DBP was added (Byrne and Diamond, 2002). Then, 40 mg BCG was added to the mix to make a poly substrate liquor. Next, discs with a diameter of 1.5 cm were punched from filter pater and infiltrated with 15 µL of the polymer matrix solution to infiltrate precut paper discs with an automatic micropipette. They were placed in the darkness for about 60 min to dry. Subsequently, a round self-adhesive paper with a hole (5 mm in diameter) was added to the indicator as a white background. The indicator was assembled by placing the coated spot face down and then inserted between a TUP membrane and a PTFE water-repellent gas osmosis membrane, so as to defend the freshness sensor against excessive moisture and allow gas compounds to go through (Pacquit et al., 2007).
2.3 Colorimetric Response to TMAColor responses of the indicator to TMA were implemented following the reported methods with slight modifications (Lee et al., 2019; Chen et al., 2020). Briefly, assays for emulating fish spoilage were completed at 7 diverse TMA levels of 0, 10, 15, 20, 25, 30 and 35 mg (100 g)−1 via the dilution of a TMA standard solution. Then the indicators were pasted on a standard 24-well plate containing TMA ethanol solution (1 mL) with the back facing upward, reacting at room temperature for 5 min. Pictures of the indicator were collected by a digital camera at the persistent lighting status. The colorimetric parameters of indicators were measured by a colorimeter (NR 110, Shenzhen, China) and MATLAB R2016a (Math Works Inc., USA) software to extract CIELab (L*, a*, b* values) and RGB (red, green, blue) values, respectively. The ΔE was computed via the formula below (Ohta, 1977):
| $ \Delta E = \sqrt {{{(L* - {L_0}*)}^2} + {{(a* - {a_0}*)}^2} + {{(b* - {b_0}*)}^2}}, $ | (1) |
where L*, a* and b* denote the color variables of lightness, chrominance index (red for positive and green for negative) and chrominance index (yellow for positive and blue for negative) posterior to pH sensing separately. L0*, a0* and b0* denote the values collected at 0 min.
The response sensitivity (S) of the samples were calculated by the formula (Liu et al., 2021):
| $ S (\%) = \frac{{\left| {R - {R_0}} \right| + \left| {G - {G_0}} \right| + \left| {B - {B_0}} \right|}}{{R + G + B}} \times 100, $ | (2) |
where R0, G0 and B0 denote the initial values, while R, G and B denote the values after reacting with TMA.
2.4 Color StabilityColor stability of the freshness indicator was measured as a function of time and temperature. The prepared indicator was stored in incubators at −18℃, 4℃, 25℃, and 37℃. The color changes of the indicators were assessed every two days for 14 days and compared with the initial color of the devices. Notably, the portable colorimeter was calibrated with a white ceramic plate before the analysis. The results of ΔE were computed with Eq. (1).
2.5 Function Verification Experiment of MembraneThe efficacy of the bilayer (TUP-PTFE) membrane on the indicator was investigated by detecting the freshness of fish, using indicators without membrane and with only PTFE membrane as the control. Fresh fish samples (20 g) were put into a poly-propylene (PP) box (14.7 cm × 9.8 cm × 4.2 cm) and preserved under 4℃ for 8 d. Three diverse structures of the indicator were put on the perforated packing box. The color parameter values of the indicator were identified via a colorimeter every 2 days. Concurrently, the TVB-N content of fish meat was determined following Chinese Standard (GB 5009.288 – 2016). The difference of indicator color change in three structures and its correlation with fish freshness index were observed. All indices were measured in triplicate.
2.6 Application of Indicator in Fish Freshness Detection 2.6.1 Fish spoilage trialThe live fish was cut into cubes of 150 g after the innards, head, tail, and scales were removed, and then put into a PP box with a lid. The indicator was affixed on each lid with a hole (15 mm diameters) to prevent dye leaching and the influence of the environment inside the package on the indicator. The specimens were stored in a fridge under 4℃ for 8 d and analyzed for product quality regarding TVB-N, pH, TVC and TBA. There were three repeated boxes for each sampling day.
2.6.2 Detection of the TVB-N contentsTVB-N levels were identified via a semi-micro determination of nitrogen approach according to the Chinese Standard (GB 5009.288 – 2016). Four grams of fish sample were placed into an Erlenmeyer flask and mixed with 20 mL of trichloroacetic acid solution (20 g L−1). Then they were kept for 15 min after the Erlenmeyer flask was shaked for 60 s. Afterward, the mixture was subjected to filtration via the filter paper. The filtrate (10 ml) and 5 mL of magnesium oxide suspension (10 g L−1) were subjected to distillation for 5 min via a Kjeldahl distillation unit (91676500, Ningbo Hangjing Biotechnology Company, China). The distillate was absorbed by 10 mL of 20 g L−1 H3BO3 and 5 droplets of mixed indicators (BCG and methyl red), and then subjected to titration with about 0.01 mol L−1 HCL, in which the color changed from blue to pink. TVB-N contents were taken from the average of three measurements. The results are expressed as mg (100 g)−1 and computed via the formula below:
| $ {\text{TVB - N (mg (100 g}}{{\text{)}}^{ - {\text{1}}}}{\text{)}} = \frac{{{\text{(}}{V_1} - {V_2}{\text{)}} \times c \times {\text{14}}}}{{m \times 0.5}} \times 100, $ | (3) |
in which V1 denotes the titration volume for the specimen (mL), V2 denotes the titration volume of blank (mL), while c denotes the real HCl level (mol L−1), m denotes the specimen weight (g).
2.6.3 pH identificationThe pH values of samples were identified following the method proposed by Morsy et al. (2016) with modification. An aliquot of 2.0 g fish flesh was homogenized in 20 mL of distilled water at room temperature and then studied via a digital pH meter (PHS-2F, Leici, Shanghai, China).
2.6.4 Determination of TBA contentsTBA value was colorimetrically determined by the approach of Siu and Draper (1978). Briefly, fish meat (5 g) was minced and then dispersed in 25 mL trichloroacetic acid solutions (20%) and 20 mL of distilled water centrifuging with 8000 r min−1 for 10 min. The filtrate was diluted with distilled water to 50 mL. Then, 5 mL of diluent was blended with 5 mL of 0.02 mol L−1 TBA liquor, and incubated for 90 min under 80℃ to develop a pink color. After cooling to ambient temperature, the absorbance of this mix solution at 532 nm was measured against water as the blank. TBA results were described as milligram malondialdehyde (MDA) equivalents per kilogram of fish meat and obtained by the formula:
| $ {\text{TBA (mg MDA (kg fish meat }}{{\text{)}}^{ - {\text{1}}}}{\text{)}} = {A_{532{\text{nm}}}} \times 7.8. $ | (4) |
The TVC was determined following Chinese Standard (GB 4789.2 – 2016). Twenty-five grams of fish specimen was collected in an aseptic manner, put into aseptic homogenizing bags, and homogenized in 225 mL of 8.5 g L−1 sterile saline for 2 min. Serial decimal dilutions were prepared, and 1 mL of samples were spread over 90 mm Petri dishes with the appropriate dilution ratios. Then, 15 – 20 mL of plate count agar medium was poured to mix. Colonies on the plates were identified posterior to incubation under 30℃ for 72 h. The total numbers of the colony were described as log10 (CFU g−1). Every assay was completed in triplicate.
2.6.6 Colorimetric analysisPictures of the pH-sensing indicator were collected via a smartphone and the chromaticity of the indicator was measured by a portable colorimeter on each indicator during 8 days of storage. The measured values, the Hunter color value, showed L* (lightness), a* (positive express red and negative express green) and b* (positive express yellow and negative express blue). The values were taken from three different points of the indicator and the average values were calculated as the final results. Additionally, the ΔE value was calculated via Eq. (1).
2.7 Statistical AnalysesEach assay was completed three times independently and the results were reported as the average value ± SD. All data were studied via ANOVA in SPSS Statistics (version 23.0, IBM, America), and the Duncan's multiple range test was employed to compare the diversity among the mean values at the 95% confidence level. The association between TVB-N/TVC and ΔE values was identified via Pearson's correlation approach.
3 Results and Discussion 3.1 Colorimetric Response of the Indicator to TMAGenerally, TVB-N such as ammonia and TMA are products of microbial degradation, corresponding to the sensory rejection and odor properties of deteriorated fish. Therefore, TMA was adopted as the typical index of volatile basic compounds produced during the fish spoilage process to examine the feasibility and sensitivity of the indicators. According to the Chinese Standard (GB 2733 – 2015), the limits of TVB-N at sea fish spoilage is 30 mg (100 g) −1. Thus, the color changes of indicators in different freshness ranges were investigated using TMA concentrations of 0 – 15, 20 – 25 and 30 – 35 mg (100 g)−1 simulate the fresh, medium fresh and spoilage state of fish, respectively. The mechanism of the method was that TMA vapor permeates into the indicator to produce an alkali milieu, causing color variation in the pH-sensing dye immobilized into the indicator (Zhang et al., 2019). After the indicator was exposed to TMA ethanol solution for around 5 min, the color variations of the indicators were recorded and the ΔE and S were calculated. As suggested in Fig.1(a), the ΔE and S of the indicator progressively elevated with an elevation in the concentration of TMA standard solution, and there were significant differences among different concentrations (P < 0.05). The S values increased from 14.91% at 5 mg (100 g) −1 TMA to 79.18% at 25 mg (100 g)−1 TMA, and then reached 99.60% at 35 mg (100 g)−1 TMA. Meanwhile, Fig.1(b) presented the visible color variations in the indicator, ranging from yellow to blue. The indicator was yellow at 0 mg (100 g)−1 TMA, revealing the freshness of the fish. Subsequently, it presented a progressive color variation from yellow to green with an elevation of the TMA levels. The color of the indicator became dark green as the TMA value increased to 25 mg (100 g)−1, which indicated the early state of fish spoilage. When the concentration of TMA was over 30 mg (100 g) −1, the color became blue, which was clearly detectable with naked eyes, revealing fish spoilage. Hence, the indicator had high response sensitivity to TMA and presented distinctively different color changes, demonstrating its applicability for freshness monitoring in meat intelligent packaging.

|
Fig. 1 Color response of BCG indicator at TMA 0 – 35 (mg (100 g) −1). (a), ΔE and S values of the indicator; (b), photographs of the indicator. Different superscripts between groups indicated a significant difference (P < 0.05). |
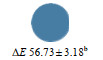
The ability of the indicator to keep up its color until expiring is essential for the freshness evaluation mechanism (Mohammadalinejhad et al., 2020). Moreover, the steadiness of the indicator itself directly affects the color, so it is imperative to assess the stability of the indicator. As revealed in Fig.2, the ΔE values of the indicator increased significantly (P < 0.05) under different temperatures with the extended storage time. The indicator stored at −18℃ and 4℃ exhibited brilliant steadiness with ΔE values lower than 3.5 posterior to 14 days of preservation. Conversely, when the temperature rose to 25℃ and 37℃, the indicator had higher ΔE values relatively at storage period due to the porous structure of filter paper (Zhang et al., 2021). Compared to the indicator preserved under 25℃ and 37℃, the indicator stored at −18℃ and 4℃ showed higher stability. Notably, when kept for 14 days, the changes in the ΔE value were not considerable and lower than 5 at all investigated temperatures. As the color change was only visible when the ΔE value was above 5 (Prietto et al., 2017), it suggested the high stability of the indicator. These results may be explained by multiple causes. Firstly, the porous architecture of CA is capable of entrapping BCG dye in the internal space and afterwards avoiding the dye leaching. Secondly, the design of a three-layer structure of indicator could reduce the influence of moisture in the storage environment. All in all, no remarkable color variations were observed at least after 14 days of storage at different temperatures, suggesting the indicator had high color stability. Therefore, it is suitable for both cold and normal temperature storage of food.

|
Fig. 2 The color stability (ΔE values) of the indicator stored at −18℃, 4℃, 25℃ and 37℃ for 2 weeks. Different letters at the same temperature indicate significant different as determined by Duncan's test (P < 0.05). |
A non-toxic, breathable, and non-interference protective film should be added to the indicator in actual production to facilitate the storage and transportation of fish, and avoid the water vapor generated by the deterioration of fish meat in the process of refrigeration interfering with the identification of the indicator. Color parameters and the pictures of three indicators were listed in Table 1. All three indicators exhibited a color change from yellow to green and afterwards to blue, reflecting that the addition of protective film does not affect the color reaction of the indicator. During the storage process, the indicator without membrane and with only PTFE membrane initially presented a lightyellow color, which afterwards became green on day 2 and blue after 4 days at 4℃. The ΔE values of indicator increased from 0 to 52.73 and 45.85, respectively. The results of simulating the fish spoilage test revealed that fish spoilage appeared when the color of the indicator turned into blue. As indicated in Table 1, the TVB-N value was 23.1 mg (100 g)−1 on day 4. Nonetheless, the unacceptable limit of the TVB-N content for sea fish was 30 mg (100 g)−1, implying that the sample was still fresh at this time. With the addition of the TUP-PTFE membrane of indicator, the results coincided with the color variation of indicators at different TMA solutions. Moreover, a remarkably positive correlation was observed between TVB-N and ΔE values of bilayer indicator (R = 0.852), which was higher than the indicator with no membrane (R = 0.695) and PTFE membrane (R = 0.765). In summary, the addition of bilayer membrane could not only improve the accuracy of the indicator, but also avoid dye leakage polluting the sample.
|
|
Table 1 Color variations of the indicator with different membranes |


The pH values of both samples in the process preservation for 8 days under 4℃ is provided in Fig.3. At the beginning of the preservation period, the initial pH value of sea bass and salmon was 6.55 and 6.30, respectively, which suggested the fresh state of the fish samples. At day 2, the pH values of both fish decreased to 6.51 and 6.21, respectively, followed by a continuous increase. The phenomenon of initial pH decline is induced by muscle glycogen decomposing to produce lactic acid and other acidic substances, and the later increase in pH was induced by alkalization because of the releasing of basic products of protein degradation across the postmortem changes (Lee and Shin, 2019). These results were similar to the previous discoveries (Hassoun and Karoui, 2015).

|
Fig. 3 Changes in pH values of sea bass and salmon during storage time at 4℃. Lower case letters (a – d) indicate significant difference (P < 0.05). |
Animal lipids are oxidized in the preservation process and might influence the meat preservation duration. TBA is a representative indicator of fat oxidation in the process of storage. MDA is a second decomposition product of multiple PUFAs with three or more double bonds and reacts with TBA to produce a steady pink color with a maximum absorption at 532 nm (Chen et al., 2019). Fig.4 showed the TBA of specimens remarkably elevated throughout cold storage (P < 0.05), exhibiting a tendency resembling that of TVB-N. The TBA levels of sea bass and salmon changed from 0.54 and 0.60 mg MDA kg−1 at the beginning of preservation to 1.22 and 0.94 mg MDA kg−1, respectively. Generally, an unacceptable smell will be produced when the TBA value in fish muscle reaches 1 – 2 mg MDA kg−1. It will produce an unacceptable smell and fish has been spoilage (Jia et al., 2021).

|
Fig. 4 Changes in TBA values of sea bass and salmon during storage time at 4℃. Lower case letters (a – c) indicate significant difference (P < 0.05). |
Microbe activities are the primary cause affecting fish freshness. Total viable count (TVC) or aerobic plate counts is an index to identify the degree of microbial contamination. Commonly, 7 log10(CFU g−1) for TVC is deemed to be acceptable for fish products (Ojagh et al., 2010). As observed in Fig.5, the TVC values of the two specimens were remarkably elevated (P < 0.05) in the process of storage under 4℃. The original TVC of sea bass and salmon registered 4.58 and 3.92 log10(CFU g−1), respectively, revealing that the qualities of both samples were satisfactory. The similar discoveries were reported by Liu et al. (2020) with an original value of 3.3 log10(CFU g−1) for sea bass. TVC reached and then exceeded 7 log10(CFU g−1) at day 6 for sea bass with values of 7.34 log10(CFU g−1), and then reached to 7.57 and 7.09 log10(CFU g−1) for both samples at day 8, respectively. Over time, the number of microorganisms in fish was increased. Therefore, the amount of enzymes was also increased, which promoted protein degradation and fat oxidation, resulting in the increase of pH value and TBA value of fish meat. Therefore, the trend of TVC corresponded to pH and TBA changes during storage at 4℃.

|
Fig. 5 Changes in TVC values of sea bass and salmon during storage time at 4℃. Lower case letters (a – d) indicate significant difference (P < 0.05). |
TVB-N is an effective index to evaluate fish freshness. According to the Chinese Standard (GB 2733 – 2015), the unacceptable limit of TVB-N for sea fish is 30 mg (100 g)−1. The results of comparing the ΔE values of the pH-sensing indicator with TVB-N of sea bass and salmon during 8 days of preservation under 4℃ were given in Figs.6(a) and (b), respectively. The TVB-N results of specimens were subsequently elevated following the microbe growth in the process of preservation in correspondence to the increase of ΔE. According to Tassanawatm et al. (2007), ΔE values above 12 reveal that the color belongs to diverse spaces. Fig.6 showed that the initial TVB-N values of both fish were 7.23 and 9.33 mg (100 g)−1, and the initial color of the indicator was yellow without remarkable variations in the first 24 h, indicating that the fish sample was very fresh. The TVB-N values of sea bass and salmon were 13.8 mg (100 g)−1 on day 2. Following the Chinese standard (GB 18108 – 2019), the TVB-N concentration range of superior products is less than 15 mg (100 g)−1, and that of qualified products is less than 30 mg (100 g)−1. Therefore, the fish sample at this time is with a superior condition. Within 3 to 5 days of storage time, the color of the indicator changed from yellow to green, as the ΔE values were 48.14 and 44.64 for sea bass and salmon, respectively. Simultaneously, the TVB-N level was lower than 30 mg (100 g)−1, reflecting that the qualities of the fish specimens were satisfactory. At day 6, the TVB-N value of sea bass reached 38.03 mg (100 g)−1, which exceeded 30 mg (100 g)−1 (Fig.6(a)), while the observation of blue color of the indicator confirms the initiation of spoilage in the samples. Similarly, Fig.6(b) suggested that the distinguished spoilage signs of salmon occurred posterior to day 6. At day 8, the TVB-N attained 96.1 and 52.3 mg (100 g)−1, respectively, revealing the spoilage of the two kinds of fishes. According to the TVB-N value, the color of the indicator was entirely varied and shifted from deep green to blue on day 8 with the ΔE value of 82.99 in sea bass and 73.94 in salmon.

|
Fig. 6 The corresponding changes in ΔE value of the indicator and TVB-N level of sea bass (a) and salmon (b) during storage at 4℃. Lower case letters (a – e) indicate significant difference (P < 0.05). |
Fig.7 presented a real application of the BCG indicator to package sea bass and salmon. In accordance with the color variations, three distinct colors in the pH-sensing indicator were perspicuously related to the TVB-N level of fish during 8 days of storage. In the course of spoilage, volatile bases compounds were generated and the amount of alkaline gas was elevated in the package headspace (Ezati et al., 2019). The colorimetric variables of the indicator were documented by a colorimeter and presented in Tables 2 and 3. On the foundation of the CIElab color system, L* denotes the lightness with a scaling from 100 (white) to 0 (black); the scales for a* and b* variables denote redness (+) to greenness (−) and yellowness (+) to blueness (−), respectively (Majdinasab et al., 2018). As indicated in Tables 2 and 3, L* was positive for all indicators and had a decreasing trend, implying that the glossiness of fish gradually decreased during chill storage time. Additionally, the a* values of sea bass and salmon were −6.85 and −2.39 on the 4th day, respectively, suggesting that the green color displayed a higher intensity in the middle of the storage process. The values documented for b* of the two fishes decreased from 58.57 to −18.95 (Table 2) and from 58.24 to −9.7 (Table 3), respectively, reflecting that the blue color occurred at the end of the storage period. The indicator exhibited visually perceptible color variations across the preservation process and satisfactorily reflected the freshness state of fish. In the fresh phase of fish, the indicator was yellow, indicating that the fish flavor was the best at this time. When the indicators turned to green, it meant that the fish ought to be sold at a discount or be consumed as quickly as possible. The blue color of the BCG indicator reveals the initiation of spoilage in the specimens and the products must be disposed. These results resemble the evident color variations from red to goldenrod and then green in filter paper using a mix of bromothymol blue and methyl red indicator (Chen et al., 2019). This pH-sensing indicator could be used to guide consumers to purchase safe fish products.

|
Fig. 7 Monitoring the freshness and spoilage of sea bass (a) and salmon (b) using the indicator. |
|
|
Table 2 CIElab color parameters for indicator during seabass samples storage at 4℃ |

|
|
Table 3 CIElab color parameters for indicator during salmon samples storage at 4℃ |

While the TVB-N and TVC contents of fish samples exceed the rejection limit, the color of the indicator varied from initial yellow to blue, which confirmed a valid corresponding between indices of fish freshness and color changes of the indicator. Pearson correlation coefficient (R) is frequently employed to evaluate the strength of the correlation. Fig.8 illustrated a highly positive correlation between ΔE and TVB-N (R = 0.880 and 0.879), TVC (R = 0.883 and 0.973) in sea bass and salmon samples during storage at 4℃. Hence, the pH-sensing indicator is suitable for realtime monitoring of the fish freshness. In this regard, Ezati et al. (2019) also verified a high correlation (R = 0.87) between the color change of alizarin immigrated in a starchcellulose paper and rainbow trout fillet freshness at 4℃.

|
Fig. 8 Correlation between TVB-N (a), TVC (b) in fish samples and ΔE of the indicator. |
Herein, a three-layered (TUP/BCG/PTFE) pH-sensitive indicator was successfully developed and applied for detecting the spoilage of refrigerated sea bass and salmon. The three-layer structure contributed to a significant improvement of the moisture resistance, discoloration accuracy and color stability of the indicator while preventing dye migration and ensuring food safety. Model experiments demonstrated that the indicator had a sensitivity to TMA standard solution, with an evident color variation. The color of the indicator depended on the pH and ammonia compound content of their environment, suggesting that the indicator could be used to monitor the freshness and quality of fish in real-time. In the application trial, the color changes of the indicator from yellow to green and afterwards to blue were effortlessly identified by naked eyes as fish became spoiled. Moreover, the ΔE values had high correlations with the spoilage indices (TVB-N, TVC) of both kinds of fish. Thus, the pH-sensitive indicator could guarantee the consumers and retailers know the actual quality of fish, thereby reducing waste and improving the safety of the fish supply.
AcknowledgementThis work was supported by the National Key Research and Development Program (No. 2019YFD0901705).
Argyri, A. A., Jarvis, R. M., Wedge, D., Xu, Y., Panagou, E. Z., Goodacre, R., et al., 2013. A comparison of Raman and FT-IR spectroscopy for the prediction of meat spoilage. Food Control, 29(2): 461-470. DOI:10.1016/j.foodcont.2012.05.040 (  0) 0) |
Byrne, L., Lau, K. T., and Diamond, D., 2002. Monitoring of headspace total volatile basic nitrogen from selected fish species using reflectance spectroscopic measurements of pH sensitive films. Analyst, 127(10): 1338-1341. DOI:10.1039/b206149j ( 0) |
Chen, H., Wu, Y., Chen, Z., Jia, Y., Han, P., and Cheng, C., 2019. Effect of pullulan hydrolysates on the quality of Nile tilapia (Oreochromis niloticus) fillets during ice storage. Journal of Food Processing and Preservation, 43(8): e14043. DOI:10.1111/jfpp.14043 ( 0) |
Chen, H. Z., Zhang, M., Bhandari, B., and Guo, Z., 2018. Applicability of a colorimetric indicator label for monitoring freshness of fresh-cut green bell pepper. Postharvest Biology and Technology, 140: 85-92. DOI:10.1016/j.postharvbio.2018.02.011 ( 0) |
Chen, H. Z., Zhang, M., Bhandari, B., and Yang, C. H., 2019. Development of a novel colorimetric food package label for monitoring lean pork freshness. LWT – Food Science and Technology, 99: 43-49. DOI:10.1016/j.lwt.2018.09.048 ( 0) |
Chen, H. Z., Zhang, M., Bhandari, B., and Yang, C. H., 2020. Novel pH-sensitive films containing curcumin and anthocyanins to monitor fish freshness. Food Hydrocolloids, 100: 105438. DOI:10.1016/j.foodhyd.2019.105438 ( 0) |
Chun, H. N., Kim, B., and Shin, H. S., 2014. Evaluation of a freshness indicator for quality of fish products during storage. Food Science and Biotechnology, 23(5): 1719-1725. DOI:10.1007/s10068-014-0235-9 ( 0) |
Efremenko, Y., and Mirsky, V. M., 2017. Virtual sensor array consisting of a single sensor element with variable affinity: An application for analysis of fish freshness. Sensors and Actuators B: Chemical, 241: 652-657. DOI:10.1016/j.snb.2016.10.126 ( 0) |
Ezati, P., Priyadarshi, R., Bang, Y. J., and Rhim, J. W., 2021. CMC and CNF-based intelligent pH-responsive color indicator films integrated with shikonin to monitor fish freshness. Food Control, 126: 108046. DOI:10.1016/j.foodcont.2021.108046 ( 0) |
Ezati, P., Tajik, H., and Moradi, M., 2019. Fabrication and characterization of alizarin colorimetric indicator based on cellulose-chitosan to monitor the freshness of minced beef. Sensors and Actuators B: Chemical, 285: 519-528. DOI:10.1016/j.snb.2019.01.089 ( 0) |
Ezati, P., Tajik, H., Moradi, M., and Molaei, R., 2019. Intelligent pH-sensitive indicator based on starch-cellulose and alizarin dye to track freshness of rainbow trout fillet. International Journal of Biological Macromolecules, 132: 157-165. DOI:10.1016/j.ijbiomac.2019.03.173 ( 0) |
Freitas, P. A. V., Silva, R. R. A., de Oliveira, T. V., Soares, R. R. A., Junior, N. S., Moraes, A. R. F., et al., 2020. Development and characterization of intelligent cellulose acetate-based films using red cabbage extract for visual detection of volatile bases. LWT – Food Science and Technology, 132: 109780. DOI:10.1016/j.lwt.2020.109780 ( 0) |
Gholampour, S., Jalali, H., Zhiani, R., Rashidi, H., and Motavalizadehkakhky, A., 2021. Biogenic amines to tune the LSPR adsorption peak of gold NPs for intelligent packaging application. Inorganic Chemistry Communications, 123: 108334. DOI:10.1016/j.inoche.2020.108334 ( 0) |
Hassoun, A., and Karoui, R., 2015. Front-face fluorescence spectroscopy coupled with chemometric tools for monitoring fish freshness stored under different refrigerated conditions. Food Control, 54: 240-249. DOI:10.1016/j.foodcont.2015.01.042 ( 0) |
Jia, Z., Shi, C., Zhang, J., and Ji, Z., 2021. Comparison of freshness prediction method for salmon fillet during different storage temperatures. Journal of the Science of Food and Agriculture, 101(12): 4987-4994. DOI:10.1002/jsfa.11142 ( 0) |
Lee, E. J., and Shin, H. S., 2019. Development of a freshness indicator for monitoring the quality of beef during storage. Food Science and Biotechnology, 28(6): 1899-1906. DOI:10.1007/s10068-019-00633-5 ( 0) |
Lee, K., Baek, S., Kim, D., and Seo, J., 2019. A freshness indicator for monitoring chicken-breast spoilage using a Tyvek® sheet and RGB color analysis. Food Packaging and Shelf Life, 19: 40-46. DOI:10.1016/j.fpsl.2018.11.016 ( 0) |
Lee, K., Park, H., Baek, S., Han, S., Kim, D., Chung, S., et al., 2019. Colorimetric array freshness indicator and digital color processing for monitoring the freshness of packaged chicken breast. Food Packaging and Shelf Life, 22: 100408. DOI:10.1016/j.fpsl.2019.100408 ( 0) |
Li, C., Hao, J., and Wu, K., 2019. Triethylamine-controlled CuBTC frameworks for electrochemical sensing fish freshness. Analytica Chimica Acta, 1085: 68-74. DOI:10.1016/j.aca.2019.07.064 ( 0) |
Liu, D., Cui, Z., Shang, M., and Zhong, Y., 2021. A colorimetric film based on polyvinyl alcohol/sodium carboxymethyl cellulose incorporated with red cabbage anthocyanin for monitoring pork freshness. Food Packaging and Shelf Life, 28: 100641. DOI:10.1016/j.fpsl.2021.100641 ( 0) |
Liu, J., Lan, W., Sun, X., and Xie, J., 2020. Effects of chitosan grafted phenolic acid coating on microbiological, physicochemical and protein changes of sea bass (Lateolabrax japonicus) during refrigerated storage. Journal of Food Science, 85(8): 2506-2515. DOI:10.1111/1750-3841.15329 ( 0) |
Liu, X., Chen, K., Wang, J., Wang, Y., Tang, Y., Gao, X., et al., 2020. An on-package colorimetric sensing label based on a solgel matrix for fish freshness monitoring. Food Chemistry, 307: 125580. DOI:10.1016/j.foodchem.2019.125580 ( 0) |
Liu, Z., Huang, M., Zhu, Q., Qin, J., and Kim, M. S., 2021. Nondestructive freshness evaluation of intact prawns (Fenneropenaeus chinensis) using line-scan spatially offset Raman spectroscopy. Food Control, 126: 108054. DOI:10.1016/j.foodcont.2021.108054 ( 0) |
Majdinasab, M., Hosseini, S. M. H., Sepidname, M., Negahdarifar, M., and Li, P., 2018. Development of a novel colorimetric sensor based on alginate beads for monitoring rainbow trout spoilage. Journal of Food Science and Technology, 55(5): 1695-1704. DOI:10.1007/s13197-018-3082-5 ( 0) |
Mo, R., Quan, Q., Li, T., Yuan, Q., Su, T., Yan, X., et al., 2017. An intelligent label for freshness of fish based on a porous anodic aluminum membrane and bromocresol green. ChemistrySelect, 2(28): 8779-8784. DOI:10.1002/slct.201701313 ( 0) |
Mohammadalinejhad, S., Almasi, H., and Moradi, M., 2020. Immobilization of Echium amoenum anthocyanins into bacterial cellulose film: A novel colorimetric pH indicator for freshness/ spoilage monitoring of shrimp. Food Control, 113: 107169. DOI:10.1016/j.foodcont.2020.107169 ( 0) |
Morsy, M. K., Zór, K., Kostesha, N., Alstrøm, T. S., Heiskanen, A., El-Tanahi, H., et al., 2016. Development and validation of a colorimetric sensor array for fish spoilage monitoring. Food Control, 60: 346-352. DOI:10.1016/j.foodcont.2015.07.038 ( 0) |
Ohta, N., 1977. Correspondence between CIELAB and CIELUV color differences. Color Research & Application, 2(4): 178-182. ( 0) |
Ojagh, S. M., Rezaei, M., Razavi, S. H., and Hosseini, S. M. H., 2010. Effect of chitosan coatings enriched with cinnamon oil on the quality of refrigerated rainbow trout. Food Chemistry, 120(1): 193-198. DOI:10.1016/j.foodchem.2009.10.006 ( 0) |
Pacquit, A., Frisby, J., Diamond, D., Lau, K., Farrell, A., Quilty, B., et al., 2007. Development of a smart packaging for the monitoring of fish spoilage. Food Chemistry, 102(2): 466-470. DOI:10.1016/j.foodchem.2006.05.052 ( 0) |
Prabhakar, P. K., Vatsa, S., Srivastav, P. P., and Pathak, S. S., 2020. A comprehensive review on freshness of fish and assessment: Analytical methods and recent innovations. Food Research International, 133: 109157. DOI:10.1016/j.foodres.2020.109157 ( 0) |
Prietto, L., Mirapalhete, T. C., Pinto, V. Z., Hoffmann, J. F., Vanier, N. L., Lim, L. T., et al., 2017. pH-sensitive films containing anthocyanins extracted from black bean seed coat and red cabbage. LWT – Food Science and Technology, 80: 492-500. DOI:10.1016/j.lwt.2017.03.006 ( 0) |
Quan, Z., He, H., Zhou, H., Liang, Y., Wang, L., Tian, S., et al., 2021. Designing an intelligent nanofiber ratiometric fluorescent sensor sensitive to biogenic amines for detecting the freshness of shrimp and pork. Sensors and Actuators B: Chemical, 333: 129535. DOI:10.1016/j.snb.2021.129535 ( 0) |
Rukchon, C., Nopwinyuwong, A., Trevanich, S., Jinkarn, T., and Suppakul, P., 2014. Development of a food spoilage indicator for monitoring freshness of skinless chicken breast. Talanta, 130: 547-554. DOI:10.1016/j.talanta.2014.07.048 ( 0) |
Sani, M. A., Tavassoli, M., Hamishehkar, H., and McClements, D. J., 2021. Carbohydrate-based films containing pH-sensitive red barberry anthocyanins: Application as biodegradable smart food packaging materials. Carbohydrate Polymers, 255: 117488. DOI:10.1016/j.carbpol.2020.117488 ( 0) |
Shi, C., Qian, J., Zhu, W., Liu, H., Han, S., and Yang, X., 2019. Nondestructive determination of freshness indicators for tilapia fillets stored at various temperatures by hyperspectral imaging coupled with RBF neural networks. Food Chemistry, 275: 497-503. DOI:10.1016/j.foodchem.2018.09.092 ( 0) |
Shi, C., Yang, X., Han, S., Fan, B., Zhao, Z., Wu, X., et al., 2018. Nondestructive prediction of tilapia fillet freshness during storage at different temperatures by integrating an electronic nose and tongue with radial basis function neural networks. Food and Bioprocess Technology, 11(10): 1840-1852. DOI:10.1007/s11947-018-2148-8 ( 0) |
Siró, I., 2012. Active and intelligent packaging of food. In: Progress in Food Preservation. Bhat, R., et al., eds., John Wiley & Sons Ltd., Chichester, 23-48.
( 0) |
Siu, G. M., and Draper, H., 1978. A survey of the malonaldehyde content of retail meats and fish. Journal of Food Science, 43(4): 1147-1149. DOI:10.1111/j.1365-2621.1978.tb15256.x ( 0) |
Sun, J., Zhang, R., Zhang, Y., Liang, Q., Zhang, F., Xu, P., et al., 2020. Evaluation of fish freshness using impedance spectroscopy based on the characteristic parameter of orthogonal direction difference. Journal of the Science of Food and Agriculture, 100(11): 4124-4131. DOI:10.1002/jsfa.10435 ( 0) |
Tassanawatm, S., Phandee, A., Magaraphan, R., Nithitanakul, M., and Manuspiya, H., 2007. pH-sensitive PPClay nanocomposites for beverage smart packaging. Proceedings of the 2nd IEEE International Conference on Nano/Micro Engineered and Molecular Systems. IEEE NEMS 2007, 478-482.
( 0) |
Vanegas, D. C., Patino, L., Mendez, C., Oliveira, D. A., Torres, A. M., Gomes, C. L., et al., 2018. Laser scribed graphene biosensor for detection of biogenic amines in food samples using locally sourced materials. Biosensors (Basel), 8(2): 42. DOI:10.3390/bios8020042 ( 0) |
Wells, N., Yusufu, D., and Mills, A., 2019. Colourimetric plastic film indicator for the detection of the volatile basic nitrogen compounds associated with fish spoilage. Talanta, 194: 830-836. DOI:10.1016/j.talanta.2018.11.020 ( 0) |
Wu, L., Pu, H., and Sun, D. W., 2019. Novel techniques for evaluating freshness quality attributes of fish: A review of recent developments. Trends in Food Science & Technology, 83: 259-273. DOI:10.1016/j.tifs.2018.12.002 ( 0) |
Yusufu, D., Wang, C., and Mills, A., 2018. Evaluation of an 'After Opening Freshness (AOF)' label for packaged ham. Food Packaging and Shelf Life, 17: 107-113. DOI:10.1016/j.fpsl.2018.06.002 ( 0) |
Zhai, X., Zou, X., Shi, J., Huang, X., Sun, Z., Li, Z., et al., 2020. Amine-responsive bilayer films with improved illumination stability and electrochemical writing property for visual monitoring of meat spoilage. Sensors and Actuators B: Chemical, 302: 127130. DOI:10.1016/j.snb.2019.127130 ( 0) |
Zhang, J., Huang, X., Shi, J., Liu, L., Zhang, X., Zou, X., et al., 2021. A visual bi-layer indicator based on roselle anthocyanins with high hydrophobic property for monitoring griskin freshness. Food Chemistry, 355: 129573. DOI:10.1016/j.foodchem.2021.129573 ( 0) |
Zhang, J., Zou, X., Zhai, X., Huang, X., Jiang, C., and Holmes, M., 2019. Preparation of an intelligent pH film based on biodegradable polymers and roselle anthocyanins for monitoring pork freshness. Food Chemistry, 272: 306-312. DOI:10.1016/j.foodchem.2018.08.041 ( 0) |
Zhong, N., Li, Y. P., Li, X. Z., Guo, C. X., and Wu, T., 2021. Accurate prediction of salmon storage time using improved Raman spectroscopy. Journal of Food Engineering, 293: 110378. DOI:10.1016/j.jfoodeng.2020.110378 ( 0) |
Zhong, X., Huo, D., Fa, H., Luo, X., Wang, Y., Zhao, Y., et al., 2018. Rapid and ultrasensitive detection of biogenic amines with colorimetric sensor array. Sensors and Actuators B: Chemical, 274: 464-471. DOI:10.1016/j.snb.2018.07.129 ( 0) |