2) Key Laboratory of Eutrophication and Red Tide Prevention of Guangdong Higher Education Institutes, Jinan University, Guangzhou 510632, China;
3) Southern Marine Science and Engineering Guangdong Laboratory, Zhuhai 519000, China
The mitochondrial genome (mitogenome), ranging from 14 to 20 kb in length, has a smaller size compared to the complete nuclear genome sequence (Boore, 1999; Shi et al., 2013; Carvalho et al., 2016). It usually encodes protein-coding genes (PCGs), transfer RNA (tRNA) genes, and ribosomal RNA (rRNA) genes (Wolstenholme, 1992; Lashari et al., 2016). The control region (CR) in fish mitogenomes is a non-coding region that plays a vital role in gene transcription (Benson, 1999). Due to the stabilization of genetic recombination and high evolution rate, the sequence and structure of mitogenomes is widely used for the study of molecular evolution, phylogenetic analysis, and population genetics (Simon et al., 2006; Salvato et al., 2008).
The growing research on the sequence of mitogenomes has accumulated a multitude of data over the last decade. To date, dozens of mitogenome sequences of the order Siluriformes are publicly available from NCBI. Each of these mitogenome sequences has a similar molecular size and a large quantity of overlaps. However, information regarding mitogenomes of the family Ariidae among Siluriformes has been lacking, and the available sequences showed genetic differentiation. Differences in gene content and special structures implicated the presence of varied among Ariidae.
Forty families with about 490 genera and about 3730 species live in the waters worldwide so far (Nelson et al., 2016). Of these, 11 families with about 29 genera and about 113 species occur in Chinese waters (Chu et al., 1999). Most Ariidae are distributed in tropical and temperate areas. They can be found in estuarine regions, coastal rivers and sea areas (Marceniuk and Menezes, 2007). The sea catfish, Arius dispar (Herre, 1926), is abundant in Southeast Asia, and shows economic advantage (Santos and Quilang, 2011). Most studies of A. dispar have been focused on morphological analysis.
In this study, the complete mitogenome of A. dispar was first determined. We described the gene structure and composition including nucleotide composition, characteristics of PCGs, and characteristics of RNA secondary structure. The phylogenetic analysis was performed to provide information on the taxonomy and phylogeny of Arius species. We hope these studies will provide genetic information on species identification, molecular evolution, genetic diversity, and useful molecular data for future studies in Siluriformes.
2 Materials and Methods 2.1 Samples and DNA ExtractionSpecimens of sea catfishes, A. dispar, were collected from Pearl River Estuary (21˚57xN, 133˚47xE), China, in April 2016. All collections were stored in 95% ethanol at room temperature in the field and then preserved at -80 ℃ in the laboratory. Total genomic DNA was obtained from dorsal muscle tissue of the collected samples using an Animal Tissue Genomic DNA Extraction Kit (Sangon Biotech, China). Extracted DNA was used as a PCR template for sequencing reactions.
2.2 PCR Amplification and SequencingPrimer sets for PCR amplification were designed according to the conserved mitogenome sequences of Tachysurus nitidus (Sauvage & Dabry de Thiersant, 1874) (GenBank: KC822643.1) (Table 1). All PCR amplifications were performed using LA Taq DNA polymerase (Takara, China) with the following cycling conditions: an initial denaturation for 3 min at 95℃, followed by 35 cycles of denaturation for 30 s at 95℃, annealing for 30 s at 55℃, and elongation for 1-5 min at 72℃. All PCR products were confirmed on a 1.5% agarose gel and then sequenced using a 3730XL DNA Analyzer at the Beijing Genomics Institute.
|
|
Table 1 Primer pairs used for PCR amplification of A. dispar mitogenome |
The complete sequences were checked manually after assembly using the Seqman program within Lasergene software (Burland, 2000a, 2000b). The location of the two rRNA and 13 PCGs were determined using DOGMA software (Wyman et al., 2004). All tRNA genes were recognized by tRNA Scan-SE 1.21 (Schattner et al., 2005). Tandem repeats within the control region were identified using Tandem Repeats Finder program (Benson, 1999). The codon usage of the 13 PCGs was summarized using MEGA 5 software (Tamura et al., 2011). Potential secondary structures of tRNA genes and the origin of light strand replication (OL) were analyzed using RNAstructure software (Reuter and Mathews, 2010). The differences of nucleotide composition in the complete mitogenome, PCGs, rRNAs, tRNAs and control regions were measured according to AT-skew [(A-T)/(A+T)] and GC-skew [(G-C)/(G+C)] values. The complete mitogenome of A. dispar was deposited in the GenBank database (GenBank accession number: MH460877.1).
2.4 Phylogenetic AnalysisA total of 42 Siluriformes mitogenomes were obtained from GenBank (Table 2). All of the 12 concatenated PCGs of mitogenomes except ND6 from these species were used to investigate phylogenetic relationships. Phylogenetic analysis was performed based on the Maximum Likelihood (ML) and Bayesian inference (BI) methods, which used raxmlGUI software and MrBayes v3.2.4 software, respectively (Ronquist et al., 2012; Silvestro and Michalak, 2012). The mitogenomes of Gymnotiformes species, Apteronotus albifrons (Linnaeus, 1766) (AB054132.1), Brachyhypopomus occidentalis (Regan, 1914) (AP011570.1) and Gymnotus carapo (Linnaeus, 1758) (AP011979.1), were used as outgroups. The mitochondrial genes of A. dispar were aligned separately with Clustal X (Thompson et al., 2002). The model Modeltest 3.7 based on Akaike's information criterion (AIC), was chosen to determine the evolution of nucleotide substitution (Nylander, 2004). According to results, GTR + I + G was selected as the best model for nucleotide sequences analysis. A total of 1000 generations were sampled in one million generations by four chains, and 25% of the initial trees were discarded as burn-in. In this study, the average standard deviation of split frequencies was kept below 0.01. ML analysis was run with 1000 replicates via a bootstrap test. The phylogenetic trees were constructed with FigTree v1.4.3.
|
|
Table 2 Summary of the base composition of the mitogenomes at each codon position of the concatenated the 13 PCGs across 17 Siluriformes species |
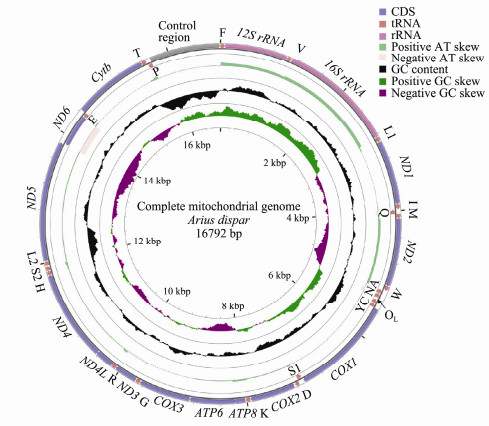
The complete mitogenome of A. dispar was 16792 bp in length. It encoded 13 PCGs, two rRNA genes (12S rRNA and 16S rRNA), 22 tRNA genes, and two non-coding regions. The non-coding regions are identified as CR and the origin of light strand replication (OL) (Fig. 1 and Table 3). Among these genes, 28 genes were encoded on the heavy strand (H-strand), whereas the other 9 genes were transcribed on the light strand (L-strand). These 9 genes included one PCG (ND6) and 8 tRNA genes (tRNAAla, tRNAAsn, tRNACys, tRNAGln, tRNAGlu, tRNAPro, tRNASer and tRNATyr). Similar distribution characteristics of the 37 encoded genes can also been found in other teleosts (Nakatani et al., 2011; Wang et al., 2016a).
|
Fig. 1 Circular map of the mitogenome of A. dispar. Transfer RNAs are designated by the IUPAC-IUB single letter amino acid codes (L1, trnLCUN; L2, trnLUUR; S1, trnSAGN; S2, trnSUCN). Labeling from the outside to inside circle: genes encoded on the heavy strand, genes encoded on the light strand, positive or negative AT skew[(A-T)/(A+T)], GC content (The peaks out/inside the circle indicate values higher or lower than average GC content, respectively.), GC skew [(G-C)/(G+C)], respectively |
|
|
Table 3 Characteristic constituents of the mitochondrial genome of A. dispar |
A total of 33 bp overlaps were found at 10 gene junctions. Most of them were below 5 bp in length, except for ATPase 8-ATPase6 (10 bp) and ND4L-ND4 (7 bp). In addition to the CR, there were 12 intergenic spacers found in mitogenomes. Among them, the OL fragment was found to be the longest intergenic spacer sequence (31 bp), located between tRNAAsn and tRNACys. In addition, the location of OL in other reported species of Siluriformes was the same (Peng et al., 2006; Jondeung et al., 2007; Nakatani et al., 2011).
The H-strand of the A. dispar mitogenome contained 29.60% A, 15.35% G, 29.68% C, and 25.37% T. The A + T content was 54.97%, which was higher than the C + T content (Table 2). This phenomenon of strand asymmetry was common in teleost fish (Yu et al., 2016; Cui et al., 2017). The length of the CR was determined to be 1078 bp and was located between tRNAPro and tRNAPhe. It possessed the highest A + T content (62.89%).
We measured the base-skew (AT-skew and GC-skew) of the H-strand in the mitogenome. The AT-skew value was 0.08 whereas the GC-skew value was -0.32 (Table 2), revealing that the genome composition was A-skewed and strongly C-skewed. The other two Ariidae species (Occidentarius platypogon (Günther, 1864) and Arius arius (Hamilton, 1822) showed similar AT-skew and GC-skew values. Additionally, the AT-skew values for the 17 reported Siluriformes mitogenomes were positive, whereas the GC-skew values were all negative, indicating more Ts and Cs existed within the whole mitogenomes of these 17 Siluriformes species (Rodiles-Hernandez et al., 2010; Wei et al., 2016).
3.2 Transfer and Ribosomal RNA GenesThe A. dispar mitogenome contained 22 tRNA and two rRNA, scattered throughout the mitogenome. The length of tRNA ranged from 66 bp (tRNACys) to 75 bp (tRNALeu). The secondary structures of tRNASer2 lack the dihydrouridine (DHU) arm instead of a simple loop. This was commonly observed in many teleost fish mitogenomes (Roques et al., 2006; Wang et al., 2016a; Llera-Herrera et al., 2017). With the exception of tRNASer2, the other 21 tRNA genes could form the typical clover-leaf structures. The length of the anticodon loop was 7 bp, with the exception of tRNAGlu, tRNAThr, and tRNAVal (9 bp). According to the secondary structures, a total of 37 unmatched base pairs were detected in 13 tRNAs. All of them were G-U pairs, appearing in the acceptor stems, TΨC stems, DHU stems, and anticodon stems.
Among the total tRNAs, 14 of them were coded on the H-strand, and the remaining 8 tRNA were coded on the L-strand. The sequence of all the H-strand tRNA showed a high content of A + T, except for tRNACys (48.48%), tRNASer (47.89%), and tRNAThr (43.06%). The AT-skew value of total tRNA was positive (0.06), whereas the GC-skew value was negative (-0.02).
The lengths of the two rRNAs, 12S rRNA and 16S rRNA, were 958 bp and 1758 bp, respectively. Both were located on the H-strand, but the 12S rRNA was located between tRNAPhe and tRNAVal, while the 16S rRNA was found between tRNAVal and tRNALeu1. This pattern displayed the same locational trend as in other teleost fishes (Gong et al., 2015; Cui et al., 2017). The A+T content of the 16S rRNA (55.58%) was a slightly higher than that of 12S RNA (50.73%). A similar phenomenon appeared in two other Ariidae species: O. platypogon (55.14% in 16S rRNA and 52.15% in 12S rRNA) and A. arius (53.85% in 16S rRNA and 50.73% in 12S rRNA) (Wang et al., 2016a; Llera-Herrera et al., 2017). Similar to tRNA, the sequences of rRNA exhibit a positive AT-skew value (0.24) and a negative GC-skew value (-0.15).
3.3 Protein-Coding GenesAll but one PCG (ND6), from the A. dispar mitogenome, were coded on the H-strand. The total length of 13 PCGs was 11407 bp, ranging from 297 bp (ND4L) to 1827 bp (ND5) and accounting for 67.93% of the entire mitogenome sequence. All of the PCGs had the same start codon (ATG), with the exception of COX1 (GTG). This special phenomenon existed in other teleost fishes (Moreira et al., 2016; Song et al., 2016; Wei et al., 2016). Most of the PCGs had the complete stop codons TAA (ATP6, ATP8, COX1, ND1 and ND4L) or TAG (ND2 and ND3). The incomplete stop codon (T) was utilized in other 4 PCGs (COX2, COX3, Cytb and ND4). The incomplete stop codon was presumed to be completed after post-transcriptional polyadenylation, and it was commonly used in metazoan mitogenomes (Ojala et al., 1981; Wolstenholme, 1992).
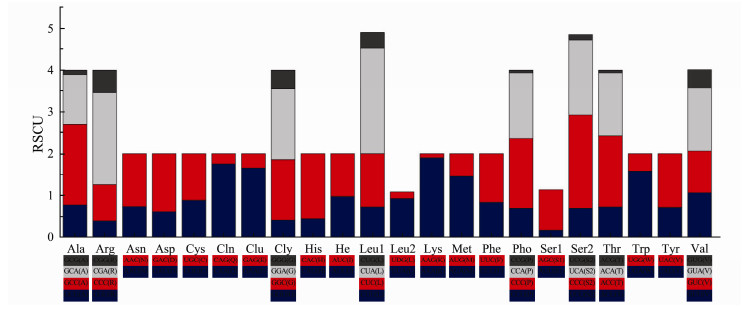
Among the 3792 codons of the entire set of PCGs, Leu 1 (14.03%) was the most commonly used amino acid. In addition, 8 amino acids (Ala, Arg, Gly, Leu1, Pro, Ser2, Thr and Val) were coded by four different codons, while the remainders were coded by two different codons. All 22 amino acids had relatively synonymous codon usage, which was summarized in Fig. 2.
|
Fig. 2 The relative synonymous codon usage (RSCU) in the mitogenomes of A. dispar |
The A+T content of the total set of PCGs in A. dispar was detected to be 54.80%. Among them, ATP8 (61.31%) had the highest A+T content. The AT-skew and GC-skew values of the PCGs of A. dispar mitogenome are shown in Fig. 3. In addition to the 5 PCGs (COX1, COX3, ND3, ND5 and ND6), all the other PCGs had a positive ATskew value. Different to AT-skew value, the GC-skew values were all negative, indicating that Cs are more frequently used against Gs in PCGs. The relatively stable values of ATskew and GC-skew can be found in other two Ariidae species (O. platypogon and A. arius) (Wang et al., 2016a; Llera-Herrera et al., 2017).

|
Fig. 3 Graphical illustration showing the AT and GC skew in the PCGs of the mitochondrial genome of A. dispar |
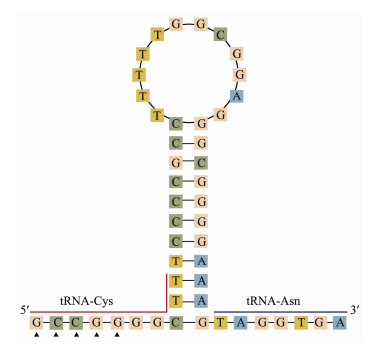
The non-coding regions of A. dispar included the CR, OL and several intergenic spacers. Among the 11 intergenic spacers, the longest was located between tRNAAsp and COX2 (14 bp). The CR (1078 bp) was highest in length, followed by the OL (48 bp). In A. dispar, OL was located between tRNAAsn and tRNACys, and can be folded into a hairpin secondary structure. The putative structural elements of OL are shown in Fig. 4. Besides, the conserved motif, 5'-GCCGG-3', was found at the base of the stem with the tRNACys, which was also found in other Siluriformes species except for Liobagrus kingi (Tchang, 1935), Ameiurus melas (Rafinesque, 1820), Ictalurus furcatus (Valenciennes, 1840) and Noturus taylori (Douglas, 1972). The 4 species had 5'-ACCGG-3' motif. The conserved motif may be related with the transition from RNA synthesis to DNA synthesis (Hixson and Brown, 1986).
|
Fig. 4 The putative hairpin secondary structure of the OL found in the A. dispar mitogenome |
Due to the relatively high content of A + T (62.89%) in the CR, it can also be considered an A + T rich region. In A. dispar, the length of the CR was 1078 bp, and it was located between tRNAPro and tRNAPhe. Two other species of Ariidae (O. platypogon and A. arius) had a similar size and A+T content of CR to A. dispar. The CR functions in initial replication and is important in the vertebrates (Zhang et al., 1995; Fernandez-Silva et al., 2003). In A. dispar, both the AT-skew and GC-skew were negative (-0.06 and -0.23), revealing more Ts and Cs were used in the CR. In addition, the AT-skew values and GC-skew values in three other Ariidae species mentioned above were all negative. However, most of the AT-skew values of the CR across 21 other families were positive, indicating that the usage rate of A and T were different in the order Siluriformes.
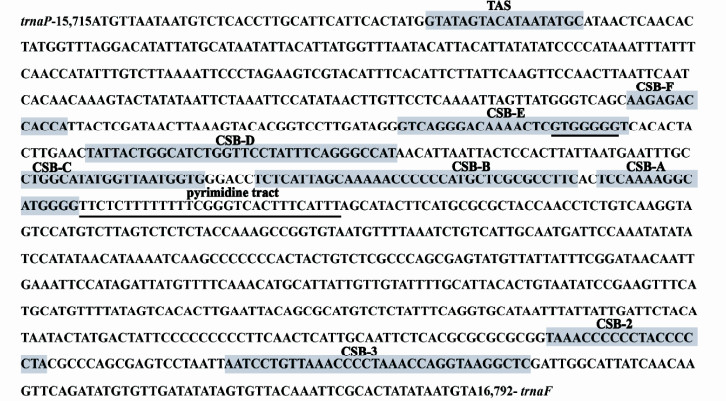
Based on the alignment of CR sequences of 42 Siluriformes species, 8 conserved sequence blocks (CSBs), a termination-associated sequence (TAS) and a pyrimidine tract were identified (Fig. 5). which might play an important role in mitochondrial metabolism as is the case for other teleost fishes (Lee et al., 1995). The TAS A. dispar of contained a conserved motif (GTATA-TATGC), which was found in mitogenomes of other Siluriformes species. The 8 CSBs can be divided into two parts (Roques et al., 2006). The CSB-F, CSB-E, CSB-D, CSB-C, CSB-B and CSB-A were concentrated in the central conserved domain, whereas CSB-2 and CSB-3 were located in the conserved sequence block domain. These CSBs were thought to have an important role in mitogenome transcription and replication (Doda et al., 1981; Walberg and Clayton, 1981; Zhuang et al., 2013). The G-box (GTGGGGG) was found in the CSB-E, which was the most conservative in teleost fish. Additionally, a pyrimidine tract (TTCTCT TTTTTTTCGGGTCACTTTCATTT) was identified following the CSB-A, which was also contained in most of the Siluriformes species. Like Auchenoglanis occidentalis (Valenciennes, 1840) (Claroteidae), A. melas (Ictaluridae), I. furcatus (Ictaluridae) and Pangasianodon gigas (Chevey, 1931) (Pangasiidae), some species of Siluriformes had tandem repeats within the CR (Jondeung et al., 2007; Rodiles-Hernandez et al., 2010; Nakatani et al., 2011; Yu et al., 2016). In contrast, A. dispar and two other Ariidae (O. platypogon and A. arius) all lacked tandem repeats. This result indicated that the difference in repeat clusters in Siluriformes appeared during the course of evolution.
|
Fig. 5 Features present in the control regions of the A. dispar mitogenome. The conserved sequence blocks CSB-F, CSB-E, CSB-D, CSB-C, CSB-B, CSB-A, CSB-3, CSB-2 and TAS are shaded |
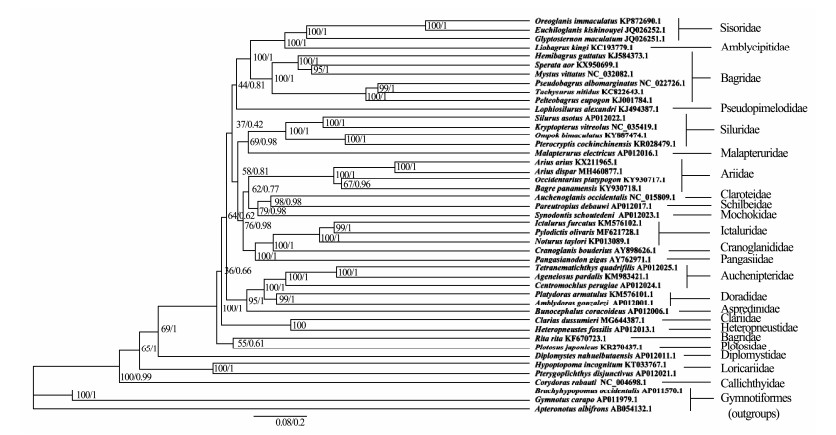
To study higher phylogeny of the order Beloniformes, the mitogenomes 42 Siluriformes species were obtained from the GenBank and the mitogenomes of Gymnotiformes species, A. albifrons (AB054132.1), B. occidentalis (AP011570.1) and G. carapo (AP011979.1) were used as outgroups (Fig. 6). Phylogenetic analysis by using ML and BI analyses was constructed for the nucleotide sequences of 12 concatenated PCGs except ND6. The phylogenetic tree included 22 families and 41 genera of order Siluriformes. In this study, the families Schilbeidae, Claroteidae, Mochokidae, and Ariidae formed a closely evolved clade with bootstrap value (62) and Bayesian posterior probability values (0.77), which was consistent with previous researches (Wang et al., 2016a, 2016b; Llera-Herrera et al., 2017). These researches showed that Ariidae shared a close ancestry with Ictaluridae or Siluridae, however, all the bootstrap values was lower than 55. Thus, the genetic relationship between Ariidae and other familes is still unclear, which need deeper study. Additionally, Callichthyidae was proposed to be one of the most basal taxa in the order of Siluriformes, which was similar to earlier study (Wang et al., 2016b). In other branches, Sisoridae, Amblycipitidae and Bagridae formed a distinct group (bootstrap value of 100 and Bayesian posterior probability values of 1). Simultaneously, Ictaluridae + (Pangasiidae + Auchenipteridae) was strongly supported by ML and BI. These phylogenetic positions were in agreement with the previous studies (Jondeung et al., 2007; Wang et al., 2016b). Besides, Jondeung et al. (2007) found that some branches of basal catfish relationships received high support in terms of Bayesian posterior probability but not of bootstrap, which was similar to our results. Therefore, the phylogenetic relationships of Siluriformes need to be demonstrated deeply based on a more comprehensive Siluriformes species in the future.
|
Fig. 6 Inferred phylogenetic relationships among Siluriformes by the BI and ML methods based on concatenated nucleotide sequences of the 12 PCGs, using Gymnotiformes species, A. albifrons (AB054132.1), B. occidentalis (AP011570.1) and G carapo (AP011979.1), as outgroups. The numbers along branches indicate ML bootstrap values and Bayesian posterior probability values, respectively |
This study first investigated the complete mitogenome of A. dispar, which was 16792 bp in length. Similar to other Ariidae species, this mitogenome contained 13 PCGs, one 12S rRNA gene, one 16S rRNA gene, 22 tRNA genes, and two non-coding regions. There were 33 bp overlaps in the mitogenome of A. dispar found at 10 gene junctions. The AT-skew value of this mitogenome was slightly negative, but the GC-skew value was strongly positive. All of the PCGs used ATG as the start codon, except for COX1, which was initiated by GTG. In addition, Leu1 was the most commonly used amino acid of all the PCGs. The A. dispar mitogenome encoded 22 tRNA and two rRNA. With the exception of tRNASer2, the other 21 tRNA genes displayed typical clover-leaf structures. OL of A. dispar contained a conserved motif, 5'-GCC GG-3', which was found at the base of the stem with the tRNACys. Besides, 8 conserved sequence blocks, a termination-associated sequence and a pyrimidine tract were identified in the CR of A. dispar. Molecular phylogenomic analysis indicated that A. dispar was genetically closest to A. arius. The families Schilbeidae, Claroteidae, Mochokidae, and Ariidae formed a closely evolved clade. These genetic relationships will be valuable regarding the evolutionary biology and population genetic diversity of Siluriformes
AcknowledgementSThis work was supported by the National Natural Science Foundation of China (Nos. 41806127 and 41906111) and the Natural Science Foundation of Guangdong Province (No. 2018A030313956).
Benson, G., 1999. Tandem repeats finder: A program to analyze DNA sequences. Nucleic Acids Research, 27: 573-580. DOI:10.1093/nar/27.2.573 (  0) 0) |
Boore, J. L., 1999. Animal mitochondrial genomes. Nucleic Acids Research, 27: 1767-1780. DOI:10.1093/nar/27.8.1767 (  0) 0) |
Burland, T. G., 2000a. DNASTARos Lasergene sequence analysis software. Methods in Molecular Biology (Clifton N.J.), 132: 71-91. DOI:10.1385/1-59259-192-2:71 (  0) 0) |
Burland, T. G., 2000b. DNASTARos Lasergene sequence analysis software. Molecular Biology Reports, 132: 71-91. (  0) 0) |
Carvalho, D. C., Perini, V. D. R., Bastos, A. S., da Costa, I. R., Luz, R. K., Furtado, C. and Prosdocimi, F., 2016. The complete mitochondrial genome of the threatened neotropical catfish Lophiosilurus alexandri (Silurifomes: Pseudopimelo- didae) and phylogenomic analysis indicate monophyly of Pimelodoidea. Genetics and Molecular Biology, 39: 674-677. DOI:10.1590/1678-4685-gmb-2016-0007 (  0) 0) |
Chu, X., Zheng, B. and Dai, D., 1999. Fauna Sinica Class Teleostei Siluriformes. Science Press, Beijing, 1-22.
(  0) 0) |
Cui, L., Dong, Y., Liu, F., Gao, X., Zhang, H., Li, L., Cen, J. and Lu, S., 2017. The first two complete mitochondrial genomes for the family Triglidae and implications for the higher phylogeny of Scorpaeniformes. Scientific Reports, 7: 1553. DOI:10.1038/s41598-017-01654-y (  0) 0) |
Doda, J. N., Wright, C. T. and Clayton, D. A., 1981. Elongation of displacement-loop strands in human and mouse mitochondrial DNA is arrested near specific template sequences. Proceedings of the National Academy of Sciences of the United States of America, 78: 6116-6120. DOI:10.1073/pnas.78.10.6116 (  0) 0) |
Fernandez-Silva, P., Enriquez, J. A. and Montoya, J., 2003. Replication and transcription of mammalian mitochondrial DNA. Experimental Physiology, 88: 41-56. DOI:10.1113/eph8802514 (  0) 0) |
Gong, L., Shi, W., Si, L. Z., Wang, Z. M. and Kong, X. Y., 2015. The complete mitochondrial genome of peacock sole Pardachirus pavoninus (Pleuronectiformes: Soleidae) and comparative analysis of the control region among 13 soles. Molecular Biology, 49: 408-417. DOI:10.1134/s0026893315030061 (  0) 0) |
Hixson, J. E. and Brown, W. M., 1986. A comparison of the small ribosomal RNA genes from the mitochondrial DNA of the great apes and humans: Sequence, structure, evolution, and phylogenetic implications. Molecular Biology and Evolution, 3: 1-18. DOI:10.1093/oxfordjournals.molbev.a040379 (  0) 0) |
Jondeung, A., Sangthong, P. and Zardoya, R., 2007. The complete mitochondrial DNA sequence of the Mekong giant catfish (Pangasianodon gigas), and the phylogenetic relationships among Siluriformes. Gene, 387: 49-57. DOI:10.1016/j.gene.2006.08.001 (  0) 0) |
Lashari, P., Laghari, M. Y., Xu, P., Zhao, Z., Jiang, L., Narejo, N. T., Deng, Y., Sun, X. and Zhang, Y., 2016. Complete mitochondrial genome of catfish Sperata seenghala (Sykes, 1839) (Siluriformes, Bagridae) from Indus River Sindh, Pakistan. Mitochondrial DNA Part A, 27: 387-388. DOI:10.3109/19401736.2014.895998 (  0) 0) |
Lee, W. J., Conroy, J., Howell, W. H. and Kocher, T. D., 1995. Structure and evolution of teleost mitochondrial control regions. Journal of Molecular Evolution, 41: 54-66. DOI:10.1007/BF00174041 (  0) 0) |
Llera-Herrera, R., Ramirez-Perez, J. S. and Saavedra-Sotelo, N. C., 2017. Complete mitochondrial genome of Cominate sea catfish Occidentarius platypogon (Siluriformes: Ariidae). Mitochondrial DNA Part B-Resources, 2: 337-338. DOI:10.1080/23802359.2017.1334516 (  0) 0) |
Marceniuk, A. P. and Menezes, N. A., 2007. Systematics of the family Ariidae (Ostariophysi, Siluriformes), with a redefinition of the genera. Zootaxa, 1416: 1-126. DOI:10.11646/zootaxa.1416.1.1 (  0) 0) |
Moreira, D. A., Buckup, P. A., Britto, M. R., Magalhaes, M. G. P., de Andrade, P. C. C., Furtado, C. and Parente, T. E., 2016. The complete mitochondrial genome of Corydoras nattereri (Callichthyidae: Corydoradinae). Neotropical Ichthyology, 14(1): e150167. DOI:10.1590/1982-0224-20150167 (  0) 0) |
Nakatani, M., Miya, M., Mabuchi, K., Saitoh, K. and Nishida, M., 2011. Evolutionary history of Otophysi (Teleostei), a major clade of the modern freshwater fishes: Pangaean origin and Mesozoic radiation. BMC Evolutionary Biology, 11: 177. DOI:10.1186/1471-2148-11-177 (  0) 0) |
Nelson, J., Grande, T., and Wilson, M., 2016. Fishes of the World. 5th edition. John Wiley & Sons, New Jersey, 209pp, DOI: 10.1002/9781119174844.
(  0) 0) |
Nylander, J. A. A., 2004. MrModeltest V2. Program Distributed by the author.
(  0) 0) |
Ojala, D., Montoya, J. and Attardi, G., 1981. tRNA punctuation model of RNA processing in human mitochondrial. Nature, 290: 470-474. DOI:10.1038/290470a0 (  0) 0) |
Peng, Z., Wang, J. and He, S., 2006. The complete mitochondrial genome of the helmet catfish Cranoglanis bouderius (Silurifonnes: Cranoglanididae) and the phylogeny of otophysan fishes. Gene, 376: 290-297. DOI:10.1016/j.gene.2006.04.014 (  0) 0) |
Reuter, J. S. and Mathews, D. H., 2010. RNAstructure: Software for RNA secondary structure prediction and analysis. BMC Bioinformatics, 11: 129. DOI:10.1186/1471-2105-11-129 (  0) 0) |
Rodiles-Hernandez, R., Lundberg, J. G. and Sullivan, J. P., 2010. Taxonomic discrimination and identification of extant blue catfishes (Siluriformes: Ictaluridae: Ictalurus furcatus Group). Proceedings of the Academy of Natural Sciences of Philadelphia, 159: 67-82. DOI:10.1635/053.159.0105 (  0) 0) |
Ronquist, F., Teslenko, M., van der Mark, P., Ayres, D. L., Darling, A., Hohna, S., Larget, B., Liu, L., Suchard, M. A. and Huelsenbeck, J. P., 2012. MrBayes 3.2: Efficient bayesian phylogenetic inference and model choice across a large model space. Systematic Biology, 61: 539-542. DOI:10.1093/sysbio/sys029 (  0) 0) |
Roques, S., Fox, C. J., Villasana, M. I. and Rico, C., 2006. The complete mitochondrial genome of the whiting, Merlangius merlangus and the haddock, Melanogrammus aeglefinus: A detailed genomic comparison among closely related species of the Gadidae family. Gene, 383: 12-23. DOI:10.1016/j.gene.2006.06.018 (  0) 0) |
Salvato, P., Simonato, M., Battisti, A. and Negrisolo, E., 2008. The complete mitochondrial genome of the bag-shelter moth Ochrogaster lunifer (Lepidoptera, Notodontidae). BMC Genomics: 9pp. DOI:10.1186/1471-2164-9-331 (  0) 0) |
Santos, B. S. and Quilang, J. P., 2011. DNA barcoding of Arius species (Siluriformes: Ariidae) in Laguna de Bay, Philippines using the cytochrome C oxidase subunit I gene. Philippine Agricultural Scientist, 94: 205-210. DOI:10.1016/j.njas.2011.03.001 (  0) 0) |
Schattner, P., Brooks, A. N. and Lowe, T. M., 2005. The tRNAscan-SE, snoscan and snoGPS web servers for the detection of tRNAs and snoRNAs. Nucleic Acids Research, 33: W686-W689. DOI:10.1093/nar/gki366 (  0) 0) |
Shi, W., Dong, X. L., Wang, Z. M., Miao, X. G., Wang, S. Y. and Kong, X. Y., 2013. Complete mitogenome sequences of four flatfishes (Pleuronectiformes) reveal a novel gene arrangement of L-strand coding genes. BMC Evolutionary Biology, 13: 12. DOI:10.1186/1471-2148-13-173 (  0) 0) |
Silvestro, D. and Michalak, I., 2012. raxmlGUI: A graphical front-end for RAxML. Organisms Diversity & Evolution, 12: 335-337. DOI:10.1007/s13127-011-0056-0 (  0) 0) |
Simon, C., Buckley, T. R., Frati, F., Stewart, J. B. and Beckenbach, A. T., 2006. Incorporating molecular evolution into phylogenetic analysis, and a new compilation of conserved polymerase chain reaction primers for animal mitochondrial DNA. Annual Review of Ecology Evolution & Systematics, 37: 545-579. DOI:10.1146/annurev.ecolsys.37.091305.110018 (  0) 0) |
Song, W., Li, L., Huang, H., Zhao, M., Jiang, K., Zhang, F., Zhao, M., Chen, X. and Ma, L., 2016. The complete mitochondrial genome sequence and gene organization of Trematomus bernacchii (Perciformes: Nototheniidae) with phylogenetic consideration. Mitochondrial DNA Part B - Resources, 1: 50-51. DOI:10.1080/23802359.2015.1137818 (  0) 0) |
Tamura, K., Peterson, D., Peterson, N., Stecher, G., Nei, M., and Kumar, S., 2011. MEGA5: Molecular evolutionary genetics analysis using maximum likelihood, evolutionary distance, and maximum parsimony methods. Molecular Biology and Evolution, 28: 2731-2739, DOI: 10.1093/molbev/msr121.
(  0) 0) |
Tamura, K., Peterson, D., Peterson, N., Stecher, G., Nei, M. and Kumar, S., 2011. MEGA5: Molecular evolutionary genetics analysis using maximum likelihood, evolutionary distance, and maximum parsimony methods. Molecular Biology and Evolution, 28: 2731-2739. DOI:10.1093/nar/27.2.573 (  0) 0) |
Walberg, M. W. and Clayton, D. A., 1981. Sequence and properties of the human KB cell and mouse L cell D-loop regions of mitochondrial DNA. Nucleic Acids Research, 9: 5411-5421. DOI:10.1093/nar/9.20.5411 (  0) 0) |
Wang, P., Ou, Y., Wen, J. and Li, J., 2016a. The complete mitochondrial genome of Arius arius (Siluriformes: Ariidae). Mitochondrial DNA Part B - Resources, 1: 551-552. DOI:10.1080/23802359.2016.1198999 (  0) 0) |
Wang, R. Q., Wang, D. Z., Li, C. T. and Yang, X. R., 2016b. Mitochondrial genome of the shorthead catfish (Pelteobagrus eupogon): Structure, phylogeny, and intraspecific variation. Genetics & Molecular Research, 15(2): 21-25. DOI:10.4238/gmr.15028634 (  0) 0) |
Wei, H., Ma, H., Ma, C., Zhang, F., Wang, W., Chen, W. and Ma, L., 2016. The complete mitochondrial genome sequence and gene organization of Tridentiger trigonocephalus (Gobiidae: Gobionellinae) with phylogenetic consideration. Mitochondrial DNA Part A, 27: 3725-3726. DOI:10.3109/19401736.2015.1079876 (  0) 0) |
Wolstenholme, D. R., 1992. Genetic novelties in mitochondrial genomes of multicellular animals. Current Opinion in Genetics & Development, 2: 918-925. DOI:10.1016/s0959-437x(05)80116-9 (  0) 0) |
Wyman, S. K., Jansen, R. K. and Boore, J. L., 2004. Automatic annotation of organellar genomes with DOGMA. Bioinformatics, 20: 3252-3255. DOI:10.1093/bioinformatics/bth352 (  0) 0) |
Yu, F., Yu, J., Zhou, Y., Yan, J., Fang, Y., Wang, W. and Yang, Z., 2016. Phylogenetic study of Ameiurus melas based on complete mitochondrial DNA sequence. Mitochondrial DNA Part A, 27: 4706-4707. DOI:10.3109/19401736.2015.1106511 (  0) 0) |
Zhang, D. X., Szymura, J. M. and Hewitt, G. M., 1995. Evolution and structural conservation of the control region of insect mitochondrial DNA. Journal of Molecular Evolution, 40: 382-391. DOI:10.1007/bf00164024 (  0) 0) |
Zhuang, X., Qu, M., Zhang, X. and Ding, S., 2013. A comprehensive description and evolutionary analysis of 22 grouper (Perciformes, Epinephelidae) mitochondrial genomes with emphasis on two novel genome organizations. PLoS One, 8: e73561. DOI:10.1371/journal.pone.0073561 (  0) 0) |
 2020, Vol. 19


