2. 山东省疾病预防控制中心公共卫生监测评价所,山东 济南 250014
2. Institute for Public Health Surveillance and Evaluation, Shandong Center for Disease Control and Prevention, Jinan 250014 China
人类生活环境中的物质可能含有放射性,产生γ射线,且长期的γ辐射暴露也可能对人类健康构成潜在影响[1]。地表γ辐射剂量是环境辐射监测评价的重要内容之一,其监测数据可用于评估与辐射有关事件的影响[2-3]。国内部分地区[4-6]已经开展过此类工作,在全国各地开展此类工作,有助于完善我国本底放射性水平数据信息。
核电站的建设和运行会影响当地的本底辐射水平[7-8],对周边居民的身体健康造成潜在危害[9]。山东省威海市荣成市石岛湾核电站自2012年建设以来,未见对石岛湾核电站周边环境放射性水平做系统研究的报道。因此本研究于2021年对石岛湾核电站周边30 km范围内的地表γ辐射水平进行监测,为当地放射性本底数据及核电站运行后放射性水平监测提供参考。
1 材料与方法 1.1 材料与设备本次研究使用了热释光剂量元件LiF(Mg、Cu、P),将热释光剂量元件裸片用纸包装,装入塑料袋后胶带固定,运送至各个监测点。测量仪器为MIRION RE2000A TLD Reader;采用氮气加热,光子计数法获取数据,由软件自动控制预热、测量、退火,元件灵敏度由仪器自动矫正。该设备经过相关部门检定有效。
1.2 布点与回收参考《辐射环境监测技术规范》HJ 61—2021[10],进行地表γ辐射的采样和测量。监测地点为石岛湾核电站周围30 km半径范围内,共随机选取16个监测点,详见表1。将包装固定好的热释光剂量元件裸片悬挂于距离地面1 m处的树干上至少3个月。监测时间选择在2021年的1月16日—4月14日、4月15日—7月20日、7月21日—10月21日和10月22—1月20日(2022年)4个监测时间段,在上述监测期内分别连续测量γ辐射水平,在每期结束后回收热释光剂量元件裸片。
|
|
表 1 石岛湾核电站周边30 km内的16个辐射监测点位置汇总表 Table 1 Summary of 16 radiation monitoring sites within 30 km around Shidaowan nuclear power plant |
| $ {D}={{C}}_{\mathrm{f}}\times ({{X}}_{\mathrm{i}}-{{X}}_{0}) $ | (1) |
公式中,D为实际测量值,即累积剂量,单位mGy,Xi为仪器测量读数,X0为本底读数,Cf为刻度因子,为5.54 × 10⁻⁷。校准结果经过中国剂量科学院认证有效。测量结果扣除宇宙射线电离成分。
为便于详细地分析比较目前核电站周边的地表γ辐射本底情况,本研究将仪器测出的累积剂量换算为实时剂量率。将实际测量值除以总小时数,即γ辐射剂量率,计算公式如下:
| $ \mathrm{T}\mathrm{G}\mathrm{R}\mathrm{D}\mathrm{R}={D} \div {T}\times {10}^{6} $ | (2) |
公式中TGRDR为地表γ辐射剂量率(terrestrial gamma radiation dose rate),单位nGy/h,T是本监测期总小时数,为监测天数乘以24。
1.3.2 有效剂量的计算根据过往文献[11]的公式计算由地表γ辐射引起的年有效剂量:
| $ \mathrm{A}\mathrm{E}\mathrm{D}\mathrm{ }=\mathrm{T}\mathrm{G}\mathrm{R}\mathrm{D}\mathrm{R}\times \mathrm{D}\mathrm{C}\mathrm{F}\times {O}{F}\times {T}\times {10}^{-6} $ | (3) |
公式中,AED为年有效剂量,mSv;TGRDR为地表γ辐射剂量率(terrestrial gamma radiation doserate),mSv;DCF是剂量转换因子,为0.7(无量纲);OF为室外暴露系数,为0.2[12](无量纲);T为1年的总小时数,为8760 h。
1.4 统计学分析数据分析使用软件Rstudio,数据经正态性检验部分不符合正态分布,以
测量仪器及剂量元件经质量部门检定合格,在检定周期内使用;在采样前组织专门人员进行培训,讲解采样原则,统一采样方法,熟练掌握过程后开始正式采样;同时参考过往文献的质量控制方法[13],对实验过程进行严格把控。
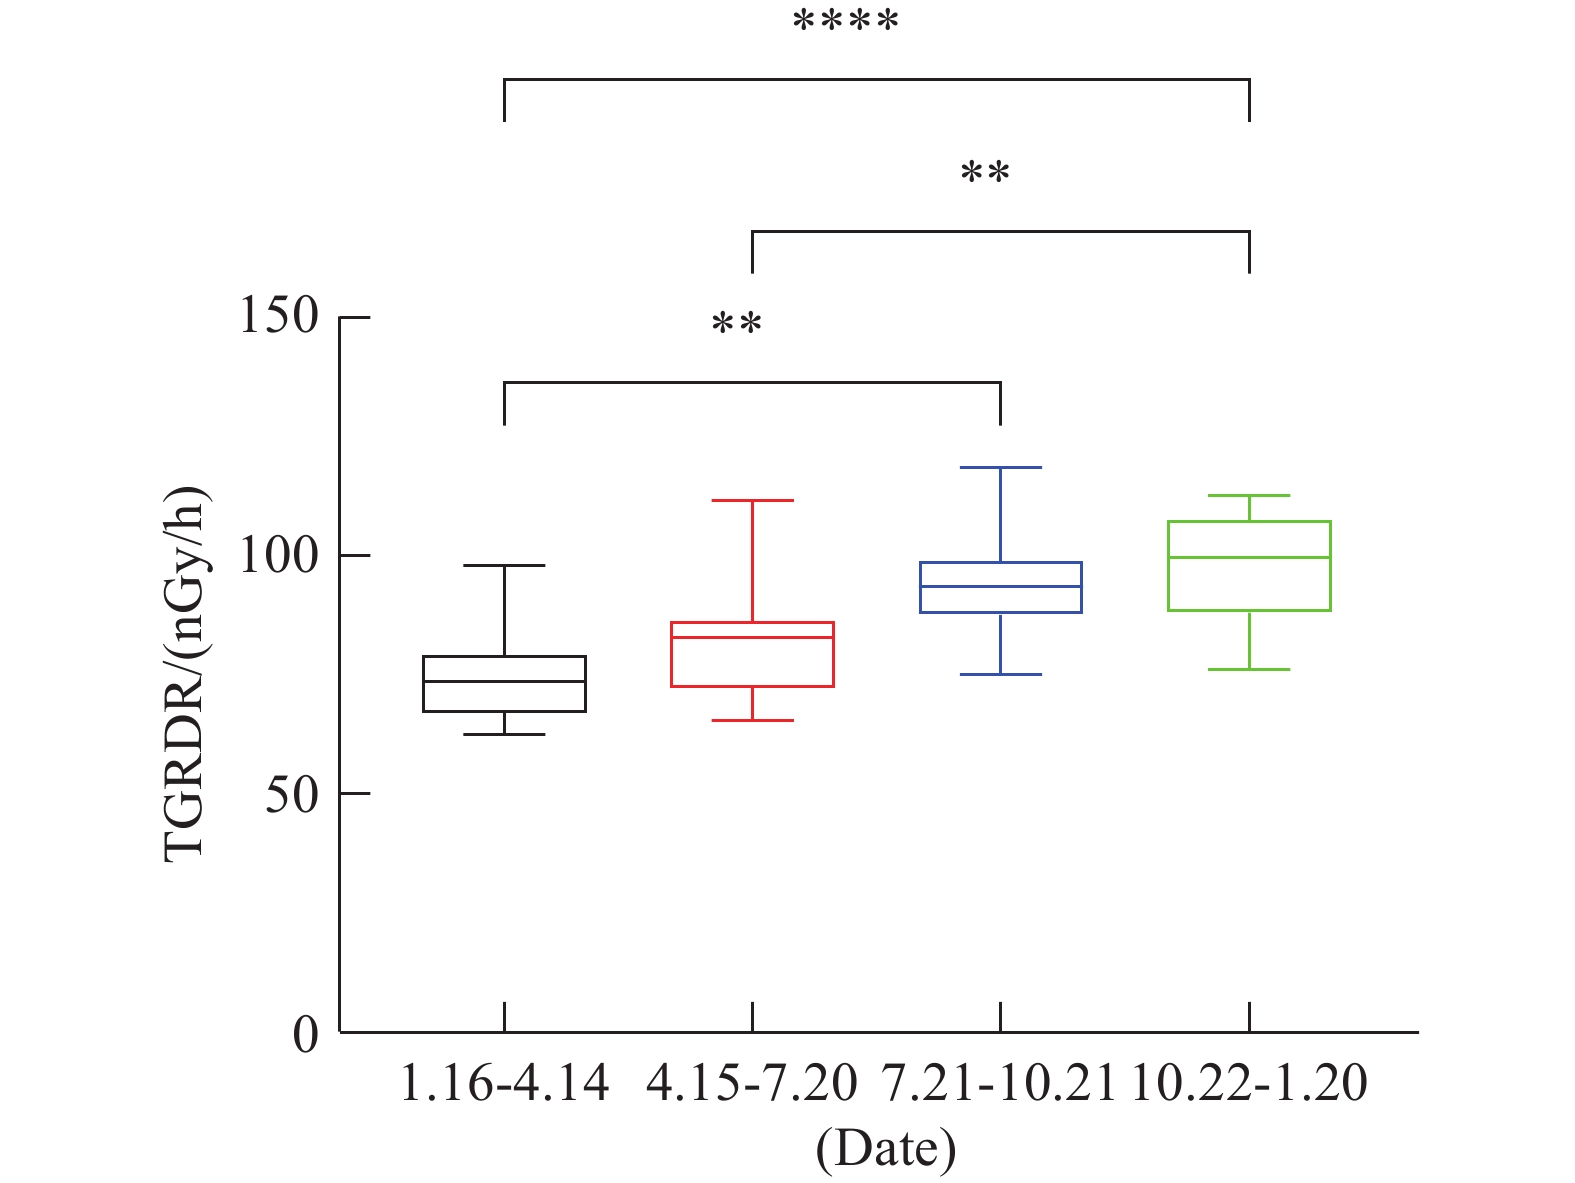
2 结 果 2.1 石岛湾核电站周边16个监测点地表γ辐射剂量的基本情况分析核电站周边16个监测点共连续监测4个周期,时间自2021年1月16日—2022年1月20日。每期的γ辐射剂量率监测结果列于表2。每期的γ辐射平均剂量率分别为(76.196 ± 3.366)、(81.773 ± 6.144)、(93.554 ± 7.449)、(97.604 ± 9.396) nGy/h。从全年来看,3号监测点(马栏耩村委)的γ辐射剂量率平均值最低,为(72.982 ± 7.501) nGy/h,1号监测点平均值(林家流民宿)最高,为(98.518 ± 5.228) nGy/h。将所有监测点全年的剂量率取平均值即代表了石岛湾核电站周边的总体地表γ辐射水平,为(87.282 ± 6.589) nGy/h,见表2。
|
|
表 2 石岛湾核电站周边16个监测点4个周期地表γ辐射剂量率(nGy/h,
|
图1呈现了本次测量结果在4个不同监测时期的变化。第3期的γ辐射剂量率平均水平高于第1期( H = 3.636,P < 0.01),差异有统计学意义,第4期比第2和第1期的差异也具有统计学意义( H = 3.295,P < 0.01;H = 4.367,P < 0.001)。该区域地表γ辐射水平呈现明显的时间变化特点,第3期至第4期(2021年7月21—2022年1月20)地表γ辐射水平较高。

|
图 1 不同监测周期地表γ辐射剂量率变化特点 Figure 1 Variation characteristics of terrestrial γ radiation dose rates during different monitoring periods 注:“**”表示0.001<P<0.05,“****”表示P<0.001。 |
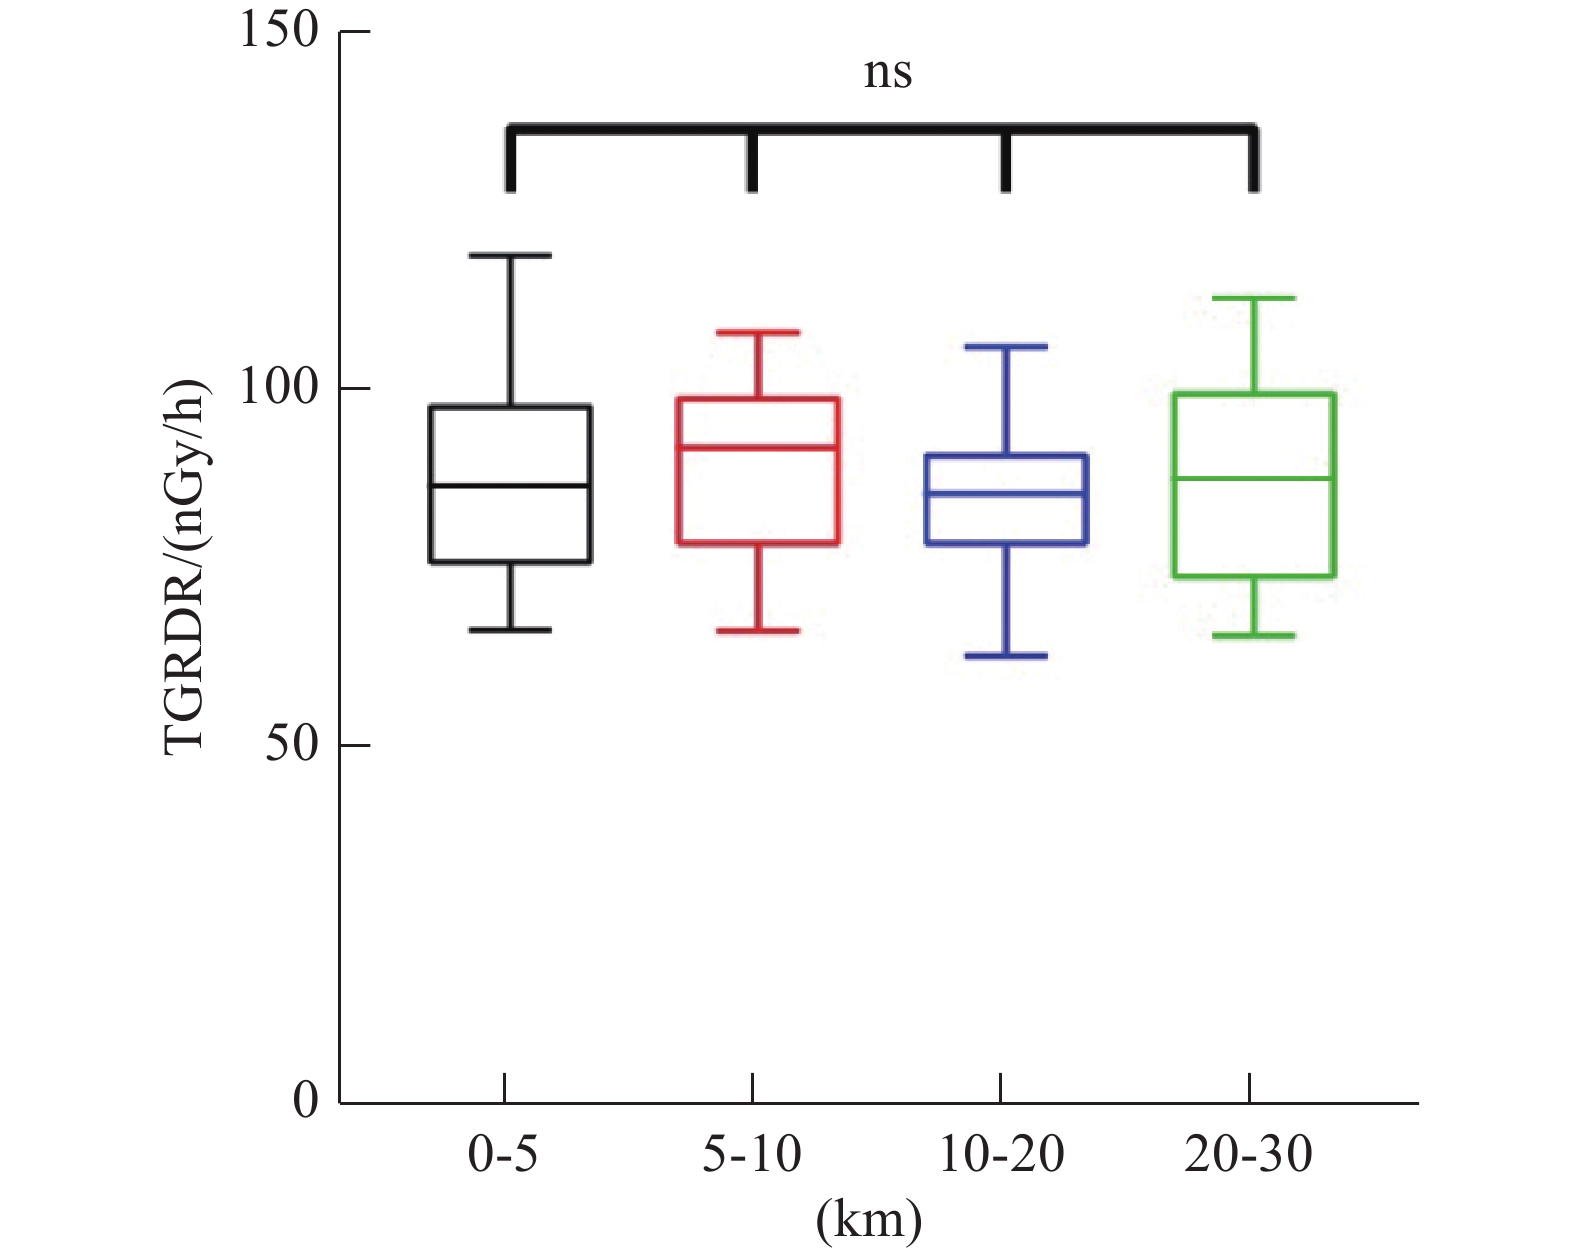
为了研究γ辐射水平与核电站的距离之间的变化关系,本研究将各监测点的全年地表γ辐射剂量率按照距核电站不同半径范围进行了比较分析。图2结果显示,将监测点与核电站的距离分成0~5、5~10、10~20和20~30 km 4个距离组,各组内各监测点的全年γ辐射剂量率平均水平为87.869、89.174、83.648和87.707 nGy/h,4个距离组间差异无统计学意义(P > 0.05)。

|
图 2 地表γ辐射剂量率在距核电站不同距离的变化特点 Figure 2 Variation characteristics of terrestrial γ radiation dose rates in different distance from the nuclear power plant 注:“ns”表示P > 0.05。 |
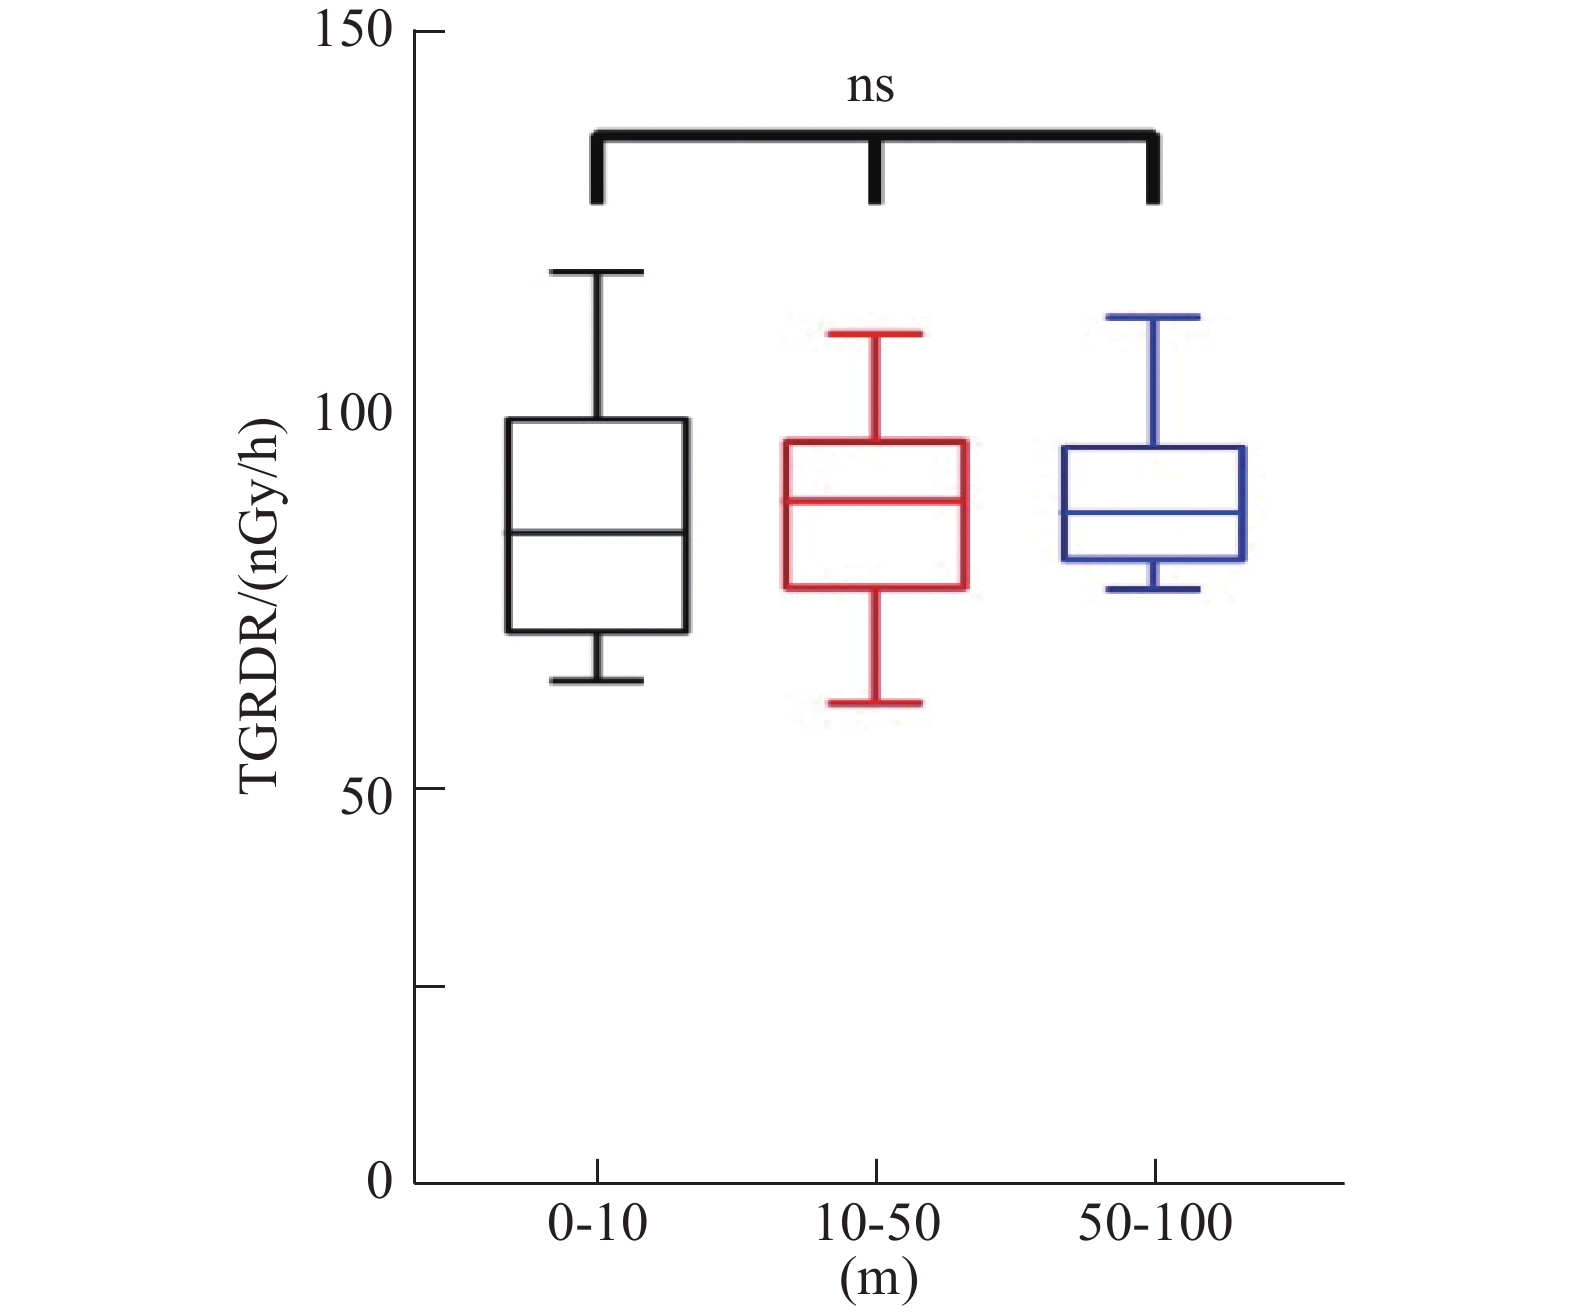
为了研究地表γ辐射与海拔高度的关系,本研究将每个监测点的全年地表γ辐射剂量率按照不同的海拔高度进行分组,如图3。在0~10 m、10~50 m和50~100 m海拔高度区间,各组的全年γ辐射剂量率平均水平依次为86.591、86.84和89.694 nGy/h,统计学分析显示各组间差异无统计学意义(P > 0.05)。

|
图 3 地表γ辐射剂量率在不同海拔高度的变化特点 Figure 3 Variation characteristics of terrestrial γ radiation dose rates in different altitudes |
本研究通过使用热释光剂量设备对山东省石岛湾核电站运行前的地表辐射剂量进行了监测,监测时长为369 d(2021年1月16日—2022年1月20日),监测周期为3个月,共4次。此次随机选择距石岛湾核电站30 km半径范围内的16个监测点,布放热释光剂量元件裸片,按时回收监测,通过计算得到该区域γ辐射剂量率的本底水平为(87.282 ± 6.589) nGy/h,对人体造成的年有效剂量为0.428 mSv。该结果是自石岛湾核电站建设以来首次对其周边环境进行的地表γ辐射水平的监测评价,是该地域重要的环境辐射水平基础数据,为后续的健康风险评估以及流行病学调查等研究提供了第一手材料和科学依据。
本研究结果显示2021年7月21日至2022年1月20日期间地表γ辐射水平较高,有文献报道季节可能会对地表γ辐射水平造成影响。如日照时间、大气压力、海拔和降雨等因素对地表γ辐射水平有显著影响[11]。另外太阳活动如风暴、耀斑等也会影响γ辐射水平,因此处于本次监测期间的太阳耀斑活动情况函待进一步研究。在16个监测点中,林家流民宿在全年的平均剂量率较高,马栏耩村委的剂量率较低,但从每个监测周期分析,上述2个监测点并不始终保持最高或者最低,提示在本底水平监测方面,还须进一步延长监测时间方能更准确的代表辐射剂量水平。在本研究中,海拔高度对辐射水平没有影响;其他的自然因素对该地域的地表γ辐射水平的影响还需深入探讨。另一方面,剂量片悬挂于距离地面一定高度,由于土壤也会向地面不断地释放γ辐射,因此土壤的性质可能是影响地表γ辐射测量结果的原因之一。例如由花岗岩形成的土壤可能具有更高的γ辐射水平,花岗岩中的铀、钍等元素含量高于其他地壳岩石[12],那么本次研究区域的γ辐射水平是否与其土壤构成成分有关,还需进一步研究。
通过与国内其他核电站周边环境的地表γ辐射水平进行比较,本次研究结果低于大亚湾核电站2020年[14]、阳江核电站外围2014—2017年[15]、田湾核电站2017—2019年[16]、福清核电站运行前[17]、海南昌江核电站2013年[18]和三门核电站2011—2013年[19]报道的监测水平,高于秦山核电站1992—2012年[20]期间监测的γ辐射水平。
在本研究中,由于部分地点不具备布点条件而未能采集到相应数据,后续研究可适当增加监测点的设置以获得更多更具有代表性的数据。由于样本量的限制,本研究未得出海拔对地表γ辐射的影响。另外根据HJ 61—2021推荐的γ辐射环境监测方法(GB/T 14583),对于大型核设施要至少连续监测2年,每一批热释光剂量元件的布放要按照每个季度1次,每次至少3个月,布放完成后的剂量元件要装入防水、防潮、防尘的密封盒内,并装入铅罐中运输。未来进行相关研究时还须考虑核电站周围是否有其他铀、钍矿设施或其他人为活动可能引起天然辐照增加情况等。综上,本研究结果提供了石岛湾核电站周边区域的地表γ辐射水平的原始数据,为深入进行该地区的环境辐射流行病学研究提供了参考。
| [1] |
Yin J, Hu N, Yi L, et al. Identification of ferroptosis biomarker in AHH-1 lymphocytes associated with low dose radiation[J]. Health Phys, 2021, 120(5): 541-551. DOI:10.1097/HP.0000000000001385 |
| [2] |
Torres SB, Petrik A, Szabó KZ, et al. Spatial relationship between the field-measured ambient gamma dose equivalent rate and geological conditions in a granitic area, Velence Hills, Hungary: an application of digital spatial analysis methods[J]. J Environ Radioact, 2018, 192: 267-278. DOI:10.1016/j.jenvrad.2018.07.001 |
| [3] |
Folly CL, Konstantinoudis G, Mazzei-Abba A, et al. Bayesian spatial modelling of terrestrial radiation in Switzerland[J]. J Environ Radioact, 2021, 233: 106571. DOI:10.1016/j.jenvrad.2021.106571 |
| [4] |
谢天成, 谢正观. 北京市重点地区γ辐射水平监测与评价[J]. 安全与环境学报, 2006, 6(6): 74-77. Xie TC, Xie ZG. Monitoring and assessment of environmental γ radiation in the principal areas of Beijing[J]. J Saf Environ, 2006, 6(6): 74-77. DOI:10.3969/j.issn.1009-6094.2006.06.020 |
| [5] |
李林御, 贺良国. 2013—2020年四川省地表γ辐射水平及所致居民剂量分析[J]. 预防医学情报杂志, 2022, 38(6): 810-813, 818. Li LY, He LG. Analysis on the surface gamma radiation levels and residents exposure dose in Sichuan Province from 2013 to 2020[J]. J Prev Med Inf, 2022, 38(6): 810-813, 818. DOI:10.3969/j.issn.1006-4028.2022.6.yfyxqbzz202206014 |
| [6] |
刘露, 吴田勇, 苏勤, 等. 泸州市地表γ辐射剂量率水平分析[J]. 职业与健康, 2020, 36(21): 2970-2973. Liu L, Wu TY, Su Q, et al. Analysis on surface gamma radiation dose rate level in Luzhou City[J]. Occup Health, 2020, 36(21): 2970-2973. DOI:10.13329/j.cnki.zyyjk.2020.0811 |
| [7] |
Harris C, Kreeger D, Patrick R, et al. Twenty-five years of environmental radionuclide concentrations near a nuclear power plant[J]. Health Phys, 2015, 108(5): 503-513. DOI:10.1097/HP.0000000000000266 |
| [8] |
郭英来. 田湾核电站商运前后周边降水和大气中氚浓度比较[J]. 辐射防护, 2014, 34(1): 38-40,64. Guo YL. Comparison of tritium concentration in rainwater and atmosphere around TNPS before and after commercial service[J]. Radiat Prot, 2014, 34(1): 38-40,64. DOI:10.3969/j.issn.1000-8187.2014.01.008 |
| [9] |
董建梅, 李伟伟, 秦绪成, 等. 2007—2015年田湾核电站周围地区恶性肿瘤发病分析[J]. 中国肿瘤, 2021, 30(2): 124-130. Dong JM, Li WW, Qin XC, et al. Cancer incidence in 0 ~ 30 km area around Tianwan nuclear power plant, 2007-2015[J]. China Cancer, 2021, 30(2): 124-130. DOI:10.11735/j.issn.1004-0242.2021.02.A004 |
| [10] |
中华人民共和国生态环境部. HJ 61—2021辐射环境监测技术规范[S]. 北京, 2021. Ministry of Ecology and Environment of the People's Republic of China. HJ 61—2021Technical specification for radiation environmental monitoring[S]. Beijing, 2021. |
| [11] |
Feng WL, Zhang YF, Li YL, et al. Spatial distribution, risk assessment and influence factors of terrestrial gamma radiation dose in China[J]. J Environ Radioact, 2020, 222: 106325. DOI:10.1016/j.jenvrad.2020.106325 |
| [12] |
The United Nations Scientific Committee on the Effects of Atomic Radiation. UNSCEAR 2000 Sources and effects of ionizing radiation[R]. United Nations: UNSCEAR, 2000.
|
| [13] |
杨莉, 王丽姣, 邵明刚, 等. 用于环境辐射水平监测的热释光测量系统的质量控制[J]. 中国辐射卫生, 2021, 30(4): 457-462. Yang L, Wang LJ, Shao MG, et al. Quality control measures of thermoluminescent dosimetry system used in environmental radiation monitoring[J]. Chin J Radiol Health, 2021, 30(4): 457-462. DOI:10.13491/j.issn.1004-714X.2021.04.014 |
| [14] |
张伟珠, 林淑倩, 孔杜娟, 等. 热释光剂量计在核电厂环境监测中的应用[J]. 中国辐射卫生, 2022, 31(3): 296-300,310. Zhang WZ, Lin SQ, Kong DJ, et al. Application of thermoluminescence dosimeter in environmental monitoring of nuclear power plant[J]. Chin J Radiol Health, 2022, 31(3): 296-300,310. DOI:10.13491/j.issn.1004-714X.2022.03.007 |
| [15] |
张华, 徐润龙, 林炜伟. 2014—2017年广东省阳江核电站外围γ辐射空气吸收剂量率监测结果[J]. 辐射防护通讯, 2018, 38(2): 41-43. Zhang H, Xu RL, Lin WW. Continuous monitoring of γ air absorbed dose rateat Yangjiang NPP, Guangdong Province, from 2014 to 2017[J]. Radiat Prot Bull, 2018, 38(2): 41-43. DOI:10.3969/j.issn.1004-6356.2018.02.009 |
| [16] |
曹鹏涛, 王文军, 王志玉. 2017—2019田湾核电站外围瞬时剂量率分析[J]. 科学技术创新, 2020,(28): 46-47. Cao PT, Wang WJ, Wang ZY. 2017—2019 Tianwan Nuclear Power Plant peripheral instantaneous dose rate analysis[J]. Sci Technol Innovation, 2020,(28): 46-47. DOI:10.3969/j.issn.1673-1328.2020.28.022 |
| [17] |
刘祥铨, 张晓阳, 吴京颖, 等. 福清核电站运行前环境γ辐射水平及所致居民剂量估算[J]. 中国辐射卫生, 2015, 24(5): 520-521. Liu XQ, Zhang XY, Wu JY, et al. Gamma radiation levels in terrestrial environment and resultant population dose before operation of Fuqing nuclear power plant[J]. Chin J Radiol Health, 2015, 24(5): 520-521. DOI:10.13491/j.cnki.issn.1004-714X.2015.05.029 |
| [18] |
陈玉珅, 王川健, 王龙义, 等. 海南昌江核电站周围环境地表γ辐射剂量率本底调查[J]. 中国热带医学, 2014, 14(10): 1189-1191. Chen YS, Wang CJ, Wang LY, et al. Survey of environmental terrestrial gamma-radiation baseline levels around Hainan Changjiang nuclear power station[J]. China Trop Med, 2014, 14(10): 1189-1191. DOI:10.13604/j.cnki.46-1064/r.2014.10.058 |
| [19] |
应正巨, 章群, 边国林, 等. 某核电厂毗邻区域地表γ外照射剂量率水平调查[J]. 环境与职业医学, 2014, 31(3): 217-219. Ying ZJ, Zhang Q, Bian GL, et al. Gamma radiation dose in terrestrial environment in proximity to a nuclear power plant[J]. J Environ Occup Med, 2014, 31(3): 217-219. DOI:10.13213/j.cnki.jeom.2014.0052 |
| [20] |
陈群华, 宋建锋, 郑惠娣. 秦山核电基地外围环境γ辐射剂量率水平监测回顾[J]. 能源环境保护, 2014, 28(6): 58-60,49. Chen QH, Song JF, Zheng HD. Monitoring review of environmental gamma radiation dose rate around Qinshan NPP[J]. Energy Environ Prot, 2014, 28(6): 58-60,49. DOI:10.3969/j.issn.1006-8759.2014.06.017 |


