植物具有高度复杂的空间代谢网络, 合成了种类繁多、数量庞大、功能各异的次生代谢产物, 主要包括多酚类、生物碱类、萜类、聚酮类化合物[1]。这些内源性代谢产物在植物的抗病防御反应以及信号传递中发挥着重要作用。更为重要的是植物次生代谢产物是天然药物的重要来源。目前已从各种植物中发现多达200 000种次生代谢产物, 这些结构特异和数量庞大的天然产物成为了创新药物、药物候选结构和先导结构的重要来源[2, 3]。
药用植物是中药重要的来源之一, 是我国中医药事业发展的物质基础和宝贵财富。从中药资源化学的角度出发, 研究药用植物不同生长阶段、不同组织器官中次生代谢产物的组织分布特征及其累积规律, 对于药用植物次生代谢产物合成研究以及调控、优化栽培生产技术, 培育和保护优良种质资源等方面都有重要意义。近年来, 不断成熟的代谢组学技术在揭示药用植物有效成分的合成与转运途径, 次生代谢产物的累积与环境的关系等方面展示出了其强大的优势, 成为了研究优质中药材形成机制的关键技术方法。其中, 质谱技术因其高灵敏度、高特异性和高分辨率的优势在植物代谢组学研究中发挥着重要作用[4]。然而, 传统的色谱-质谱联用技术需要对待测组织进行匀浆、提取、净化等前处理, 丢失了代谢物在植物组织中的原始空间分布信息。
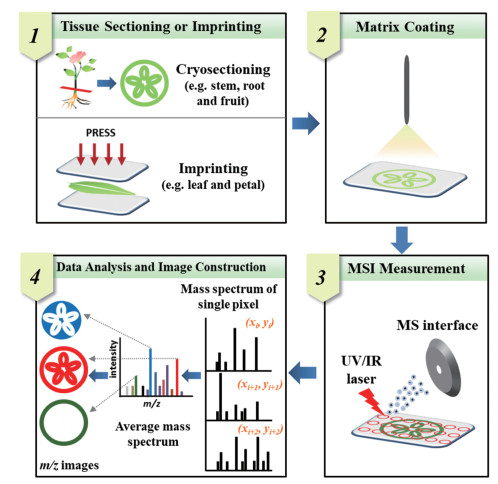
质谱成像技术(mass spectrometry imaging, MSI)是近年来受到极大关注的一种新型的分子成像技术。通过原理与构造各异的离子化探针扫描样本, 实现样品中待测物的原位解吸/电离, 并传输到质谱中进行检测, 获取与样本空间位置关联的质谱图集合[5]。最后, 利用质谱成像软件处理得到的质谱图集合以获得每个质荷比(m/z)的组织分布图像(图 1)。与经典的组织化学相比, MSI可在不对组织中待测化合物预先标记的情况下完成多个成分的非靶向空间分布分析[6, 7]。因此, MSI技术具有化学成分高覆盖、高通量等优势, 可一次实现数百个化合物的成像分析。根据离子源的不同, 可将MSI划分为以下3种:基质辅助激光解吸/电离质谱成像(matrix-assisted laser desorption/ionization mass spectrometry imaging, MALDI-MSI)、解吸电喷雾离子化质谱成像(desorption electrospray ionization mass spectrometry imaging, DESI-MSI)和二次离子质谱成像(secondary ion mass spectrometry imaging, SIMS-MSI)[8]。其中MALDI-MSI通过将待测物与能吸收紫外或红外激光的基质混合形成共结晶, 基质分子吸收激光能量使待测分子解吸离子化, 从而实现待测物的原位电离。MALDI应用最为广泛的是蛋白质等大分子分析, 但随着MALDI技术的不断发展, 尤其是MALDI-MSI技术的兴起, 使其在脂质、小分子代谢物和药物小分子的原位分析中得到了越来越多的应用。目前MALDI-MSI最高空间分辨率可达1.4 µm[9]。但该技术仍存在一定的局限性, 如常用的小分子基质在低分子量区易产生较多干扰峰, 存在明显的离子抑制效应。同时, MALDI质谱数据的采集速度受激光器频率和质谱分辨率等因素的影响, 当采用高空间分辨率和高质量分辨率分析大量样本时, 往往需要花费很长的时间。此外, MALDI-MSI的成本也相对较高。DESI-MSI是基于电喷雾衍生出的原位分析技术。相比真空MALDI, DESI在常压敞开环境下即可实现样品表面分子的解吸/电离, 无需使用基质, 样品前处理简单, 但其空间分辨率较低(~200 µm)。SIMS-MSI是目前空间分辨率最高的质谱成像技术(~50 nm), 可达到亚细胞水平, 但由于溅射到样品表面的离子束所携带的能量通常较化合物中共价键的键能更高, 易造成待测物的裂解从而产生过多碎片离子。因此, 同MALDI和DESI相比, SIMS的电离方式较硬。同时由于化合物易发生碎裂, SIMS-MSI不适用于生物大分子等物质的检测[10]。

|
Figure 1 Typical workflow of MALDI-MSI of plant tissues |
MALDI-MSI是目前应用最为广泛的MSI技术, 在包括疾病标志物的发现、肿瘤组织病理特征、药物及其代谢产物组织分布等研究领域受到了高度的关注。近年来, MALDI-MSI因其特有的优势备受植物研究人员的关注。但由于植物组织自身组成和结构的特殊性, 对其样品制备、分析方法都提出了更高的要求, 因此需要建立适合植物组织分析的MALDI-MSI技术方法。本文重点介绍了MALDI-MSI技术及其在药用植物次生代谢产物研究中的应用, 并对其应用前景做了总结与展望, 以期为药用植物次生代谢产物的生物组织分布、累积规律、合成途径等研究以及药用植物质量评价提供多维度的科学依据。
1 MALDI-MSI技术概览1988年Karas等[11]和Tanaka等[12]利用激光电离成功测定了分子质量高达10 kDa和34 kDa的大分子化合物。自此MALDI技术诞生, 实现了生物大分子的质谱检测, 为生命科学领域提供了全新的分析检测技术。随着MALDI技术的不断发展, 该技术被成功用于分子成像领域, 实现了组织表面多成分的可视化分析。MALDI-MSI最早由Spengler等[13]和Caprioli等[14]于20世纪90年代提出, 随后该技术得到了极大关注和快速发展, 成为了目前最为常用的MSI技术之一。
根据离子源真空度的不同, MALDI-MSI可分为真空MALDI和大气压MALDI (AP-MALDI)。真空MALDI需将干燥后的样品放入高真空状态的腔体内, 经激光照射完成成像分析, 而AP-MALDI则是将样品直接放置于常压环境中进行分析。真空MALDI和AP-MALDI具有很多共性, 如使用相同的基质及基质与待测物比例。然而, 与真空MALDI相比, AP-MALDI操作较简便, 增加了离子稳定性, 减少了化合物裂解, 可使用液体基质, 不用担心基质在真空升华等优势。AP-MALDI曾因其灵敏度较低而未被广泛应用, 因此商品仪器中仍以真空MALDI较为常见。但随着AP-MALDI技术不断的成熟与发展, 逐渐受到了青睐。MALDI-MSI中, 离子源可与多种质量分析器联用, 如飞行时间(time-of-flight, TOF)分析器、四极杆-飞行时间(quadrupole time-of-flight, Q-TOF)分析器、离子阱(ion trap, IT)及傅立叶变换离子回旋共振(Fourier transform ion cyclotron resonance, FTICR)分析器。其中MALDI与TOF的联用最为常见。
MALDI-MSI实验由3个基本部分构成:样品制备、质谱数据采集、数据读取和质谱图像的生成。其中, 样品制备是获得高质量质谱成像图的关键步骤, 组织取样方法、切片完整度、厚度以及基质的选择和喷涂等都会对结果产生明显的影响。植物组织自身特点决定了其样品制备方法的难易程度。相比富含脂肪的动物组织样本, 很多植物样本质地坚硬, 含水量高, 木纤维多, 对其冷冻切片的制备提出了较高要求。因此, 本文将首先针对MALDI-MSI植物样本的制备方法展开介绍。
1.1 样品组织的收集与保存为了防止在样品制备过程中发生酶促降解反应或化合物移位, 新鲜样本通常在液氮或干冰中快速冷冻, 于冷冻切片机中制备组织冰冻切片, 或保存于-80 ℃环境下备用。有研究报道-80 ℃环境下可以保证一年内样品中待测成分和含量未发生明显变化[15]。对于含水量较多的植物组织来说, 长期存放可能会出现细胞失水皱缩现象。当样本体积较大而保存空间有限时, 可以组织切成片的形式保存, 但时间不宜过长[16]。
1.2 样品组织制备方法冰冻切片是最常用的MALDI-MSI样品制备方法之一。然而, 受植物细胞壁、细胞间隙大、含水量高等影响, 获得高质量的植物组织冰冻切片难度较大。因此, 通常采用包埋的方法维持组织结构的完整性, 减少切片皱折和碎裂, 从而提高冰冻切片的质量。组织化学制片中常使用的OCT包埋剂(optimal cutting temperature compound, OCT), 是一种聚乙二醇和聚乙烯醇的水溶性混合物。但是使用OCT包埋组织会带来样品污染、离子抑制等问题, 不适用于MALDI-MSI分析[17]。因此, 研究者寻找到了多种MALDI-MSI兼容的包埋剂, 常用的有羧甲基纤维素(carboxymethyl cellulose, CMC)[18]、明胶[19]和冰[20], 也可根据样品特点联合使用这些包埋剂以获得高质量的冰冻切片。组织切片厚度也是影响MALDI-MSI分析的重要影响因素。较厚的切片虽能保证组织结构的完整性, 但是多数商品化仪器内部结构固定, 不易根据样品的厚度调节光路以及样品表面到离子提取装置的距离, 易导致激光聚焦偏移和质谱响应信号降低, 影响MALDI-MSI的分析结果[21]。因此, 综合考虑质谱响应以及植物样本自身的特点, 对于植物组织中次生代谢产物的MALDI-MSI分析, 组织切片厚度大多控制在20~50 μm之间。此外, 对于无法或很难获得冰冻切片的植物组织, 可将样本中的待测物通过平压等方式转移到平整的表面, 间接完成MSI分析, 该方法亦称为印迹质谱成像。印迹法常适用于较薄、无法包埋制片的叶片、花瓣等组织的MALDI-MSI分析(图 1)。
1.3 组织冰冻切片转移冰冻切片完成后需要将其融裱在与离子源匹配的靶板上。最常用的靶板是ITO (indium tin oxide)导电玻璃, 可以有效的消除样品表面电荷的蓄积。值得注意的是, 对于AP-MALDI, 靶板材质不受限制。切片转移最常用的方法是融裱法。该法可将冰冻组织切片直接粘到靶上, 操作简单, 污染少, 但融裱过程中可能会因为样品和空气中所含过量水分的凝结而导致分析物的移位[22]。Li等[23]评估了3种常用包埋剂(冰、CMC和明胶)和5种冰冻切片转移方法对制备银杏叶冰冻横切片时内源性代谢产物移位的影响。该研究发现用冰作为包埋剂时, 黄酮苷类和糖类化合物出现了明显的移位; 使用CMC包埋后, 移位情况得到了明显的改善, 但CMC包埋易受转移方法的影响。使用明胶作为包埋剂时没有观察到待测物的移位, 且不易受转移方法的影响。文章指出待测物的移位程度与其亲脂性/亲水性密切相关, 水溶性化合物在融裱过程中更易出现移位现象。
1.4 基质的选择和覆盖目前常用的有机小分子基质包括2, 5-二羟基苯甲酸(2, 5-dihydroxybenzoic acid, DHB)、α-氰基-4-羟基肉桂酸(4-hydoxy-cyanocinnamic acid, CHCA)、9-氨基吖啶(9-aminoacridine, 9-AA)等。DHB和CHCA适用于植物组织中生物碱类、黄酮类和多糖类等成分的检测[24, 25], 9-AA是负离子模式下常用的基质, 可用于有机酸等化合物的分析[26]。DHB和CHCA等MALDI基质在低分子量区(m/z < 500)存在较多基质干扰峰, 从而对于m/z < 500的分析物可能造成峰重叠和离子抑制等问题。因此, 寻找背景干扰少, 解吸/电离效率高、特异性强的有机分子基质是MALDI-MSI研究中的一个热点。近几年已报道的新有机小分子基质包括盐酸萘乙二胺[N-(1-naphthyl)ethylenediamine dihydrochloride, NEDC]、槲皮素(quercetin)、DMAN [1, 8-bis (dimethylamino) naphthalene]、DAN (1, 5-diaminonaphthalene)及其盐酸盐等。另一方面, Ayorinde等[27]开发了卟啉类化合物meso-tetrakis (pentafluorophenyl) porphyrin作为高分子量基质, 减少了低分子量区基质峰的产生, 适用于有机酸等低分子量代谢物的检测。此外, 多项研究表明纳米材料能够作为新型的MALDI基质, 诸如金、银等纳米材料[28]、氧化铁和二氧化钛等金属氧化物[29]及纳米材料经有机小分子修饰的复合材料[30]。已报道的纳米基质背景噪音低, 化学性质稳定, 为小分子化合物的分析提供了高灵敏度的MALDI-MSI方法。目前新基质的开发多针对动物组织内源性物质的分析, 鲜有根据植物组织构造特点和所含次生代谢产物的结构类型开发的新基质。
此外, 基质的涂覆对MALDI-MSI分析也有极大的影响。常用的涂覆方法主要有两种:气助喷雾法和升华法。气助喷雾法可以使用喷枪手动喷涂基质, 需要一定的技巧, 其重复性和重现性较差。现多采用全自动喷雾仪涂覆基质, 与普通喷枪相比, 能够更均匀的雾化基质溶液, 形成粒径较小且均匀的液滴, 在基质的沉积量、均匀性和吸附性等方面均有明显的优势, 能够显著提高成像结果重复性和重现性。升华法相对于喷雾法是一种快速、均一的“干法”基质涂覆方法。升华法的优点之一是不使用溶剂, 根本上解决了待测物移位的问题[31]。但也因为没有溶剂的存在, 基质和待测物之间的相互作用减弱, 可能造成某些待测物质谱响应降低。解决该问题的方法之一是“重结晶”, 利用各种溶剂蒸汽对升华沉积在样品表面的基质进行重结晶, 能够显著提高质谱响应[32, 33]。
1.5 数据采集和成像分析当前有许多可用于处理质谱成像数据的商业化和开源软件, 可以通过去除噪音、校正m/z峰偏差、归一化等处理提高MSI图像的质量。其中, 归一化处理的目的是为了降低可能由于基质涂覆不均匀、表面离子抑制等造成的像素点间信号差异。基于总离子流(total ion count, TIC)的归一化处理是目前最常用的方法, 可提高质谱图像质量。但对于某些分布在非常局限区域内且丰度很高的化合物来说, TIC均一化会造成数据失真, 应该考虑采用其他均一化方法[34]。此外, 在MSI靶向分析中可通过涂覆合适的内标完成待测物MSI数据的归一化处理, 该法可用于半定量和定量MALDI-MSI分析[35]。
2 MALDI-MSI在药用植物空间代谢研究中的应用植物体内的次生代谢产物的合成和累积具有精准的空间调控网络, 代谢产物在组织中的特异性分布与其生理功能具有紧密的关联。因此, 精准定位组织中各种次生代谢产物的空间分布, 对于药用植物次生代谢产物合成及调控机制的阐明具有重要意义。随着MALDI-MSI的快速发展, 可视化分析了许多药用植物的药用部位中有效成分的组织分布特征, 所获得的质谱图像可以准确地识别特异性化学成分在组织、甚至细胞间的差异性分布, 为揭示药效物质的组织特异性分布及其累积规律提供了重要科学依据。目前, 应用MALDI-MSI技术已经揭示了诸如人参[36-38]、甘草[39]、黄芩[40]、雷公藤[41]、Putterlickia pyracantha[42]、银杏[43]、桑叶[44]、大黄[45]、长春花[46]、芍药[47]、贯叶金丝桃[48]及多种药用植物[49-54]中次生代谢产物的组织分布特征(表 1)。
| Table 1 Recent applications of MALDI-MSI in medicinal plants. DMA: N, N-Dimethylaniline; DMCA: 3, 4-Dimethoxycinnamic acid |
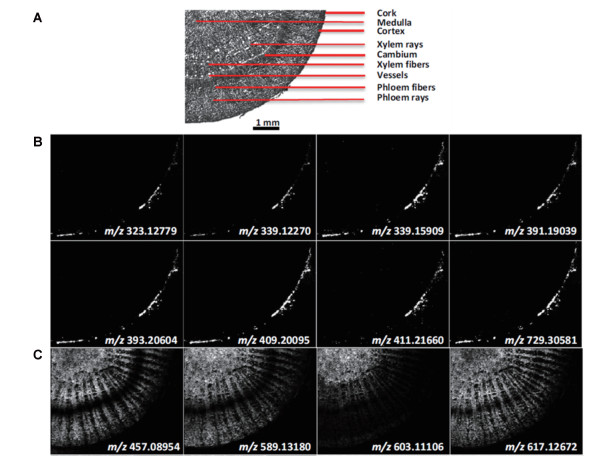
甘草中富含黄酮、异黄酮和三萜皂苷等活性物质, 具有抗炎、抗菌、抗病毒、抗氧化、护肝等诸多药理活性。Li等[39]应用高空间分辨率AP-MALDI MSI分析了光果甘草(Glycyrrhiza glabra L.)根茎横切片, 揭示了黄酮苷元、黄酮苷以及皂苷类化合物的组织特异性分布。AP-MALDI MSI结果显示, 黄酮苷元(如glabridin)和黄酮苷(如liquiritin和liquiritin apioside)呈现“互补分布”的特点。黄酮苷元类化合物的分布仅局限于木栓层中, 而黄酮苷类则广泛分布于韧皮纤维和木纤维中(图 2)。甘草根茎中皂苷类化合物如glycyrrhizic acid和licoricesaponin A3主要分布在皮层、韧皮纤维和木纤维中。黄芩中同样富含黄酮类化合物, Feng等[40]利用等离子体辅助LDI-MSI技术分析了黄芩(Scutellaria baicalensis Georgi)根横切片中次生代谢产物的组织分布特征, 发现baicalein和wogonin集中分布于表皮部位, 与甘草中黄酮苷元的组织分布特征相似。雷公藤具有消炎、解毒等功效, 富含三萜类和倍半萜吡啶生物碱类等活性物质。Lange等[41]应用MALDI-MSI分析了东北雷公藤(Tripterygium regelii Sprague et Takeda)根横切片中次生代谢产物的组织分布特征, 发现三萜类化合物(如celastrol和demethylzeylasteral)主要分布在周皮, 而倍半萜吡啶生物碱类化合物(如wilforgine和hypoglaunine D)主要分布在皮层。Eckelmann等[42]应用MALDI-MSI分析了Putterlickia pyracantha的根、茎和叶中次生代谢产物的组织分布特征, 发现具有高效抗癌活性的美登素及其衍生物(如maytansine和maytanprine)主要分布在茎的维管形成层及韧皮部中, 木质部中亦有少量分布, 周皮中没有发现此类化合物。银杏叶片中含有种类数量繁多的黄酮类化合物, 具有抗氧化、改善血液循环等药理活性。Li等[43]应用高质量分辨率MALDI-MSI分析了银杏(Ginkgo biloba L.)叶片中黄酮类化合物的组织分布特征, 其中银杏中特有的双黄酮类化合物(如amentoflavone和bilobetin)仅分布于叶片表面。桑叶是桑科植物桑(Morus alba L.)的干燥叶, 含有多种活性物质。Liu等[44]利用MALDI-MSI和离子液体基质(2, 5-二羟基苯甲酸/N, N-二甲基苯胺, DHB/DMA)分析了桑叶表面和叶脉纵切片中多种物质的空间分布特征, 发现chlorogenic acid、cyanidin-3-O-glucoside和quercetin-3-(O-acetyl)-glucopyranoside等化合物在叶面和叶脉中均有分布, 而isoquercitrin、rutin和kaempferol-3-O-rutinoside则在桑叶表面靠近叶脉处分布较多, 在叶脉内部纵切片中没有发现rutin的分布。

|
Figure 2 MALDI images of the Glycyrrhiza glabra (licorice) rhizome, recorded with a pixel size of 30 μm and 255×205 pixels in the image. The mass accuracy was better than 2 ppm (RMS), and a bin width of m/z = 5 ppm was used. (A) Optical image of the rhizome, (B) Free flavonoids: m/z 323.127 79 ([Glabrene+H]+); m/z 339.122 70 ([Licoagroaurone+H]+); m/z 339.159 09 ([Methylglabridin/Licochalcone A/Licochalcone C+H]+); m/z 391.190 39 ([Hispaglabridin B+H]+); m/z 393.206 04 ([Hispaglabridin A/Glabrol+H]+); m/z 409.200 95 ([3-Hydroxyglabrol+H]+); m/z 411.216 60 ([Kanzonol Y+H]+); m/z 729.305 81 ([Licoagrodin+H]+); (C) Flavonoid glycosides: m/z 457.089 54 ([Liquiritin/Neoliquiritin/Isoliquiritin/Neoisoliquiritin+K]+); m/z 589.131 80 ([Liquiritin apioside/Isoliquiritin apioside/Licuroside+K]+); m/z 603.111 06 ([Schaftoside/Isoschaftoside+K]+); m/z 617.126 72 ([Isoviolanthin+K]+)[39] |
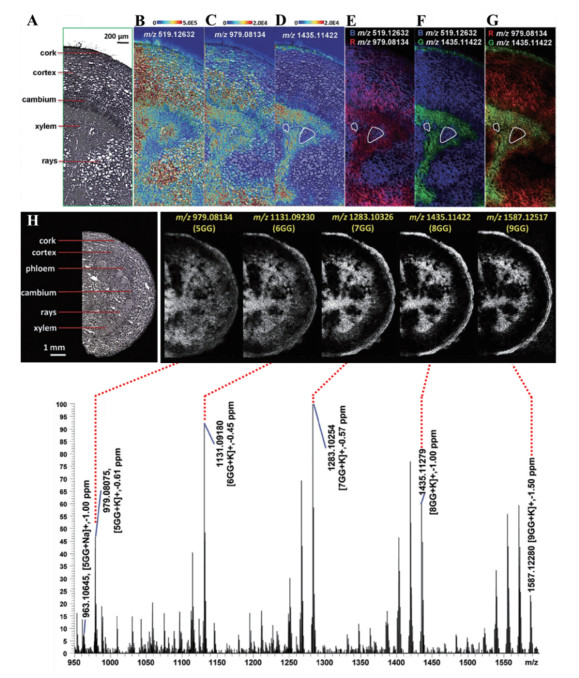
通过整合基因组、转录组、蛋白质组和代谢组等多组学技术方法, 发掘生物合成途径中的所有酶并确认其功能, 极大的促进了天然产物生物合成途径的完全或部分阐明。研究发现次生代谢产物的合成与累积常常不在同一器官中进行, 即使是同一合成途径中的酶也在不同的细胞中被发现[46]。因此, 利用MALDI-MSI技术可以精准定位和追踪药用植物组织中多种成分的空间分布, 为其生物合成途径的不断解析提供重要科学依据。Yamamoto等[46]利用MALDI-MSI和单细胞质谱技术首次揭示了长春花[Catharanthus roseus (L.) G. Don]茎中萜类吲哚生物碱(terpenoid indole alkaloids, TIAs)生物合成中关键中间体的组织分布特征。结果发现, TIAs合成中的重要中间体(如catharanthine和serpentine)分布在异细胞和乳管细胞中。这些发现为阐明长春花次生代谢产物的空间分布网络及其体内转运机制具有重要意义。Li等[47]应用高空间分辨率AP-MALDI MSI首次揭示了芍药根中不同取代度的没食子酰单宁类化合物(五、六、七、八、九没食子酰葡萄糖)的空间分布特征。其中, 五没食子酰葡萄糖作为六、七、八、九没食子酰葡萄糖的前体物质, 广泛分布于芍药根中, 而其产物的分布则局限于木栓层和木质部区域, 提示不同取代度的没食子酰葡萄糖在功能上存在差异(图 3)。因此, MALDI-MSI结果为研究芍药中没食子酰单宁类化合物的生物合成、转运途径及功能提供了科学依据。Marques等[52]利用MALDI-MSI分析了桃儿七近缘属植物中生物碱的组织空间分布特征, 并结合转录组等多组学技术, 发现了桃儿七近缘属植物中一条未知的阿朴啡型生物碱合成途径, 以及木脂素和生物碱合成途径之间的同源关系。Li等[43]应用MALDI-MSI揭示了银杏根、茎和幼嫩叶片中银杏内酯类化合物的空间分布特征, 并结合基因表达分析[55], 证实了银杏内酯是在根中合成, 通过茎向叶转运, 为进一步阐明银杏内酯生物合成、转运途径及累积规律提供了丰富的空间信息和重要参考依据。Kusari等[48]应用MALDI-MSI分析了金丝桃属植物Hypericum perforatum和Hypericum olympicum叶片表面, 揭示了二蒽酮类和黄酮类化合物的组织特异性分布。MSI结果显示二蒽酮类化合物(如hypericin)的信号仅分布在叶片表面黑色腺点中, 与DESI-MSI和LDI-MSI结果一致[56, 57], 而黄酮类化合物在叶片黑色腺点和叶片表面其他部位中均有分布。此外, Kusari等[48]通过MALDI-MSI结果还发现金丝桃素(hypericin)的前体物质emodin在H. perforatum和H. olympicum叶片表面的分布区域较广, 除腺点外emodin在叶片其他区域也有分布, 而对于不含金丝桃素及其衍生物的H. patulum, emodin仅分布于叶片表面的腺点中。因此, MALDI-MSI结果为证明金丝桃素是在叶片黑色腺点以外的部位合成, 然后转运并贮存在黑色腺点中这一假说提供了实验证据。

|
Figure 3 MALDI images of a root cross-section of Paeonia lactiflora. (A) Optical image of a region of interest. (B-D) Overlay of optical image and individual ion images at scanning step size of 10 μm, including (B) m/z 519.126 32 ([PA/AL+K]+); (C) m/z 979.081 34 ([5GG+K]+) and (D) m/z 1435.114 22 ([8GG+K]+). (E) Overlay of ion images for m/z 519.126 32 (blue, [PA/AL+K]+) and m/z 979.081 34 (red, [5GG+K]+). (F) Overlay of ion images for m/z 519.126 32 (blue, [PA/AL+K]+) and m/z 1435.114 22 (green, [8GG+K]+). (G) Overlay of ion images for m/z 979.081 34 (red, [5GG+K]+) and m/z 1435.114 22 (green, [8GG+K]+). The regions presenting subtle differences in xylem were marked with a white line. (H) Representative MS spectra and associated ion images of selected analyte distributions in the root of Paeonia lactiflora at a scanning step size of 30 μm. All ion images were generated with a bin width of ± 5 ppm. PA (Paeoniflorin), AL (Albiflorin) and GG (Galloylglucose)[47] |
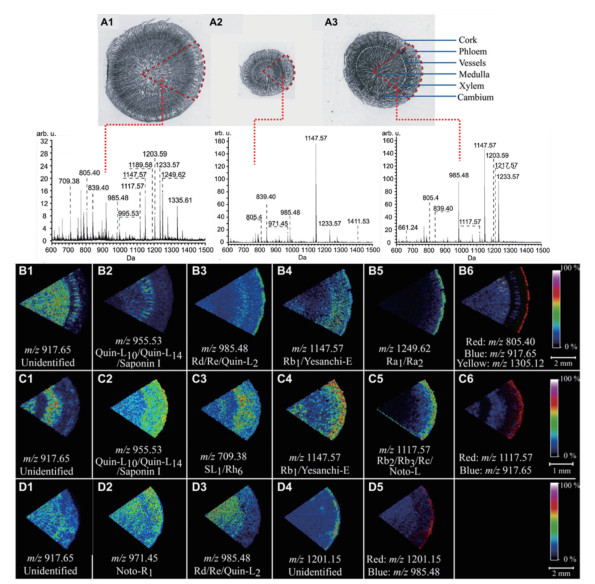
来源于同属不同种的药用植物形态往往比较相似。Lai等[36]应用MALDI-MS法分析了同属五加科的人参与西洋参根横切片, 发现两者所含的人参皂苷类物质与其他一些小分子化合物存在明显差异。Wang等[37]建立了人参、三七和西洋参3种重要五加科药用植物的快速MALDI-MSI鉴别方法。通过对三者根横切片中化学成分的原位分析, 发现皂苷的含量和分布均存在明显差异(图 4)。此外, Bai等[38]优化了人参切片的MSI分析方法, 分析了不同生长年限人参根中皂苷类化合物的空间分布特征, 并借助主成分分析, 发现分布在木栓层部位的人参皂苷类物质具有显著性差异, 能够用来区分2年生、4年生和6年生的人参样品。

|
Figure 4 Optical images of tissue section and localization modes of saponin ions in root tissues of the three Panax species. (A1), (A2), and (A3), optical image of tissue section and the overall average mass spectra of PG, PQ, and PN gained by MALDI-TOF-MSI, respectively. (B1-B5) five localization modes of saponin ions in root tissue of PG:(B1), cambium-xylem-medulla (CaXM); (B2), xylem-only (XO); (B3), cork-xylem (CX); (B4), cork-phloem-cambium-medulla (CPCaM); (B5), cork-only (CO) type.(C1-C5) five localization modes of saponin ions in root tissue of PQ:(C1), CaXM; (C2), cork-phloem-cambium (CPCa); (C3), cambium-only (CaO); (C4), cork-phloem-medulla (CPM); (C5), CO type. (D1-D4) three localization modes of saponin ions in PN: (D1) and (D3), xylem-medulla (XM); (D2), phloem-xylem-medulla (PXM); (D4), CO type. (B6), (C6), and (D5), overlay of ion images in PG, PQ, and PN, respectively[37] |
药用植物使用过程中逐渐形成了特色鲜明的加工方法, 直接影响中药的质量。白芍为毛茛科植物芍药的干燥根, 具有养血调经、敛阴止汗、柔肝止痛、平肝抑阳的功效, 其主要活性物质为单萜苷类化合物。白芍的传统加工方法为置沸水中煮后除去外皮或去皮后再煮。但Li等[47]应用高空间分辨率AP-MALDI MSI分析了芍药根切片中的次生代谢产物空间分布特征, 发现主成分芍药苷及其他药效物质主要分布在外皮及皮内除木质部的大部分区域。因此, 传统的白芍采收加工方法可能会导致药材中芍药苷等有效成分的含量降低。
3 总结与展望MALDI-MSI技术在药用植物研究中获得了越来越多的认可, 为研究药用部位中药效物质的组织分布, 合成、转运和累积, 以及药材的鉴定、品质评价、采收加工等方面提供了新技术、新方法。由于植物组织本身的特点, 需要开发更加完善与更具针对性的样品制备方法, 筛选具有高特异性的基质, 提高植物中微量、痕量次生代谢产物的检测。随着MALDI-MSI技术的发展和完善, 必将在药用植物研究中展现更多的可能性和更广阔的应用前景。
| [1] | Wolfender JL, Marti G, Thomas A, et al. Current approaches and challenges for the metabolite profiling of complex natural extracts[J]. J Chromatogr A, 2015, 1382: 136–164. DOI:10.1016/j.chroma.2014.10.091 |
| [2] | Ernst M, Silva DB, Silva RR, et al. Mass spectrometry in plant metabolomics strategies: from analytical platforms to data acquisition and processing[J]. Nat Prod Rep, 2014, 31: 784–806. DOI:10.1039/c3np70086k |
| [3] | Wurtzel ET, Kutchan TM. Plant metabolism, the diverse chemistry set of the future[J]. Science, 2018, 353: 1232–1236. |
| [4] | Zhang Z, Bo T, Bai Y, et al. Quadrupole time-of-flight mass spectrometry as a powerful tool for demystifying traditional Chinese medicine[J]. TrAC Trends Anal Chem, 2015, 72: 169–180. DOI:10.1016/j.trac.2015.04.021 |
| [5] | McDonnell LA, Rompp A, Balluff B, et al. Discussion point: reporting guidelines for mass spectrometry imaging[J]. Anal Bioanal Chem, 2015, 407: 2035–2045. DOI:10.1007/s00216-014-8322-6 |
| [6] | Hansen RL, Lee YJ. High-spatial resolution mass spectrometry imaging: toward single cell metabolomics in plant tissues[J]. Chem Rec, 2018, 18: 65–77. DOI:10.1002/tcr.201700027 |
| [7] | Spengler B. Mass spectrometry imaging of biomolecular information[J]. Anal Chem, 2015, 87: 64–82. DOI:10.1021/ac504543v |
| [8] | Bodzon-Kulakowska A, Suder P. Imaging mass spectrometry: instrumentation, applications, and combination with other visualization techniques[J]. Mass Spectrom Rev, 2016, 35: 147–169. DOI:10.1002/mas.21468 |
| [9] | Kompauer M, Heiles S, Spengler B. Atmospheric pressure MALDI mass spectrometry imaging of tissues and cells at 1.4-μm lateral resolution[J]. Nat Methods, 2017, 14: 90–96. DOI:10.1038/nmeth.4071 |
| [10] | Zhang QY, Nie HG. Advances in mass spectrometry imaging technology[J]. Anal Instrum (分析仪器), 2018(5): 1–10. |
| [11] | Karas M, Hillenkamp F. Laser desorption ionization of proteins with molecular masses exceeding 10 000 Daltons[J]. Anal Chem, 1988, 60: 2299–2301. DOI:10.1021/ac00171a028 |
| [12] | Tanaka K, Waki H, Ido Y, et al. Protein and polymer analyses up to m/z 100 000 by laser ionization time-of-flight mass spectrometry[J]. Rapid Commun Mass Spectrom, 1988, 2: 151–153. DOI:10.1002/(ISSN)1097-0231 |
| [13] | Spengler B, Hubert M, Kaufmann R. Proceedings of the 42nd ASMS Conference on Mass Spectrometry and Allied Topics [C]. Chicago, Illinois, 1994: 1041. |
| [14] | Caprioli RM, Farmer TB, Gile J. Molecular imaging of biological samples: localization of peptides and proteins using MALDI-TOF MS[J]. Anal Chem, 1997, 69: 4751–4760. DOI:10.1021/ac970888i |
| [15] | Schwartz SA, Reyzer ML, Caprioli RM. Direct tissue analysis using matrix-assisted laser desorption/ionization mass spectrometry: practical aspects of sample preparation[J]. J Mass Spectrom, 2003, 38: 699–708. DOI:10.1002/(ISSN)1096-9888 |
| [16] | Dill AL, Eberlin LS, Costa AB, et al. Data quality in tissue analysis using desorption electrospray ionization[J]. Anal Bioanal Chem, 2011, 401: 1949–1961. DOI:10.1007/s00216-011-5249-z |
| [17] | Zaima N, Hayasaka T, Goto-Inoue N, et al. Matrix-assisted laser desorption/ionization imaging mass spectrometry[J]. Int J Mol Sci, 2010, 11: 5040–5055. DOI:10.3390/ijms11125040 |
| [18] | Goto-Inoue N, Hayasaka T, Zaima N, et al. Imaging mass spectrometry visualizes ceramides and the pathogenesis of Dorfman-Chanarin syndrome due to ceramide metabolic abnormality in the skin[J]. PLoS One, 2012, 7: 49519. DOI:10.1371/journal.pone.0049519 |
| [19] | Gemperline E, Jayaraman D, Maeda J, et al. Multifaceted investigation of metabolites during nitrogen fixation in Medicago via high resolution MALDI-MS imaging and ESI-MS[J]. J Am Soc Mass Spectrom, 2015, 26: 149–158. DOI:10.1007/s13361-014-1010-0 |
| [20] | Khatib-Shahidi S, Andersson M, Herman JL, et al. Direct molecular analysis of whole-body animal tissue sections by imaging MALDI mass spectrometry[J]. Anal Chem, 2006, 78: 6448–6456. DOI:10.1021/ac060788p |
| [21] | Sugiura Y, Shimma S, Setou M. Thin sectioning improves the peak intensity and signal-to-noise ratio in direct tissue mass spectrometry[J]. J Mass Spectrom Soc Jpn, 2006, 54: 45–48. DOI:10.5702/massspec.54.45 |
| [22] | Cha S, Zhang H, Ilarslan HI, et al. Direct profiling and imaging of plant metabolites in intact tissues by using colloidal graphite-assisted laser desorption ionization mass spectrometry[J]. Plant J, 2008, 55: 348–360. DOI:10.1111/tpj.2008.55.issue-2 |
| [23] | Li B, Zhang Y, Ge J, et al. Sample preparation for mass spectrometry imaging of leaf tissues: a case study on analyte delocalization[J]. Anal Bioanal Chem, 2018, 410: 7449–7456. DOI:10.1007/s00216-018-1355-5 |
| [24] | Soares MS, Silva DF, Forim MR, et al. Quantification and localization of hesperidin and rutin in Citrus sinensis grafted on C. limonia after Xylella fastidiosa infection by HPLC-UV and MALDI imaging mass spectrometry[J]. Phytochemistry, 2015, 115: 161–170. DOI:10.1016/j.phytochem.2015.02.011 |
| [25] | Wang Y, Xu W, Li L, et al. Relative molecular weight determination of astragalus polysaccharides for injection[J]. Acta Pharm Sin (药学学报), 2019, 54: 348–353. |
| [26] | Korte AR, Lee YJ. MALDI-MS analysis and imaging of small molecule metabolites with 1, 5-diaminonaphthalene (DAN)[J]. J Mass Spectrom, 2014, 49: 737–741. DOI:10.1002/jms.3400 |
| [27] | Ayorinde FO, Bezabeh DZ, Delves IG. Preliminary investigation of the simultaneous detection of sugars, ascorbic acid, citric acid, and sodium benzoate in non-alcoholic beverages by matrix-assisted laser desorption/ionization time-of-flight mass spectrometry[J]. Rapid Commun Mass Spectrom, 2003, 17: 1735–1742. DOI:10.1002/(ISSN)1097-0231 |
| [28] | Jackson SN, Baldwin K, Muller L, et al. Imaging of lipids in rat heart by MALDI-MS with silver nanoparticles[J]. Anal Bioanal Chem, 2014, 406: 1377–1386. DOI:10.1007/s00216-013-7525-6 |
| [29] | Lee KH, Chiang CK, Lin ZH, et al. Determining enediol compounds in tea using surface-assisted laser desorption/ionization mass spectrometry with titanium dioxide nanoparticle matrices[J]. Rapid Commun Mass Spectrom, 2007, 21: 2023–2030. DOI:10.1002/(ISSN)1097-0231 |
| [30] | Wu Q, Chu JL, Rubakhin SS, et al. Dopamine-modified TiO2 monolith-assisted LDI MS imaging for simultaneous localization of small metabolites and lipids in mouse brain tissue with enhanced detection selectivity and sensitivity[J]. Chem Sci, 2017, 8: 3926–3938. DOI:10.1039/C7SC00937B |
| [31] | Berry KA, Hankin JA, Barkley RM, et al. MALDI imaging of lipid biochemistry in tissues by mass spectrometry[J]. Chem Rev, 2011, 111: 6491–6512. DOI:10.1021/cr200280p |
| [32] | Bouschen W, Schulz O, Eikel D, et al. Matrix vapor deposition/recrystallization and dedicated spray preparation for high-resolution scanning microprobe matrix-assisted laser desorption/ionization imaging mass spectrometry (SMALDI-MS) of tissue and single cells[J]. Rapid Commun Mass Spectrom, 2010, 24: 355–364. DOI:10.1002/rcm.4401 |
| [33] | Yang J, Caprioli RM. Matrix sublimation/recrystallization for imaging proteins by mass spectrometry at high spatial resolution[J]. Anal Chem, 2011, 83: 5728–5734. DOI:10.1021/ac200998a |
| [34] | Deininger SO, Cornett DS, Paape R, et al. Normalization in MALDI-TOF imaging datasets of proteins: practical considerations[J]. Anal Bioanal Chem, 2011, 401: 167–181. DOI:10.1007/s00216-011-4929-z |
| [35] | Tang W, Chen J, Zhou J, et al. Quantitative MALDI imaging of spatial distributions and dynamic changes of tetrandrine in multiple organs of rats[J]. Theranostics, 2019, 9: 932–944. DOI:10.7150/thno.30408 |
| [36] | Lai YH, So PK, Lo SC, et al. Rapid differentiation of Panax ginseng and Panax quinquefolius by matrix-assisted laser desorption/ionization mass spectrometry[J]. Anal Chim Acta, 2012, 753: 73–81. DOI:10.1016/j.aca.2012.09.047 |
| [37] | Wang S, Bai H, Cai Z, et al. MALDI imaging for the localization of saponins in root tissues and rapid differentiation of three Panax herbs[J]. Electrophoresis, 2016, 37: 1956–1966. DOI:10.1002/elps.201600027 |
| [38] | Bai H, Wang S, Liu J, et al. Localization of ginsenosides in Panax ginseng with different age by matrix-assisted laser-desorption/ionization time-of-flight mass spectrometry imaging[J]. J Chromatogr B, 2016, 1026: 263–271. DOI:10.1016/j.jchromb.2015.09.024 |
| [39] | Li B, Bhandari DR, Janfelt C, et al. Natural products in Glycyrrhiza glabra (licorice) rhizome imaged at the cellular level by atmospheric pressure matrix-assisted laser desorption/ionization tandem mass spectrometry imaging[J]. Plant J, 2014, 80: 161–171. DOI:10.1111/tpj.2014.80.issue-1 |
| [40] | Feng B, Zhang J, Chang C, et al. Ambient mass spectrometry imaging: plasma assisted laser desorption ionization mass spectrometry imaging and its applications[J]. Anal Chem, 2014, 86: 4164–4169. DOI:10.1021/ac403310k |
| [41] | Lange BM, Fischedick JT, Lange MF, et al. Integrative approaches for the identification and localization of specialized metabolites in Tripterygium roots[J]. Plant Physiol, 2017, 173: 456–469. DOI:10.1104/pp.15.01593 |
| [42] | Eckelmann D, Kusari S, Spiteller M. Occurrence and spatial distribution of maytansinoids in Putterlickia pyracantha, an unexplored resource of anticancer compounds[J]. Fitoterapia, 2016, 113: 175–181. DOI:10.1016/j.fitote.2016.08.006 |
| [43] | Li B, Neumann EK, Ge J, et al. Interrogation of spatial metabolome of Ginkgo biloba with high-resolution matrix-assisted laser desorption/ionization and laser desorption/ionization mass spectrometry imaging[J]. Plant Cell Environ, 2018, 41: 2693–2703. DOI:10.1111/pce.13395 |
| [44] | Liu XN, Pei X, Gong C, et al. Matrix-assisted laser desorption ionization-mass spectrometry imaging of small molecules in mulberry leaf using ionic liquid as matrix[J]. Chin J Anal Chem (分析化学), 2018, 46: 1923–1930. |
| [45] | Niziol J, Sekula J, Ruman T. Visualizing spatial distribution of small molecules in the rhubarb stalk (Rheum rhabarbarum) by surface-transfer mass spectrometry imaging[J]. Phytochemistry, 2017, 139: 72–80. DOI:10.1016/j.phytochem.2017.04.006 |
| [46] | Yamamoto K, Takahashi K, Mizuno H, et al. Cell-specific localization of alkaloids in Catharanthus roseus stem tissue measured with imaging MS and single-cell MS[J]. Proc Natl Acad Sci U S A, 2016, 113: 3891–3896. DOI:10.1073/pnas.1521959113 |
| [47] | Li B, Bhandari DR, Rompp A, et al. High-resolution MALDI mass spectrometry imaging of gallotannins and monoterpene glucosides in the root of Paeonia lactiflora[J]. Sci Rep, 2016, 6: 36074. DOI:10.1038/srep36074 |
| [48] | Kusari S, Sezgin S, Nigutova K, et al. Spatial chemo-profiling of hypericin and related phytochemicals in Hypericum species using MALDI-HRMS imaging[J]. Anal Bioanal Chem, 2015, 407: 4779–4791. DOI:10.1007/s00216-015-8682-6 |
| [49] | Ng KM, Liang Z, Lu W, et al. In vivo analysis and spatial profiling of phytochemicals in herbal tissue by matrix-assisted laser desorption/ionization mass spectrometry[J]. Anal Chem, 2007, 79: 2745–2755. DOI:10.1021/ac062129i |
| [50] | Harada T, Yuba-Kubo A, Sugiura Y, et al. Visualization of volatile substances in different organelles with an atmospheric-pressure mass microscope[J]. Anal Chem, 2009, 81: 9153–9157. DOI:10.1021/ac901872n |
| [51] | Taira S, Ikeda R, Yokota N, et al. Mass spectrometric imaging of ginsenosides localization in Panax ginseng root[J]. Am J Chin Med, 2010, 38: 485–493. DOI:10.1142/S0192415X10008007 |
| [52] | Marques JV, Dalisay DS, Yang H, et al. A multi-omics strategy resolves the elusive nature of alkaloids in Podophyllum species[J]. Mol Biosyst, 2014, 10: 2838–2849. DOI:10.1039/C4MB00403E |
| [53] | Beck S, Stengel J. Mass spectrometric imaging of flavonoid glycosides and biflavonoids in Ginkgo biloba L.[J]. Phytochemistry, 2016, 130: 201–206. DOI:10.1016/j.phytochem.2016.05.005 |
| [54] | He H, Qin L, Zhang Y, et al. 3, 4-Dimethoxycinnamic acid as a novel matrix for enhanced in situ detection and imaging of low-molecular-weight compounds in biological tissues by MALDI-MSI[J]. Anal Chem, 2019, 91: 2634–2643. DOI:10.1021/acs.analchem.8b03522 |
| [55] | Lu X, Yang H, Liu X, et al. Combining metabolic profiling and gene expression analysis to reveal the biosynthesis site and transport of ginkgolides in Ginkgo biloba L.[J]. Front Recent Dev Plant Sci, 2017, 8: 872. DOI:10.3389/fpls.2017.00872 |
| [56] | Thunig J, Hansen SH, Janfelt C. Analysis of secondary plant metabolites by indirect desorption electrospray ionization imaging mass spectrometry[J]. Anal Chem, 2011, 83: 3256–3259. DOI:10.1021/ac2004967 |
| [57] | Holscher D, Shroff R, Knop K, et al. Matrix-free UV-laser desorption/ionization (LDI) mass spectrometric imaging at the single-cell level: distribution of secondary metabolites of Arabidopsis thaliana and Hypericum species[J]. Plant J, 2009, 60: 907–918. DOI:10.1111/tpj.2009.60.issue-5 |
 2019, Vol. 54


