2. 南开大学, 药物化学生物学国家重点实验室, 天津 300353;
3. 天津药物研究院, 中药质量标志物研究中心, 天津 300193;
4. 天津药物研究院, 释药技术与药代动力学国家重点实验室, 天津 300193
2. State Key Laboratory of Medicinal Chemical Biology, Nankai University, Tianjin 300353, China;
3. Research Center of TCM Quality Marker, Tianjin Institute of Pharmaceutical Research, Tianjin 300193, China;
4. State Key Laboratory of Drug Delivery and Pharmacokinetics, Tianjin Institute of Pharmaceutical Research, Tianjin 300193, China
中药质量是中药临床疗效的保障, 长期以来中药材呈现多基源、多产地的复杂性, 以及采收季节与年份的不确定性, 给中药材的质量评价、溯源以及管理上带来了困难。虽然近年来中药质量研究水平有了长足的进步, 但目前部分中药质量控制指标与有效性的关联性不强、专属性差, 仍未能满足当前对中药质量控制的要求, 难以反映出不同药材的质量特质。而现代中药的质量评价更需要注重中医药的特色, 不仅要体现其本草学属性、生物学内涵以及化学性质等方面的信息, 同时要具有可操作性, 适合基层检测工作的需要。
药材中化学成分的差异是决定药材的有效性以及安全性的关键因素, 2016年刘昌孝院士提出的中药质量标志物(Q-marker)的概念为中药的质量研究与应用提供了新的思路[1, 2]。化学标志物是指药材之间存在差异的化学成分, 而质量标志物则是指那些与有效性以及安全性直接相关的化学成分。因此中药质量标志物是建立以疗效为核心质量控制体系的关键, 同时也为中药质量传递和溯源提供了一个明确的可以检测的化学成分。因此建立以质量标志物为核心的简便快捷、智能化的分析体系对中药质量的评价具有重要的现实意义。
1 中药材的智能评价方法的研究人工智能技术(artificial intelligence, AI)已经在药物研发领域展示了巨大的发展潜力[3]。随着数据挖掘技术、化学信息学、计算生物学的快速发展, 人工智能不仅可以整合传统经验和现代生物学数据发现新的信息, 而且已经开始将其学习训练和迭代的结果应用于诊疗与评估中[4, 5]。人工智能感知技术(artificial intelligence sense technology, AIST)包括电子舌、电子鼻、电子眼、电子耳及电子皮肤等技术可以模拟真实的人的感觉器官, 并逐渐开始应用在药物评价和中药质量控制中[6, 7]。而随着人工智能技术的发展, 新型分析技术, 例如红外光谱、高光谱成像、化学成像等在中药质量评价中显得越来越重要[8, 9]。近红外光谱技术具有快速无损等特点, 对饮片、浸膏以及固体粉末等均可以直接进行定性及定量分析, 因此在中药分析方面具有较强的优势[10]。近红外光谱鉴别中药的原理也基于中药材的次生代谢产物的特异性, 通过采集光谱反映和表征其全部化学成分的综合信息, 并借助化学计量学的帮助对数据信息进行深入挖掘和利用, 用于中药材鉴定和聚类分析[11, 12]、药材炮制工艺或真伪的鉴别[13, 14]以及多个药效成分同时定量分析及生产过程监控[15, 16]。
2 近红外光谱技术在中药材定性和定量分析中的应用近红外光谱可以发现不同产地的同种药材以及同属药材组织结构以及化学成分上的微小差异, 并通过化学计量学算法可以实现产地的聚类与判别[17, 18]、贵重药材掺伪的判别分析[19, 20]、炮制前后化学成分及水分的变化[21, 22]以及硫磺熏蒸等[23], 并逐渐发展成为一种简单可靠的药材中药效成分的评价方法。但由于每种药材的情况不同, 无特定规律可循, 为了达到理想的结果通常需要从光谱预处理、算法拟合、波长选择等不同的角度进行组合优化。表 1总结了近期利用近红外光谱技术定量分析的实例, 发现大多算法均是基于偏最小二乘判别分析(partial least-squares discriminant analysis, PLS-DA)及主成分分析(principal component analysis, PCA)等算法实现的[24-32]。
| Table 1 Application of NIRS in analysis of effective components of Chinese medicinal materials (CMM) |
虽然近年来近红外分析技术在中药分析领域取得了较快的发展, 但作为法定技术标准依然没有得到认可。其原因之一可能是基于药材自身特点的理论体系与技术方法尚未完善, 限制了该技术的进一步发展。
目前中药近红外光谱分析的研究多集中在筛选波段, 光谱预处理以及化学计量学算法的开发, 往往忽略了一些药材本身的重要信息, 例如: ①希望依靠复杂的化学计量学方法去实现多基源药材的分类鉴定和分析, 而忽略了如何去寻找和提炼药材间相互区别的化学物质的信息; ②仅围绕中药材中某几个成分建立模型, 缺乏对所选择成分的合理性以及功效关联性的研究, 无法体现其本草学属性及其生物学内涵; ③缺乏对特征性的光谱信息的深度挖掘和利用, 检测的精度和可靠性有待进一步提高; ④面对成分复杂且有效成分含量低的样本, 待测化合物是否适合近红外定量检测限的要求, 还有待进一步探讨。此外, 近红外仪器设备的小型化、检测精度和稳定性以及价格的合理化等这些都制约了近红外技术的应用与发展。
4 近红外方法检测中药材的物质基础“四气五味”是中医药性理论的核心, 而其“气”与“味”的物质基础就是指药材中的化学成分, 主要是指植物的次生代谢产物。依据植物种类、药用部位的不同, 其累计的类型与含量也不同, 这是药材发挥功效的物质基础, 同时也是近红外光谱赖以检测分析的物质基础。近红外光谱可以全面反映药材的整体信息, 包括密度、组成、化学成分等, 因此对于药材的宏观聚类分析具有独特的优势。
4.1 近红外光谱用于中药材聚类鉴别的可行性这里引入化学计量学中的模式识别方法, 对16种不同中药材的481批样本进行近红外聚类分类, 尝试近红外光谱对中药材识别的可行性(图 1)。首先采用Kennard-Stone算法将样本随机划分为校正集与验证集。为了建立理想的分类器, 在使用主成分聚类分析之前, 通过一阶导数结合矢量归一化光谱预处理方法, 可以消除光谱中由于样本粉碎粒径不均一等物理信息的干扰, 通过光谱区域的选择以及光谱预处理方案可以突出光谱中微弱的化学信号, 从而提高分类器的识别效果。这里采用12种不同光谱预处理方法, 并通过PCA方法寻找近红外的光谱特征, 结果发现当设定PCA-MD以及SIMCA分类器参数时, 使用长波近红外区域(9 000~4 000 cm-1), 并采用一阶导数结合矢量归一化光谱预处理其判别效果最佳。当将所采用的主成分数设为5时, 16种药材在SIMCA分类器的条件下, 药材的识别率可以达到90.0%以上, 而误分类的样本主要来自于样本量比较小的五味子与黄连等药材。上述结果说明, 通过借助化学计量学技术寻找近红外的特征性光谱特征可以实现对不同中药材的聚类, 其根本原因是样本中存在特异性的差异成分, 而由这些成分间的微小变化所引起近红外吸收的C-H、O-H、N-H、S-H和C=O等基团的差异最终导致了近红外光谱的不同, 发现这些细微的差异可以实现药材的鉴别和分类。

|
Figure 1 Cluster analysis of different Chinese medicinal materials (CMM) by near infrared spectrum (NIRS). A: Original NIRS for 16 kinds CMM; B: NIRS after first-order derivative combined with de-trend pretreatment; C: The cluster distribution of different CMM in two-dimensional space; D: The cluster distribution of different CMM in three-dimensional space |
为了挖掘近红外光谱的特征性信息, 揭示复杂的化学计量学鉴别方法的科学内涵, 进一步选择上述药材中亲缘关系较近的金银花(69批)与山银花(32批)为例, 分别采集其近红外光谱(图 2A), 选择9 000~4 000 cm-1波数区间, 对两类银花样本进行深入分析[33]。样本首先经一阶导数结合矢量归一化预处理, 偏最小二乘判别分析, 其第一与第二潜在变量能够解析全谱的87%信息, 可将两类银花样本进行很好的判别分类(图 2B)。而如图 2C所示, 其中一些具有较大回归系数绝对值的波数点对两类银花样本的区分具有显著的贡献。

|
Figure 2 PLS-DA analysis by NIRS in the different Lonicera japonica flos and Lonicera flos samples. A: NIRS after first-order derivative pretreatment; B: Score plot of the NIRS with the specific spectra; C: Regression coefficient of the PLS-DA analysis for the principal component; D: NIRS of two representative chemical markers; E: Score plot of the PCA cluster with the dominated wavenumber points; F: Loading plot of the PCA result of the two chemical markers |
研究发现苯丙酸类成分和环烯醚萜类成分分别代表了山银花和金银花的主要的标志性成分[34, 35]。因此作者分别采集了绿原酸和獐芽菜苦苷对照品的近红外光谱(图 2D), 并通过相同的光谱处理方法和主成分分析(图 2E), 结果发现仅第一主成分下就可以反映89%的光谱信息, 获得良好的分类结果。而在第一主成分下发现具有较大载荷值的5个波数点4 382、4 436、4 914、5 142和5 354 cm-1 (图 2F), 恰好与图 2C中的高载荷值高度重叠。其中波数点4 382与4 436 cm-1为C-H弯曲振动与伸缩振动组合频吸收, 4 914 cm-1落入O-H的弯曲振动与伸缩振动组合频吸收区, 5 142与5 354 cm-1落入C=O的二级倍频吸收区, 可能分别来源于不同化学环境下绿原酸上亚甲基、羟基和C=O等基团。以上研究结果说明, 药材中化学成分与基团的差异是近红外光谱分析技术的聚类判别的物质基础, 因此通过筛选这些化学标志物, 利用其特征性的波数点或波数区间的光谱信息, 可以更加简便准确的实现中药材的红外光谱模式识别分析。
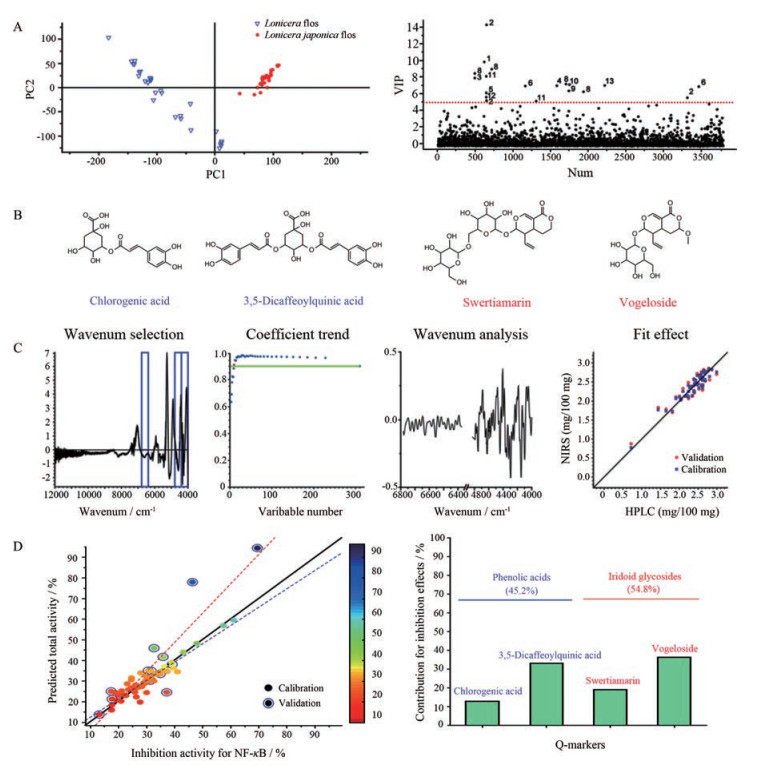
5 基于质量标志物建立金银花抗炎功效的智能评价体系中药质量标志物不仅要具有明确的化学结构、生物活性、药材专属性, 并能反映出“君药”特质的代表性物质, 还要求是可以用于精确测量的化学成分[1, 2]。依据上述原则通过UPLC/Q-TOF-MS分析结合模式识别方法, 作者确定了金银花与山银花两种药材中的11种化学标志物(图 3A)。进一步通过谱效筛选、生物学评价以及药材中的含量分布情况考察, 发现其中与“清热解毒”相关的为绿原酸、异绿原酸A、獐芽菜苦苷以及断氧化马钱子苷半缩醛内酯等4种主要成分(图 3B), 为金银花的抗炎相关的质量标志物[36]。为了基于上述质量标志物建立一种简单有效的可以多成分同时定量的近红外分析模型, 首先应用联合偏最小二乘区间算法获得光谱预处理方法、最适波长组合区间以及潜在的变量数等信息。以绿原酸为例, 如图 3C中所示蓝色框区域即是模型优化出的最适波长组合区间, 再通过竞争自适应重加权采样分析算法进一步在筛选得到的最适波长组合区间中特征性的波数点, 选择满足回归系数R > 0.9的最少变量建模, 这样可以简化运算过程并提高准确性, 如图 3C Fit effect部分可以和液相检测相比得到满意的预测效果。

|
Figure 3 Q-marker screening and quality evaluation system based on UPLC/Q-TOF MS and NIRS. A: Score plot of UPLC/Q-TOF MS and PLS-DA analysis for honeysuckle bud samples; B: Chemical structures of Q-marker; C: Wavenumber selection, regression coefficient trend, wavenumber points selection and correlation diagrams between NIRS predicted values and HPLC detection; D: Prediction total bioactivity versus the experimental values by BP-ANN, and estimate relative importance of each Q-markers using Garson's modified algorithm |
为了实现通过上述质量标志物的含量来预测金银花的抗炎活性, 作者基于上述66批金银花样本抗炎效果的检测, 以及对应的4种质量标志物的含量, 通过误差反向传输人工神经网络等算法, 建立了成分含量与活性之间的非线性的复杂关系, 并通过多次迭代完善, 基本实现了可以直接通过光谱数据扫描就可以评价出金银花的抗炎功效, 预测值与实测值基本吻合(图 3D左图)。图 3D右图反映了4种质量标志物的抗炎活性相对贡献率, 其中环烯醚萜类成分的抗炎活性贡献率为54.8%, 要高于酚酸类成分的抗炎贡献率(45.2%)。以上结果再次证明了酚酸类成分与环烯醚萜类成分同为金银花的清热解毒抗炎的质量标志物。
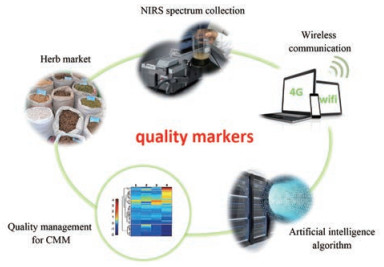
6 以中药质量标志物为核心搭建药材品质的智能评价体系中药质量标志物(Q-marker)反映了中药质量本质的科学内涵, 既是中药质量的核心概念, 又是中药产业的核心概念, 为中药行业监管提供了重要的切入点。构建以中药质量标志物为先导的中药材品质智能管理体系, 是一项复杂的系统工程, 涉及到了实现这一过程必要的创新技术手段。作者尝试并提出了从化学标志物到质量标志物, 由质量标志物到智能管理的解决方案[33, 37] (图 4)。其具体包括: ①引入代谢组学研究手段, 通过UPLC-Q/TOF获得中药材成分差异信息, 并结合模式识别技术(PCA, PLS-DA)寻找化学标志物; ②采用生物活性导向的评价方法对中药材中的成分进行筛查, 发现与功能主治相关的潜在质量标志物; ③利用质量标志物的特征官能团的特征光谱信息构建近红外模型, 提高预测的准确性; ④引入IUPAC推荐的间隔检测限理论判断近红外的检测限, 提高了所建模型预测可信度; ⑤整合人工神经网络算法通过多重特定功效的质量标志物建立近红外光谱与中药材整体活性之间的联系, 尝试利用近红外光谱从整体的角度评价药材的特定功效, 为中药品质的监管提供新的解决方案。

|
Figure 4 A smart NIRS evaluation system for quality management of CMM based on Q-markers |
如何实现从田间到临床的中药品质管理, 建立符合中医药特色的品质评价和质量智能管理体系, 实现传统产业升级和促进产业发展, 是实现中药现代化和国际化的基本保障。随着以人工智能技术的发展, 使中药品质研究相关大数据的收集和质量追溯成为可能。而建设基于中药质量标志物的中药材质量追溯和溯源系统才是最基本的要素[38]。如果能结合质量标志物的概念, 将这种简便快捷的近红外光谱技术与质量标志物的评判和溯源相结合, 开发出质量标志物的检测与相关功效评价为一体的智能化评价体系, 这将会对中药质量评价与监管产生重大的影响。
| [1] | Liu CX, Chen SL, Xiao XH, et al. A new concept on quality marker of Chinese materia medica:quality control for Chinese medicinal products[J]. Chin Tradit Herb Drugs (中草药), 2016, 47: 1443–1457. |
| [2] | Yang WZ, Zhang YB, Wu WY, et al. Approaches to establish Q-markers for the quality standards of traditional Chinese medicines[J]. Acta Pharm Sin B, 2017, 7: 439–446. DOI:10.1016/j.apsb.2017.04.012 |
| [3] | Ramesh AN, Kambhampati C, Monson JR, et al. Artificial intelligence in medicine[J]. Ann R Coll Surg Engl, 2004, 86: 334–338. |
| [4] | Feng Y, Wu Z, Zhou X, et al. Knowledge discovery in traditional Chinese medicine:state of the art and perspectives[J]. Artif Intell Med, 2006, 38: 219–236. DOI:10.1016/j.artmed.2006.07.005 |
| [5] | Zhao YX, Li ML. Application of pattern recognition to quality assessment of the traditional Chinese medicine[J]. China J Chin Mater Med (中国中药杂志), 2002, 27: 808–811. |
| [6] | Liu R, Chen P, Li X, et al. Artificial intelligence sense technology:new technology in pharmaceutical sciences[J]. Chin J Pharm Anal (药物分析杂志), 2017, 37: 559–567. |
| [7] | Yoshida M, Haraguchi T, Uchida T. Bitterness evaluation of acidic pharmaceutical substances (NSAIDs) using a taste sensor[J]. Chem Pharm Bull (Tokyo), 2014, 62: 1252–1258. DOI:10.1248/cpb.c14-00577 |
| [8] | Miao X, Cui Q, Wu H, et al. New sensor technologies in quality evaluation of Chinese materia medica:2010-2015[J]. Acta Pharm Sin B, 2017, 7: 137–145. DOI:10.1016/j.apsb.2016.10.001 |
| [9] | Sandasi M, Vermaak I, Chen W, et al. Skullcap and Germander:preventing potential toxicity through the application of hyper spectral imaging and multivariate image analysis as a novel quality control method[J]. Planta Med, 2014, 80: 1329–1339. DOI:10.1055/s-00000058 |
| [10] | Liu XS, Chen JS, Chen GQ, et al. On-line detection of concentration process of Ganmaoling granules by near infrared spectroscopy combined with automatic control system[J]. Acta Pharm Sin (药学学报), 2017, 52: 462–467. |
| [11] | Zhu J, Fan X, Cheng Y, et al. Chemometric analysis for identification of botanical raw materials for pharmaceutical use:a case study using Panax notoginseng[J]. PLoS One, 2014, 9: e87462. DOI:10.1371/journal.pone.0087462 |
| [12] | Liu XS, Sun FF, Jin Y, et al. Application of near infrared spectroscopy combined with particle swarm optimization based least square support vactor machine to rapid quantitative analysis of Corni Fructus[J]. Acta Pharm Sin (药学学报), 2015, 50: 1645–1651. |
| [13] | Xin N, Gu XF, Wu H, et al. Discrimination of raw and processed Dipsacus asperoides by near infrared spectroscopy combined with least squares-support vector machine and random forests[J]. Spectrochim Acta A Mol Biomol Spectrosc, 2012, 89: 18–24. DOI:10.1016/j.saa.2011.12.006 |
| [14] | Nie P, Wu D, Sun DW, et al. Potential of visible and near infrared spectroscopy and pattern recognition for rapid quantification of notoginseng powder with adulterants[J]. Sensors, 2013, 13: 13820–13834. DOI:10.3390/s131013820 |
| [15] | Sun S, Chen J, Zhou Q, et al. Application of mid-infrared spectroscopy in the quality control of traditional Chinese medicines[J]. Planta Med, 2010, 76: 1987–1996. DOI:10.1055/s-0030-1250520 |
| [16] | Liu Y, Zhang GJ, Sun SQ, et al. Study on similar traditional Chinese medicines Cornu Cervi Pantotrichum, Cornu Cervi and Cornu Cervi Degelatinatum by FT-IR and 2D-IR correlation spectroscopy[J]. J Pharm Biomed Anal, 2010, 52: 631–635. DOI:10.1016/j.jpba.2010.01.045 |
| [17] | Du M, Gu Y, Lin ZZ, et al. Rapid identification of wolfberry fruit of different geographic regions with sample surface near infrared spectra combined with multi-class SVM[J]. Spectrosc Spect Anal (光谱学与光谱分析), 2013, 33: 1211–1214. |
| [18] | Zhao YL, Zhang J, Yuan TJ, et al. Study on rapid identifiction of medicinal plants of paris polyphylla from different origin areas by NIR spectroscopy[J]. Spectrosc Spect Anal (光谱学与光谱分析), 2014, 34: 1831–1835. |
| [19] | Li WL, Xing LH, Xie DS, et al. An authentication method of bear bile powder based on the near infrared spectroscopy[J]. Spectrosc Spect Anal (光谱学与光谱分析), 2011, 31: 673–676. |
| [20] | Liu SS, Wu ZS, Xing L, et al. Identification of bezoar and artificial bezoar powder using near infrared microspectroscopy[J]. China J Chin Mater Med (中国中药杂志), 2014, 39: 84–87. |
| [21] | Wang D, Jia Y, Ji SG. Identification of Dihuang steamed for different hours with near-infrared spectrum[J]. Chin J Spectrosc Lab (光谱实验室), 2010, 27: 1356–1360. |
| [22] | Wei HZ, Fang SM, Rao Y, et al. Rapid determination of moisture content in drying process of Paeoniae Radix Alba by NIRS[J]. Chin Tradit Herb Drugs (中草药), 2011, 42: 1994–1997. |
| [23] | Wu Z, D uM, Pan XN, et al. Rapid discriminant analysis of sulfur fumigated Puerariae Lobatae Radix based on vertical and horizontal surfaces[J]. China J Chin Mater Med (中国中药杂志), 2015, 40: 2336–2339. |
| [24] | Li WL, Wang YF, Qu HB. Near infrared spectroscopy as a tool for the rapid analysis of the Honeysuckle extracts[J]. Vib Spectrosc, 2012, 62: 159–164. DOI:10.1016/j.vibspec.2012.07.005 |
| [25] | Navarro EM, Rodenas SF, Li H, et al. Rapid determination of baicalin and total baicalein content in Scutellariae radix by ATR-IR and NIR spectroscopy[J]. Talanta, 2013, 114: 304–310. DOI:10.1016/j.talanta.2013.05.046 |
| [26] | Li B, Wang C, Xi L, et al. Qualitative and quantitative analysis of Angelica sinensis using near infrared spectroscopy and chemometrics[J]. Anal Methods, 2014, 6: 9691–9697. DOI:10.1039/C4AY01542H |
| [27] | Ying X, Pei Y, Liu M, et al. Discrimination and quantification analysis of Acoruscalamus L. and Acorustatarinowii Schott with near-infrared reflection spectroscopy[J]. Anal Methods, 2014, 6: 4212–4218. DOI:10.1039/c4ay00039k |
| [28] | Liu X, Tao L, Du W, et al. Quality control of Ginkgo biloba leaves by real time release testing in combination with near infrared spectroscopy[J]. J Near Infrared Spectrosc, 2015, 23: 381–389. DOI:10.1255/jnirs.1187 |
| [29] | Kasemsumran S, Apiwatanapiwat W, Suttiwijitpukdee N, et al. Evaluation of fourier transform-near infrared spectroscopic measurements for the quantification of curcumin in turmeric herbal medicines[J]. J. Near Infrared Spectrosc, 2014, 22: 113–120. DOI:10.1255/jnirs.1103 |
| [30] | Li Y, Liu B, Geng S, et al. An approach combining real-time release testing with near-infrared spectroscopy to improve quality control efficiency of Rhizoma paridis[J]. Spectrochim Acta A Mol Biomol Spectrosc, 2016, 157: 186–191. DOI:10.1016/j.saa.2016.01.001 |
| [31] | Shao QS, Zhang AL, Ye WW, et al. Fast determination of two atractylenolides in Rhizoma Atractylodis Macrocephalae by fourier transform near-infrared spectroscopy with partial least squares[J]. Spectrochim Acta A Mol Biomol Spectrosc, 2014, 120: 499–504. DOI:10.1016/j.saa.2013.10.035 |
| [32] | Meng Y, Wang S, Cai R, et al. Discrimination and content analysis of Fritillaria using near infrared spectroscopy[J]. J Anal Methods Chem, 2015, 2015: 752162. |
| [33] | Ding GY, Wang YS, Liu AN, et al. From chemical markers to quality markers:an integrated approach of UPLC/Q-TOF, NIRS and chemometrics for the quality assessment of honeysuckle buds[J]. RSC Adv, 2017, 7: 22034–22044. DOI:10.1039/C6RA28152D |
| [34] | Qi LW, Chen CY, Li P. Structural characterization and identification of iridoid glycosides, saponins, phenolic acids and flavonoids in Flos Lonicerae Japonicae by a fast liquid chromatography method with diode-array detection and time-of-flight mass spectrometry[J]. Rapid Commun Mass Spectrom, 2009, 23: 3227–3242. DOI:10.1002/rcm.v23:19 |
| [35] | Shi ZL, Liu ZJ, Liu CS, et al. Spectrum-effect relationships between chemical fingerprints and antibacterial effects of Lonicerae Japonicae Flos and Lonicerae Flos base on UPLC and microcalorimetry[J]. Front Pharmacol, 2016, 7: 12. |
| [36] | Jiang M, Han YQ, Zhou MG, et al. The screening research of anti-inflammatory bioactive markers from different flowering phases of Flos Lonicerae Japonicae[J]. PLoS One, 2014, 9: e96214. DOI:10.1371/journal.pone.0096214 |
| [37] | Bai G, Zhang TJ, Hou YY, et al. From quality markers to data mining and intelligence assessment:a smart quality-evaluation strategy for traditional Chinese medicine based on quality markers[J]. Phytomedicine, 2018, 44: 109–116. DOI:10.1016/j.phymed.2018.01.017 |
| [38] | Liu C, Guo D, Liu L. Quality transitivity and traceability system of herbal medicine products based on quality markers[J]. Phytomedicine, 2018, 44: 247–257. DOI:10.1016/j.phymed.2018.03.006 |
 2019, Vol. 54


