2. 河南省鸡种质资源创新与利用重点实验室, 郑州 450046
2. Henan Innovative Engineering Research Center of Poultry Germplasm Resource, Zhengzhou 450046, China
家鸡是人类驯化较早的家禽,不仅是人类优质蛋白质的主要来源,而且与人类文化生活也有着密切的联系,从古至今被用于祭祀、娱乐或观赏等[1-2]。中国作为可能的家鸡起源地之一,地理和文化多样性丰富且幅员辽阔[3-5],是世界上鸡遗传资源最丰富的国家之一[6]。2021年公布的《国家畜禽遗传资源品种名录》中地方鸡品种达到115个。中国地方鸡在经历几千年的自然和人工选择下已形成了纷繁、各具特色品种众多的群体,积累了相当丰富的遗传变异和表型多样性[7]。清楚地研究和理解种群之间和种群内部的多样性及种群结构对于有效管理遗传资源至关重要[8]。
此前,中国地方鸡遗传多样性与种群结构的研究主要使用微卫星标记[9-11],其在非洲[12]、孟加拉国[13]、印度尼西亚[14]等国的地方鸡及商业品种[15-16]的遗传多样性研究中被广泛使用,研究结果对地方品种的保护以及揭示品种起源、育种历史提供了参考。但微卫星标记对于新物种开发微卫星位点时随机性大,利用其检测多态性耗时耗力,因此具有一定的局限性[17]。近年来,NGS测序及基因分型芯片的快速发展极大的推进了更加精细、快速、且低成本的全基因组SNP标记分析。Zhang等[18]利用全基因组SNP标记分析了中国地方鸡的种群多样性及斗鸡的选择特征;Cendron等[19]利用SNP标记对意大利地方鸡品种多样性以及种群结构进行了详细的分析,在其他物种如羊[20]、牛[21]、猪[22]、马[23]等的研究中基于全基因SNP标记对其遗传多样性、种群结构以及育种起源历史进行了比较系统的研究。因此,本研究使用全基因组SNP标记,分析中国地方鸡品种的遗传多样性、群体结构、亲缘关系、ROH,为设计和实施遗传资源保护策略提供参考。
1 材料与方法 1.1 样本来源本研究选取Synergistic Plant and Animal(SYNBREED, www.synbreed.tum.de)项目部分数据。SYNBREED项目从全球范围鸡群体中广泛收集了脱氧核糖核酸(DNA) 样本,本研究从中选取了18只白耳黄鸡(Baier)、19只茶花鸡(Chahua)、20只河南斗鸡(Fighting)、20只固始鸡(Gushi)、20只狼山鸡(Langshan)、20只皖南三黄鸡(WanTy)、20只泰和乌骨鸡(Wugu)以及20只萧山鸡(Xiaoshan)等8个中国地方鸡品种,共157只地方鸡个体及80只白壳蛋鸡系(WL)、73只褐色蛋鸡系(BL)和80只肉鸡系(BR)共233只商品鸡个体构建新的数据集。
1.2 基因分型使用AffymetrixⓇ AxiomTM 600 K全基因组鸡基因分型芯片对DNA样本进行基因分型,基因分型在慕尼黑工业大学(Prof. R. Fries) 进行,AffymetrixⓇ AxiomTM 600 K全基因组鸡基因分型芯片包含超过580K个SNPs[24]。使用参考基因组Gallus_gallus-5.0[25]注释了579 621个SNPs。
1.3 数据过滤首先删除了重复、注释不明确及性染色体的27 427个SNPs,之后使用PLINK 1.9[26]进行过滤:1) ≥95% 的个体检出率;2) ≥99%的SNP检出率,共保留443 352个SNPs的数据进行后续分析。最后使用PLINK基于连锁不平衡进行过滤,窗口大小、步长及r2的参数分别为“50、5、0.2”,通过过滤的157 968个SNPs用于种群结构的分析。
1.4 数据分析1.4.1 遗传多样性指数 使用PLINK估计观测杂合度(observed heterozygosity, Ho)和期望杂合度(expected heterozygosity, He)、次等位基因频率(minor allele frequency, MAF)以及基于观测和期望纯合基因型数量之间的差异估计的基因组近交系数(FHOM)。每个品种中个体的He和Ho估计值是所有SNPs的平均值。使用VCFtools[27]进行种群核苷酸多样性计算,以上多种指数可以反映种群的遗传多样性。
1.4.2 群体结构、亲缘关系及ROH 使用PLINK基于Bayesian model用于主成分分析(principal component analysis, PCA)、地方鸡和商品鸡组合数据集多维尺度缩放(MDS)分析及构建遗传距离矩阵和全基因组的状态同源(identity by State, IBS)距离矩阵,使用MEGAX (https://www.megasoftware.net/) 邻接法构建系统发育树(phylogenetic tree),参数设置为引导复制1 000次,通过iTol(https://itol.embl.de/)注释可视化。使用ADMIXTURE 1.3[28]分析种群的相关性,设置了K=2~10的数据集。R语言Hierfstat包用于计算所有品种成对群体分化指数(Fst),估计种群间遗传分化,根据Fst值将遗传分化分为4个水平:低(< 0.05)、中(0.05~0.15)、高(0.15~0.25)和极高(>0.25)[29]。使用PLINK检测长纯合片段(runs of Homogeneity,ROH),基因组近交系数(FROH)等于基因组中ROH片段的总长度占常基因组总长度(944 270 kb)的比例,每个ROH根据其物理长度分类如下:1~2、2~4、4~8、8~16和≥16 Mb[30-32]。
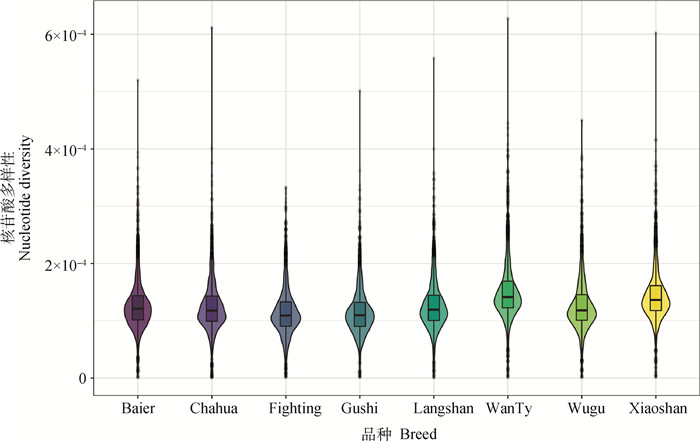
2 结果 2.1 种群内遗传多样性遗传多样性指标如表 1所示,皖南三黄鸡的期望杂合度(He, 0.314)、观测杂合度(Ho, 0.321)及次等位基因频率(MAF, 0.236)最高,斗鸡的最低(He, 0.239;Ho, 0.260;MAF, 0.175),所有品种的Ho均高于He,表明各品种遗传多样性均较为丰富;斗鸡的平均FHOM最高(0.205),其次是固始鸡(0.184)与乌骨鸡(0.180),狼山鸡(0.018)与皖南三黄鸡(0.017)的FHOM最低。核苷酸多样性结果见图 1,其变化趋势与MAF值基本一致,皖南三黄鸡具有最高的核苷酸多样性,斗鸡最低。
|
|
表 1 家鸡品种遗传多样性指数 Table 1 Genetic diversity parameters of chickens from different breeds |

|
图 1 不同鸡种的核苷酸多样性 Fig. 1 Nucleotide diversity of different-breeds chickens |
2.2.1 群体结构 本研究利用邻接法构建了种群之间的系统发育树,并对样本和品种进行注释(图 2A),不同品种分布在不同的分支上,充分展示了品种间的集群和关系。皖南三黄鸡的分支最短,而茶花鸡的分支最长,其中有一只离群的乌骨鸡出现在了萧山鸡的分支旁。

|
图 2 家鸡群体系统发育树(A)、PCA(B)及MDS(C)分析图 Fig. 2 The phylogenetic tree of chicken population (A), PCA (B) and MDS(C) analysis diagram |
主成分分析(PCA)显示前两个主成分的贡献率:PC1(18.59%)和PC2(15.27%)。来自8个品种的个体清楚地分为5个亚群(图 2B),其中茶花鸡、固始鸡、斗鸡以及狼山鸡为独立的种群。在PC1上斗鸡、固始及狼山鸡距离较近,与进化树分析结果基本一致。进一步利用组合数据集进行MDS分析(图 2C),虽然地方鸡种整体相对与商业肉鸡品种(BR)更加接近,但也呈现出不同的分层,在地方品种中,茶花鸡和萧山鸡更接近商业肉鸡品种。
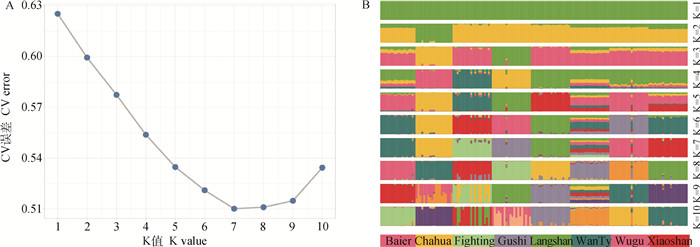
通过Admixture分析(图 3)计算了从2到10个潜在集群(K)的范围,由图 3A可知,总样本中存在的最佳拟合种群数量是K=7。K=2(图 3B)时,茶花鸡首先分离出来;K=3时,斗鸡与固始鸡分离出来;K=4时,狼山鸡分离,K=5时白耳黄鸡与乌骨鸡分离出来;K=6时萧山鸡分离出来。有趣的是在最小误差K=7时皖南三黄鸡血统也是其他几种品种之间的混合,直到K=8时,皖南三黄鸡才分离出来。事实上,当K=8时也更符合现实的分群,其误差也仅次于K=7(图 3A),表明皖南三黄鸡的血统比较杂合,这与其上述遗传多样性研究结果相一致。

|
图 3 K值最佳路线图(A) 和群体结构图(B) Fig. 3 The optimal K value (A) and the population structure (B) diagrams |
2.2.2 亲缘关系 所有品种对之间的遗传分化程度见图 4A,这些结果与PCA分析结果一致。Fst值范围从0.09(皖南三黄鸡和狼山鸡)到0.22(茶花鸡和狼山鸡),皖南三黄鸡与其他品种的Fst值最低在0.09~0.14之间,茶花鸡的最高在0.14~0.22之间。

|
图 4 所有品种成对基因频率分化指数Fst (A),IBS距离矩阵可视化热图(B) Fig. 4 Pairwise Fst (A) and IBS distance matrix (B) between different breeds |
品种之间和品种内部个体的IBS遗传距离见图 4B,群体的IBS遗传距离在0.092 9~0.319 9之间,平均为0.277 4。品种间的IBS遗传距离较远,但也存在一定程度的亲缘关系(图 4B中颜色较浅的方格);其中茶花鸡与其他品种之间遗传距离较远,这与PCA结果一致。部分斗鸡个体间的IBS遗传距离较近(图 4B中颜色较浅的方格),皖南三黄鸡个体之间遗传距离都较远。
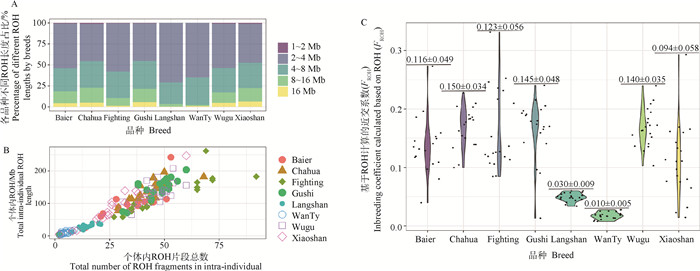
2.3 ROH分析ROH分析共得到524 2个ROH片段,长度分布在1~41.51 Mb之间。ROH的长度和数量被认为与物种的近交程度呈正相关,其中长的ROH片段被认为是近世代近交繁殖的结果,而较短的ROH可能表明更远的祖先效应[33-34]。如图 5A表示,狼山鸡1~2 Mb长度的ROH占比70.95%,未检测到大于16 Mb长度的ROH;其次在皖南三黄鸡1~2 Mb长度的ROH占群体的64.84%,同样未检测到大于16 Mb的ROH;茶花鸡8~16 Mb与大于16 Mb的ROH分别占比5.14%、0.96%。基于每个个体内ROH总数量与长度的分布(图 5B)可以清楚地看到,皖南三黄鸡和狼山鸡中ROH的数量和长度均低于其他品种。目前,基于ROH的近交系数估(FROH) 被认为是检测近亲繁殖的最有效方法之一[35],茶花鸡品种的近交平均值最高(图 5C最上方数字),其次是固始鸡和斗鸡。皖南三黄鸡的近交平均值最低,其次为狼山鸡,个体中FROH最高极值出现在斗鸡群体中(FROH=0.277)。

|
图 5 各个品种中不同长度ROH统计(A), 各个品种个体ROH数量与总长度(B)及各个品种FROH (C) Fig. 5 Descriptive statistics of ROH with different lengths in each breed (A), the number and total length of individual ROH (B) and FROH (C) of each breed |
在现代化的动物遗传育种进程中,优良畜禽品种经历了短期高强度的人工选择,其在改善畜禽生产性能的同时不可避免造成群体的近交[36]。近交会造成近交衰退及群体遗传多样性降低等危害,因此评估畜牧群体遗传多样性[23],了解品种间的关系和种群结构对于保证农牧业生产可持续发展具有重要意义[19]。本研究基于高密度全基因组SNP芯片使用多种方法估计了遗传多样性指数和基因组近交系数,以此评估品种内的遗传多样性水平。所研究的地方品种群体平均观测杂合度均高于平均期望杂合度,表明地方鸡遗传多样性较高,这与先前报道一致[18]。FHOM分析结果表明,家鸡品种中皖南三黄鸡和狼山鸡近交程度较低,斗鸡与茶花鸡近交程度较高。同时观察到皖南三黄鸡和狼山鸡品种的遗传多样性最为丰富,皖南三黄鸡目前并未处于国家级保护计划之中,这应与其原产地有关[37]。处于保护计划之中的狼山鸡遗传多样性高于其他3个保护品种,这也与Zhang等[38]的研究结果一致。
基于PCA、进化树及Admixture对种群结构分析结果表明,每个品种的个体聚集在一起并表现出一致的遗传背景,在地方鸡与商品鸡进行MDS分析的结果中,商业品种与中国地方品种明显区分开来,但整体上地方鸡与商业肉鸡品种相对更加接近,这也符合肉鸡系的育种历史[39],表明了地方品种的肉用育种潜力。使用群体分化指数Fst和IBS遗传距离评估种群间与种群内的亲缘关系,结果表明,不同方法评估8个品种之间的相对关系也相一致,其中斗鸡部分个体间的IBS遗传距离较近,说明其存在较高的亲缘关系以及较大的近交风险,可能需要改进选配措施,而皖南三黄鸡个体之间遗传距离都较远,这与多样性研究结果一致。
ROH分析有利于实施品种保护计划[23],全基因组SNP特别适合检测杂合性降低的基因组区域[40],由此计算而来的FROH被认为是检测近亲繁殖的最有效方法之一,其准确性已在牛[41]、猪[42]和山羊[43]中得到证实。ROH的长度和数量与群体历史信息的多个方面有关[18, 44-45]。近交水平越高,基因组中ROH的数量和长度越大,因此根据结果,茶花鸡、固始鸡以及斗鸡可能经历过较高强度近交繁殖。
4 结论本研究表明,地方鸡遗传资源多样性整体较为丰富。斗鸡和茶花鸡品种的遗传多样性低于其他品种,狼山鸡与皖南三黄鸡的遗传多样性更加丰富,基因组近交系数和ROH分析表明茶花鸡、固始鸡以及斗鸡近交程度相对过高,不同品种间出现了中高等群体分化且整体与商业肉鸡品种更为接近。了解品种间分化程度与亲缘关系是支持保护计划工作的重要因素,帮助制定有针对性的交配计划,以保护最濒危的品种以及支持育种、遗传资源开发与利用工作。
| [1] |
GUO Y, OU J H, ZAN Y J, et al. Researching on the fine structure and admixture of the worldwide chicken population reveal connections between populations and important events in breeding history[J]. Evol Appl, 2022, 15(4): 553-564. DOI:10.1111/eva.13241 |
| [2] |
MIAO Y W, PENG M S, WU G S, et al. Chicken domestication: an updated perspective based on mitochondrial genomes[J]. Heredity (Edinb), 2013, 110(3): 277-282. DOI:10.1038/hdy.2012.83 |
| [3] |
XIONG X, ZHANG L X, HAO Y, et al. How urbanization and ecological conditions affect urban diet-linked GHG emissions: new evidence from China[J]. Resour Conserv Recycl, 2022, 176: 105903. DOI:10.1016/j.resconrec.2021.105903 |
| [4] |
WANG M S, THAKUR M, PENG M S, et al. 863 genomes reveal the origin and domestication of chicken[J]. Cell Res, 2020, 30(8): 693-701. DOI:10.1038/s41422-020-0349-y |
| [5] |
ABDULWAHID A M, ZHAO J B. China as a center of origin and domestication of chicken: a review[J]. Agric Rev, 2022, 43(2): 170-177. |
| [6] |
LUO W, LUO C L, WANG M, et al. Genome diversity of Chinese indigenous chicken and the selective signatures in Chinese gamecock chicken[J]. Sci Rep, 2020, 10(1): 14532. DOI:10.1038/s41598-020-71421-z |
| [7] |
NIE C S, ALMEIDA P, JIA Y X, et al. Genome-wide single-nucleotide polymorphism data unveil admixture of Chinese indigenous chicken breeds with commercial breeds[J]. Genome Biol Evol, 2019, 11(7): 1847-1856. DOI:10.1093/gbe/evz128 |
| [8] |
TIXIER-BOICHARD M, LEENSTRA F, FLOCK D K, et al. A century of poultry genetics[J]. Worlds Poult Sci J, 2012, 68(2): 307-321. DOI:10.1017/S0043933912000360 |
| [9] |
YANG X, LIU C L, YANG B G, et al. Investigating genetic diversity and population phylogeny of five Chongqing local chicken populations autosomal using microsatellites[J]. Anim Biotechnol, 2021, 33(6): 1190-1197. |
| [10] |
AZIMU W, MANATBAY B, LI Y, et al. Genetic diversity and population structure analysis of eight local chicken breeds of Southern Xinjiang[J]. Br Poult Sci, 2018, 59(6): 629-635. DOI:10.1080/00071668.2018.1523537 |
| [11] |
CHEN G H, BAO W B, SHU J T, et al. Assessment of population structure and genetic diversity of 15 Chinese indigenous chicken breeds using microsatellite markers[J]. Asian-Australas J Anim Sci, 2008, 21(3): 331-339. DOI:10.5713/ajas.2008.70125 |
| [12] |
HABIMANA R, OKENO T O, NGENO K, et al. Genetic diversity and population structure of indigenous chicken in Rwanda using microsatellite markers[J]. PLoS One, 2020, 15(4): e0225084. DOI:10.1371/journal.pone.0225084 |
| [13] |
RASHID M A, MANJULA P, FARUQUE S, et al. Genetic diversity and population structure of indigenous chicken of Bangladesh using microsatellite markers[J]. Asian-Australas J Anim Sci, 2020, 33(11): 1732-1740. DOI:10.5713/ajas.20.0189 |
| [14] |
ROH H J, KIM S C, CHO C Y, et al. Estimating genetic diversity and population structure of 22 chicken breeds in Asia using microsatellite markers[J]. Asian-Australas J Anim Sci, 2020, 33(12): 1896-1904. DOI:10.5713/ajas.19.0958 |
| [15] |
SABRY A, RAMADAN S, HASSAN M M, et al. Assessment of genetic diversity among Egyptian and Saudi chicken ecotypes and local Egyptian chicken breeds using microsatellite markers[J]. J Environ Biol, 2021, 42: 33-39. DOI:10.22438/jeb/42/1/MRN-1572 |
| [16] |
TADANO R, NISHIBORI M, NAGASAKA N, et al. Assessing genetic diversity and population structure for commercial chicken lines based on forty microsatellite analyses[J]. Poult Sci, 2007, 86(11): 2301-2308. DOI:10.3382/ps.2007-00233 |
| [17] |
任芳. 怒江缺须盆唇鱼种群遗传结构及遗传多样性分析[D]. 贵阳: 贵州大学, 2021. REN F. Population genetic diversity and genetic structure analysis of the placocheilus cryptonemus in the Nujiang River[D]. Guiyang: Guizhou University, 2021. (in Chinese) |
| [18] |
ZHANG J X, NIE C S, LI X H, et al. Genome-wide population genetic analysis of commercial, indigenous, game, and wild chickens using 600K SNP microarray data[J]. Front Genet, 2020, 11: 543294. DOI:10.3389/fgene.2020.543294 |
| [19] |
CENDRON F, PERINI F, MASTRANGELO S, et al. Genome-wide SNP analysis reveals the population structure and the conservation status of 23 Italian chicken breeds[J]. Animals, 2020, 10(8): 1441. DOI:10.3390/ani10081441 |
| [20] |
MEYERMANS R, GORSSEN W, WIJNROCX K, et al. Unraveling the genetic diversity of Belgian Milk Sheep using medium‐density SNP genotypes[J]. Anim Genet, 2020, 51(2): 258-265. DOI:10.1111/age.12891 |
| [21] |
TRUJANO-CHAVEZ M Z, RUÍZ-FLORES A, LÓPEZ-ORDAZ R, et al. Genetic diversity in reproductive traits of Braunvieh cattle determined with SNP markers[J]. Vet Med Sci, 2022, 8(4): 1709-1720. DOI:10.1002/vms3.836 |
| [22] |
ZORC M, ŠKORPUT D, GVOZDANOVIĆ K, et al. Genetic diversity and population structure of six autochthonous pig breeds from Croatia, Serbia, and Slovenia[J]. Genet Sel Evol, 2022, 54(1): 30. DOI:10.1186/s12711-022-00718-6 |
| [23] |
ABLONDI M, DADOUSIS C, VASINI M, et al. Genetic diversity and signatures of selection in a native Italian horse breed based on SNP data[J]. Animals, 2020, 10(6): 1005. DOI:10.3390/ani10061005 |
| [24] |
KRANIS A, GHEYAS A A, BOSCHIERO C, et al. Development of a high density 600K SNP genotyping array for chicken[J]. BMC Genomics, 2013, 14: 59. DOI:10.1186/1471-2164-14-59 |
| [25] |
WARREN W C, HILLIER L W, TOMLINSON C, et al. A new chicken genome assembly provides insight into avian genome structure[J]. G3 (Bethesda), 2017, 7(1): 109-117. DOI:10.1534/g3.116.035923 |
| [26] |
CHANG C C, CHOW C C, TELLIER L C A M, et al. Second-generation PLINK: rising to the challenge of larger and richer datasets[J]. GigaScience, 2015, 4(1): 7. DOI:10.1186/s13742-015-0047-8 |
| [27] |
DANECEK P, AUTON A, ABECASIS G, et al. The variant call format and VCFtools[J]. Bioinformatics, 2011, 27(15): 2156-2158. DOI:10.1093/bioinformatics/btr330 |
| [28] |
ALEXANDER D H, NOVEMBRE J, LANGE K. Fast model-based estimation of ancestry in unrelated individuals[J]. Genome Res, 2009, 19(9): 1655-1664. DOI:10.1101/gr.094052.109 |
| [29] |
HARTL D L, KALVEMARK A S, KHOO S, et al. Assess educ[M]. Sunderland, MA: Sinauer Associates, 1980.
|
| [30] |
CENDRON F, MASTRANGELO S, TOLONE M, et al. Genome-wide analysis reveals the patterns of genetic diversity and population structure of 8 Italian local chicken breeds[J]. Poult Sci, 2021, 100(2): 441-451. DOI:10.1016/j.psj.2020.10.023 |
| [31] |
GORSSEN W, MEYERMANS R, BUYS N, et al. SNP genotypes reveal breed substructure, selection signatures and highly inbred regions in Piétrain pigs[J]. Anim Genet, 2020, 51(1): 32-42. DOI:10.1111/age.12888 |
| [32] |
FERENČAKOVIĆ M, HAMZIĆ E, GREDLER B, et al. Estimates of autozygosity derived from runs of homozygosity: empirical evidence from selected cattle populations[J]. J Anim Breed Genet, 2013, 130(4): 286-293. DOI:10.1111/jbg.12012 |
| [33] |
CAVILL E L, GOPALAKRISHNAN S, PUETZ L C, et al. Conservation genomics of the endangered Seychelles Magpie‐Robin (Copsychus sechellarum): a unique insight into the history of a precious endemic bird[J]. Ibis, 2022, 164(2): 396-410. DOI:10.1111/ibi.13023 |
| [34] |
SHI L Y, WANG L G, LIU J X, et al. Estimation of inbreeding and identification of regions under heavy selection based on runs of homozygosity in a Large White pig population[J]. J Anim Sci Biotechnol, 2020, 11: 46. DOI:10.1186/s40104-020-00447-0 |
| [35] |
BERTOLINI F, CARDOSO T F, MARRAS G, et al. Genome-wide patterns of homozygosity provide clues about the population history and adaptation of goats[J]. Genet Sel Evol, 2018, 50(1): 59. DOI:10.1186/s12711-018-0424-8 |
| [36] |
GUTIÉRREZ-REINOSO M A, APONTE P M, GARCÍA-HERREROS M. A review of inbreeding depression in dairy cattle: current status, emerging control strategies, and future prospects[J]. J Dairy Res, 2022, 89(1): 3-12. DOI:10.1017/S0022029922000188 |
| [37] |
武艳平, 魏岳, 康昭风, 等. 基于全基因组SNP分析8个地方鸡品种的遗传多样性[J]. 畜牧兽医学报, 2022, 53(2): 646-653. WU Y P, WEI Y, KANG Z F, et al. Genetic diversity analysis of 8 local chicken breeds based on whole genome SNP[J]. Acta Veterinaria et Zootechnica Sinica, 2022, 53(2): 646-653. (in Chinese) |
| [38] |
ZHANG M M, HAN W, TANG H, et al. Genomic diversity dynamics in conserved chicken populations are revealed by genome-wide SNPs[J]. BMC Genomics, 2018, 19(1): 598. DOI:10.1186/s12864-018-4973-6 |
| [39] |
YANG N, JIANG R S. Recent advances in breeding for quality chickens[J]. Worlds Poult Sci J, 2005, 61(3): 373-381. DOI:10.1079/WPS200563 |
| [40] |
BORTOLUZZI C, CROOIJMANS R P M A, BOSSE M, et al. The effects of recent changes in breeding preferences on maintaining traditional Dutch chicken genomic diversity[J]. Heredity (Edinb), 2018, 121(6): 564-578. DOI:10.1038/s41437-018-0072-3 |
| [41] |
KIM E S, COLE J B, HUSON H, et al. Effect of artificial selection on runs of homozygosity in U. S. Holstein cattle[J]. PLoS One, 2023, 8(11): e80813. |
| [42] |
BOSSE M, MEGENS H J, MADSEN O, et al. Using genome-wide measures of coancestry to maintain diversity and fitness in endangered and domestic pig populations[J]. Genome Res, 2015, 25(7): 970-981. DOI:10.1101/gr.187039.114 |
| [43] |
ONZIMA R B, UPADHYAY M R, DOEKES H P, et al. Genome-wide characterization of selection signatures and runs of homozygosity in Ugandan goat breeds[J]. Front Genet, 2018, 9: 318. DOI:10.3389/fgene.2018.00318 |
| [44] |
FLEMING D S, KOLTES J E, MARKEY A D, et al. Genomic analysis of Ugandan and Rwandan chicken ecotypes using a 600 k genotyping array[J]. BMC Genomics, 2016, 17: 407. DOI:10.1186/s12864-016-2711-5 |
| [45] |
STRILLACCI M G, VEGA-MURILLO V E, ROMÁN-PONCE S I, et al. Looking at genetic structure and selection signatures of the Mexican chicken population using single nucleotide polymorphism markers[J]. Poult Sci, 2018, 97(3): 791-802. DOI:10.3382/ps/pex374 |
(编辑 郭云雁)


