梅花鹿(Cervus nippon)和马鹿(Cervus elaphus)为偶蹄目、鹿科、鹿属的两个种,但可以杂交产生可育后代,且杂交后代可继承梅花鹿和马鹿二者的优良性状。近十余年,我国养鹿业为追求杂交带来的利益,用梅花鹿和马鹿进行杂交或级进杂交,消耗了大量纯种梅花鹿母鹿,而且纯种梅花鹿后代的数量也急剧减少,给梅花鹿的纯种繁育带来了巨大危机[1]。用纯种梅花鹿级进杂交的后代其体型外貌与纯种梅花鹿极为相似,肉眼难以区分,使得杂交后代与纯种梅花鹿相互掺杂,更是给梅花鹿的纯种繁育设置了障碍。
单核苷酸多态性(single nucleotide polymorphism,SNP)是基于单核苷酸的突变,在基因组中数量多、分布广,且具有相对较高的遗传稳定性,在动物遗传育种及遗传多样性评估中有着重要作用[2-4]。梅花鹿和马鹿作为两个物种,其基因组中一定包含着两种之间相互区别的遗传信息,只在马鹿中存在的遗传信息会伴随杂交传递给梅花鹿和马鹿的杂交子代,使之在分子水平上区别于纯种梅花鹿。因而本研究选择用SNP作为分子标记对梅花鹿、马鹿及其杂交后代F1和F2代个体进行鉴别。基因分型测序(genotyping by sequencing,GBS)技术则给大量高质量SNP的获取[5]提供了便利。
GBS技术是一种基于限制性内切酶靶向基因组片段的高通量、二代测序的基因分型测序方法,适用于不同种生物的种群研究、种质鉴定、性状定位和辅助育种[6-8],可揭示致病疫霉的遗传变异和发现渗入的相关差异片段[9-10]等,有助于分子标记辅助基因组学的研究以及现有遗传资源的评估,从而有效利用大量物种[11]。作为一种高通量测序技术,GBS技术可以帮助扩展种群间基因组变异的检测[12],主要被用于作物品种[13-15],仅有少数研究在动物群体[16-17]中使用了GBS技术。相比于重测序,GBS以部分基因组信息代表全基因组信息,操作简便,降低了测序成本,同时又可以获得大量的SNP信息[18-19]。
本研究选用GBS技术对梅花鹿、马鹿及其杂交后代(F1和F2)4个群体(由于采样原因,另有一个未知类别个体)共226个样本进行测序,结合实验室前期110只梅花鹿、197只马鹿和1只F1代杂交鹿的测序数据,比对分析不同样本群体的遗传变异信息,挖掘其SNP标记,以期为梅花鹿、马鹿及其杂交后代(F1和F2)的鉴别提供可靠依据。
1 材料与方法 1.1 试验材料梅花鹿、马鹿、F1代、F2代及未知个体共226只鹿的抗凝血样品(表 1)。
|
|
表 1 血液样品信息 Table 1 Information of blood samples |
血液基因组DNA提取试剂盒(DP348-03)购自天根生化科技(北京)有限公司;异丙醇、无水乙醇、琼脂糖、50×TAE、6×Loading Buffer、DNA Marker(DL15000)等购自上海生工生物工程技术服务有限公司。
主要仪器有离心机(Sigma)、电子天平(Mettler Toledo)、电泳仪(Bio-Rad)、凝胶成像系统(Bio-Rad)。
1.3 血液基因组DNA的提取使用血液基因组DNA提取试剂盒(DP348-03)对血液样品的基因组DNA进行提取,操作步骤按照试剂盒说明书进行。
1.4 血液基因组DNA质量检测DNA 3.5 μL(2 μL DNA样品,1.5 μL 6×Loading Buffer,混匀)上样于1%琼脂糖凝胶,120 V电泳18 min,然后将凝胶取出,放入凝胶成像系统观察结果。
1.5 GBS文库的构建及测序检测合格的DNA样品通过Covaris超声波破碎仪随机打断,经末端修复、加A尾、加测序接头、纯化、PCR扩增等步骤完成整个文库制备,构建好的文库通过Illumina(测序仪)进行测序(北京诺禾致源生物信息科技有限公司)。
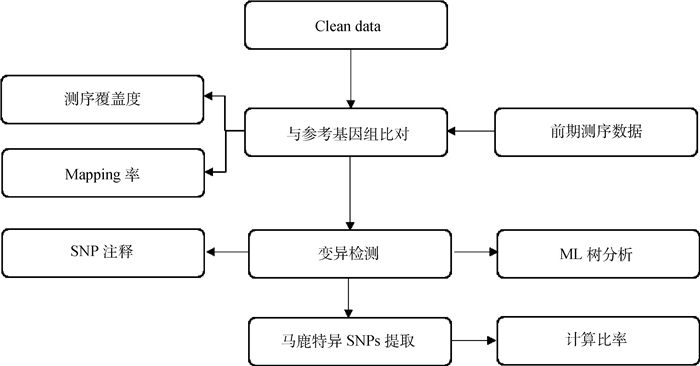
1.6 测序数据的生物信息学分析利用Illumina HiSeq/MiSeq测序平台,对226个样本进行双末端低深度测序,随后对原始下机数据进行预处理,去除接头序列和低质量reads后得到Clean data,然后以组装到染色体水平的梅花鹿全基因组序列(数据未公布)为参考,对所有数据(为扩大样本量以提高分析准确性,结合本实验室前期110只梅花鹿、197只马鹿、1只F1代杂交鹿的测序数据,具体见表 2)进行比对分析。首先,用bwa men命令将双端reads比对到参考基因组,参数采用默认。分别使用samtools (v1.3.1)和GATK3两个软件进行变异检测,并取二者一致的结果进入后续分析。然后用ANNOVAR软件对得到的SNP和InDel进行注释。利用SNPhylo软件进行基于大数据量SNP数据集的样品间进化关系推断,构建分子进化树。所有的统计及个性化分析均使用R(v3.4.2)完成。具体分析流程见图 1。
|
|
表 2 测序数据 Table 2 Sequencing data |

|
图 1 测序数据分析流程图 Fig. 1 Flow chart of sequencing data analysis |
图 2为血液基因组DNA提取部分结果。经琼脂糖凝胶电泳检测,大部分DNA样品的质量可以满足测序要求,个别样品DNA电泳条带出现严重拖尾、条带过暗或无条带现象。不合格的样品重新进行基因组DNA的提取并进行质量检测,直至达到测序要求。

|
1~11. 11个不同样品基因组DNA的电泳条带1-11. Electrophoretic bands of genomic DNA from 11 different samples 图 2 血液基因组DNA琼脂糖凝胶电泳结果 Fig. 2 Result for agarose gel electrophoresis of blood genomic DNA |
226个个体的样品测序共产生Clean data 322.683 Gb,平均每个样品1 427.802 Mb。以梅花鹿全基因组为参考序列,将每个样本测序得到的clean reads回帖(mapping)到基因组,并统计每个样品的比对率(mapping rate)、覆盖度(coverage)和测序深度(depth),结果见表 3。
|
|
表 3 测序质量 Table 3 Sequencing quality |
将所有样品作为一个群体与参考基因组比对,共检测出SNP位点23 943 582个, 平均SNP密度达9 742.67个·Mb-1。对所有得到的SNP位点在染色体上的分布情况进行统计,结果显示,每条染色体上的SNP数目与染色体长度基本成正比,且随机均匀的分布在每条染色体上,见图 3。

|
图 3 SNPs在染色体上的分布 Fig. 3 Distribution of SNPs on chromosomes |
对得到的所有SNPs进行注释,并根据注释结果对每条染色体上的变异类型进行统计分析,发现外显子、内含子以及基因间三者的变异数目基本呈正比(图 4),其中基因间的变异最多,占总变异数的67.79%,内含子次之,占总变异数的31.18%,外显子的变异最少,仅占总变异数的1.03%。

|
图 4 变异类型在染色体上的分布 Fig. 4 Distribution of variant types on chromosomes |
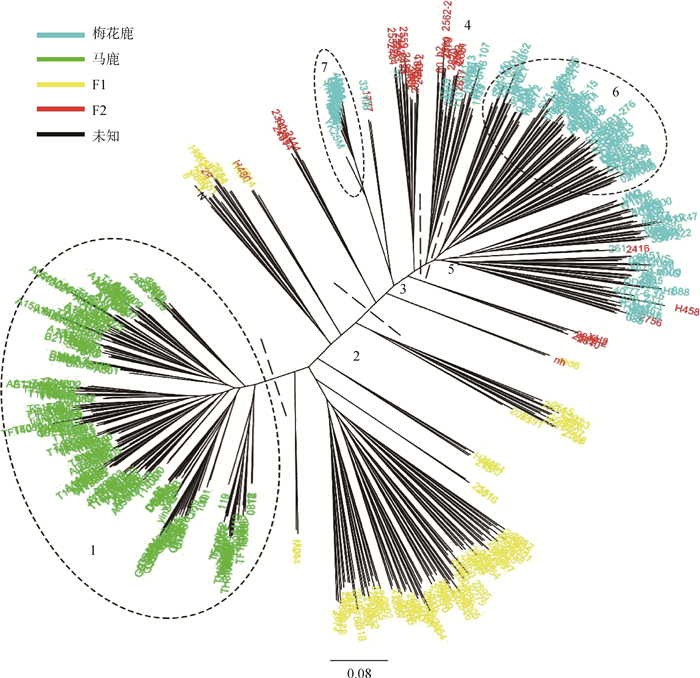
按照条件monomorphic: TRUE, MAF≥ 0.1, missing rate≤ 0.1对所有SNP位点进行质控过滤,最后得到高质量SNP位点31 630个。对这31 630个SNPs位点使用最大似然法(maximum likelihood,ML)构建分子进化树(图 5),结果显示, 梅花鹿、马鹿、F1及F2代分别聚到不同的支,区分明显。

|
分子进化树分支末端不同颜色的字符为不同样品的编号。1~7为根据分子进化树中聚类位置划分的7个群体:1号群体全部为马鹿;2号群体主要为F1代杂交鹿,包含未知个体“N”和2个F2代杂交鹿;3号群体主要为F2代杂交鹿;4号群体为梅花鹿与F2代杂交鹿相互掺杂;5号群体主要为梅花鹿,包含3个F2代杂交鹿;6号群体全部为梅花鹿;7号群体为日本梅花鹿 Characters of different colors at the end of branchs of molecular evolutionary tree are the numbers of different samples. 1-7 are 7 groups classified according to the clustering position in the molecular evolutionary tree: Group1 is all red deer; Group2 is F1 hybrid deer, including the unknown individual "N" and 2 F2 hybrid deer; Group3 is mainly F2 hybrid deer; Group4 shows that sika deer are mixed with F2 hybrid deer; Group5 is mainly sika deer, including 3 F2 hybrid deer; Group6 is all sika deer; Group7 is Japanese sika deer 图 5 534个样本的分子进化树 Fig. 5 Molecular evolutionary tree of 534 samples |
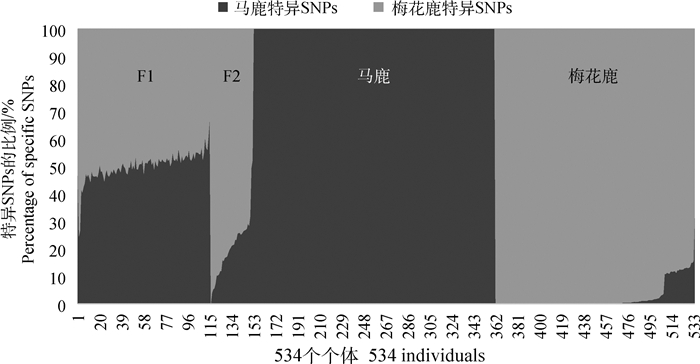
从图 5中可以看出,马鹿单独聚为一支,梅花鹿中有部分样本区分于F2代个体聚成一支。对1号和6号两个群体的SNPs进行对比,最后筛选出1号群体有而6号群体没有的特异SNP位点474个,6号群体有而1号群体没有的特异SNP位点558个,分别作为马鹿、梅花鹿的特异SNPs。对每个个体包含梅花鹿、马鹿特异SNPs的比例分别进行了计算(图 6),其中F1代个体含马鹿特异SNPs的比例主要在40%~60%之间,F2代个体马鹿特异SNPs的比例主要在10%~30%之间,梅花鹿中55.49%的个体不含马鹿特异SNPs,17.34%的个体含马鹿特异SNPs低于1%,13.29%的个体含马鹿特异SNPs在1%~10%之间,其余个体含马鹿特异SNPs的比例为10%~20%(其中有一个个体含马鹿特异SNPs的比例为33.3%)。另外,马鹿个体中不含梅花鹿的特异SNPs。

|
图 6 每个样本含有特异SNPs的比例 Fig. 6 Proportion of specific SNPs in each sample |
将个体中含有马鹿特异SNPs的比例从0~100%,间隔10%分为10个区间,分别对马鹿、梅花鹿、F1、F2以及未知个体区间内的个体数进行统计(表 4),可见马鹿、梅花鹿、F1、F2代个体含马鹿特异SNPs的比例差异明显。
|
|
表 4 马鹿特异SNPs比例统计 Table 4 Statistics of the proportion of specific SNPs for red deer |
目前有关杂交鹿鉴别的研究报道并不多。线粒体DNA作为分子水平上研究物种遗传结构的重要遗传标记[20],在杂交鹿茸的鉴定中已有应用[21],但仅能鉴定F1代杂交鹿茸。SNP作为重要的分子标记之一,可对动物个体基因组品种构成进行分析,以预测纯种或杂种动物[22],Ba等[23]首次报道了2 015个推测的诊断SNP标记,可用做梅花鹿与马鹿杂交程度评估和检测的工具,但是其研究的试验群体较小,没有进行大群验证。本研究以大量鹿的SNPs数据为基础,在全基因组范围寻找亲本、F1、F2代之间的SNPs差异,给F2代杂交鹿的鉴别提供了新的参考。
对226个个体的样品进行GBS测序,平均每个样品的有效数据量为1 427.802 Mb,较张彩云等[19]对291只新杨绿壳纯系蛋鸡的测序数据量(平均每个样品的有效数据量为918.910 Mb)高出55.38%,可见GBS技术适用于对鹿血液基因组DNA的测序。另外,GBS测序数据的覆盖度和测序深度比重测序数据要低得多,这是因为GBS仅对基因组的部分片段进行测序,而重测序是对全基因组序列进行测序[24-26]。SNPs在基因间分布最多,内含子次之,外显子最少,这与DNA序列不同区域的功能差异[27-29]相对应。
从图 6可以看出,F1代个体中,梅花鹿和马鹿特异SNP位点的比例均集中于40%~60%左右,并不是绝对的50%,一方面可能是由于亲本马鹿和梅花鹿的染色体组型存在差异[30],另一方面也可能是因为测序位点的缺失也会对比例计算结果造成一定的影响。另外,F1代个体的鉴别可参考Ward等[31]建立的四点视觉评分系统,通过体型、毛色、臀斑和头型的差异进行判定。F2代个体中,马鹿特异SNPs的比例主要在10%~30%之间,并不是集中在25%上下,除个体差异和测序位点的缺失之外,还有可能是亲本F1代的基因分离造成的。梅花鹿个体中,含马鹿特异SNPs的个体有理由怀疑其是杂交鹿。
4 结论本研究基于GBS技术以梅花鹿染色体为参考检测534个样本中的SNP变异。根据分子进化树显示的样本间进化关系确定参考群体,识别马鹿特异SNP位点474个,梅花鹿特异SNP位点558个。最终定量估计F1代个体含马鹿特异SNPs的比例在40%~60%之间,F2代个体含马鹿特异SNPs的比例在10%~30%之间,马鹿个体中不含梅花鹿的特异SNPs。
| [1] |
李和平, 赵宏楠, 张荣范. 目前我国梅花鹿良种繁育面临的问题及其有效对策——以"双阳梅花鹿"为例[J]. 特种经济动植物, 2018, 21(8): 2–4.
LI H P, ZHAO H N, ZHANG R F. Current problems and effective measures of sika deer breeding in China-- Take "Shuangyang Sika Deer" as an example[J]. Special Economic Animal and Plant, 2018, 21(8): 2–4. DOI: 10.3969/j.issn.1001-4713.2018.08.002 (in Chinese) |
| [2] |
衣洁菡, 王桐, 郭德慧, 等. 利用SNP分子标记对阿根廷滑柔鱼和科氏滑柔鱼的分子鉴定[J]. 食品科技, 2018, 43(10): 311–316.
YI J H, WANG T, GUO D H, et al. Molecular authentication of Illex argentinus and Illex coindetii by using SNP markers[J]. Food Science and Technology, 2018, 43(10): 311–316. (in Chinese) |
| [3] |
唐立群, 肖层林, 王伟平. SNP分子标记的研究及其应用进展[J]. 中国农学通报, 2012, 28(12): 154–158.
TANG L Q, XIAO C L, WANG W P. Research and application progress of SNP markers[J]. Chinese Agricultural Science Bulletin, 2012, 28(12): 154–158. (in Chinese) |
| [4] | THONGDA W, ZHAO H, ZHANG D, et al. Development of SNP panels as a new tool to assess the genetic diversity, population structure, and parentage analysis of the eastern oyster (Crassostrea virginica)[J]. Mar Biotechnol, 2018, 20(3): 385–395. DOI: 10.1007/s10126-018-9803-y |
| [5] | HUISMAN J. Pedigree reconstruction from SNP data:parentage assignment, sibship clustering and beyond[J]. Mol Ecol Res, 2017, 17(5): 1009–1024. DOI: 10.1111/1755-0998.12665 |
| [6] | ELSHIRE R J, GLAUBITZ J C, SUN Q, et al. A robust, simple genotyping-by-sequencing (GBS) approach for high diversity species[J]. PLoS One, 2011, 6(5): e19379. DOI: 10.1371/journal.pone.0019379 |
| [7] | TALUKDER Z I, SEILER G J, SONG Q J, et al. SNP Discovery and QTL mapping of sclerotinia basal stalk rot resistance in sunflower using genotyping-by-sequencing[J]. Plant Genome, 2016, 9(3). DOI: 10.3835/plantgenome2016.03.0035 |
| [8] | MONTERO-PAU J, BLANCA J, ESTERAS C, et al. An SNP-based saturated genetic map and QTL analysis of fruit-related traits in Zucchini using Genotyping-by-sequencing[J]. BMC Genomics, 2017, 18: 94. DOI: 10.1186/s12864-016-3439-y |
| [9] | HANSEN Z R, EVERTS K L, FRY W E, et al. Genetic variation within clonal lineages of Phytophthora infestans Revealed through genotyping-by-sequencing, and implications for late blight epidemiology[J]. PLoS One, 2016, 11(11): e0165690. DOI: 10.1371/journal.pone.0165690 |
| [10] | QI L L, LONG Y M, TALUKDER Z I, et al. Genotyping-by-sequencing uncovers the introgression alien segments associated with sclerotinia basal stalk rot resistance from wild species-I.Helianthus argophyllus and H.petiolaris[J]. Front Genet, 2016, 7: 219. |
| [11] | SONAH H, BASTIEN M, IQUIRA E, et al. An improved genotyping by sequencing (GBS) approach offering increased versatility and efficiency of SNP discovery and genotyping[J]. PLoS One, 2013, 8(1): e54603. DOI: 10.1371/journal.pone.0054603 |
| [12] | DONALDSON M E, RICO Y, HUEFFER K, et al. Development of a genotype-by-sequencing immunogenetic assay as exemplified by screening for variation in red fox with and without endemic rabies exposure[J]. Ecol Evol, 2018, 8(1): 572–583. DOI: 10.1002/ece3.3583 |
| [13] | BÉLANGER S, ESTEVES P, CLERMONT I, et al. Genotyping-by-sequencing on pooled samples and its use in measuring segregation bias during the course of androgenesis in barley[J]. Plant Genome, 2016, 9(1). DOI: 10.3835/plantgenome2014.10.0073 |
| [14] | CAO S L, LOLADZE A L, YUAN Y B, et al. Genome-wide analysis of tar spot complex resistance in maize using genotyping-by-sequencing SNPs and whole-genome prediction[J]. Plant Genome, 2017, 10(2). DOI: 10.3835/plantgenome,2016.10.0099 |
| [15] | FELDERHOFF T J, MCINTYRE L M, SABALLOS A, et al. Using genotyping by sequencing to map two novel anthracnose resistance loci in Sorghum bicolor[J]. G3 (Bethesda), 2016, 6(7): 1935–1946. DOI: 10.1534/g3.116.030510 |
| [16] | WHITE S J, VADOPALAS B, SILLIMAN K, et al. Genotoype-by-sequencing of three geographically distinct populations of Olympia oysters, Ostrea lurida[J]. Sci Data, 2017, 4: 170130. DOI: 10.1038/sdata.2017.130 |
| [17] | METIVIER S L, KIM J H, ADDISON J A. Genotype by sequencing identifies natural selection as a driver of intraspecific divergence in Atlantic populations of the high dispersal marine invertebrate, Macoma petalum[J]. Ecol Evol, 2017, 7(19): 8058–8072. DOI: 10.1002/ece3.3332 |
| [18] | ZHU F, CUI Q Q, HOU Z C. SNP discovery and genotyping using genotyping-by-sequencing in Pekin ducks[J]. Sci Rep, 2016, 6: 36223. DOI: 10.1038/srep36223 |
| [19] |
张彩云, 王晓亮, 涂盈盈, 等. 基于GBS技术的新杨绿壳纯系蛋鸡SNPs检测[J]. 中国家禽, 2018, 40(13): 7–10.
ZHANG C Y, WANG X L, TU Y Y, et al. SNPs detection of Xinyang blue-shelled pureline layers by GBS[J]. China Poultry, 2018, 40(13): 7–10. (in Chinese) |
| [20] |
谢艾轩, 吴启超, 李思德, 等. 四川麻鸭mtDNA全序列的克隆和生物信息学分析[J]. 畜牧兽医学报, 2017, 48(3): 436–445.
XIE A X, WU Q C, LI S D, et al. Complete sequence cloning and bioinformatics analysis of Sichuan Sheldrake duck mitochondrial genome[J]. Acta Veterinaria et Zootechnica Sinica, 2017, 48(3): 436–445. (in Chinese) |
| [21] |
魏艺聪, 蒋超, 袁媛, 等. 基于COI与SRY序列建立梅花鹿、马鹿及其杂交鹿茸的分子鉴别方法[J]. 中国中药杂志, 2017, 42(23): 4588–4592.
WEI Y C, JIANG C, YUAN Y, et al. Identification of Cervus nippon, C.elaphus and their hybridize samples based on COI and SRY gene[J]. China Journal of Chinese Materia Medica, 2017, 42(23): 4588–4592. (in Chinese) |
| [22] |
何俊, 钱长嵩, TAITR G JR, 等. SNP芯片数据估计动物个体基因组品种构成的方法及应用[J]. 遗传, 2018, 40(4): 305–314.
HE J, QIAN C H, TAITR G JR, et al. Estimating genomic breed composition of individual animals using selected SNPs[J]. Hereditas, 2018, 40(4): 305–314. DOI: 10.3760/cma.j.issn.1673-4386.2018.04.013 (in Chinese) |
| [23] | BA H X, LI Z P, YANG Y F, et al. Development of diagnostic SNP markers to monitor hybridization between sika deer (Cervus nippon) and Wapiti (Cervus elaphus)[J]. G3 (Bethesda), 2018, 8(7): 2173–2179. DOI: 10.1534/g3.118.200417 |
| [24] |
宋志芳, 芦春莲, 曹洪战. 全基因组重测序及其在动物育种的研究进展[J]. 畜牧与兽医, 2017, 49(11): 145–148.
SONG Z F, LU C L, CAO H Z. Research progress on whole genome resequencing in animal breeding[J]. Animal Husbandry & Veterinary Medicine, 2017, 49(11): 145–148. (in Chinese) |
| [25] | MALDE K, SELIUSSEN B B, QUINTELA M, et al. Whole genome resequencing reveals diagnostic markers for investigating global migration and hybridization between minke whale species[J]. BMC Genomics, 2017, 18: 76. DOI: 10.1186/s12864-016-3416-5 |
| [26] | BENTLEY N, GRAUKE L J, KLEIN P. Genotyping by sequencing (GBS) and SNP marker analysis of diverse accessions of pecan (Carya illinoinensis)[J]. Tree Genet Genomes, 2019, 15(1): 8. DOI: 10.1007/s11295-018-1314-5 |
| [27] | LIM C S, WARDELL S J T, KLEFFMANN T, et al. The exon-intron gene structure upstream of the initiation codon predicts translation efficiency[J]. Nucleic Acids Res, 2018, 46(9): 4575–4591. DOI: 10.1093/nar/gky282 |
| [28] | NGHIEM P P, BELLO L, BALOG-ALVAREZ C, et al. Whole genome sequencing reveals a 7 base-pair deletion in DMD exon 42 in a dog with muscular dystrophy[J]. Mamm Genome, 2017, 28(3-4): 106–113. DOI: 10.1007/s00335-016-9675-2 |
| [29] |
聂光伟, 李明杨, 毛翠, 等. 大白猪PTGS2基因外显子2多态性及其与繁殖性状的关联分析[J]. 中国畜牧兽医, 2018, 45(1): 140–146.
NIE G W, LI M Y, MAO C, et al. Polymorphism of PTGS2 gene exon 2 and its association analysis with reproductive traits in large white pigs[J]. China Animal Husbandry & Veterinary Medicine, 2018, 45(1): 140–146. (in Chinese) |
| [30] |
王宗仁, 杜若甫. 鹿科动物的染色体组型及其进化[J]. 动物学报, 1983, 29(3): 214–222.
WANG Z R, DU R F. Karyotypes of cervidae and their evolution[J]. Acta Zoologica Sinica, 1983, 29(3): 214–222. (in Chinese) |
| [31] | WARD J F, SCOTT I, ASHER G W, et al.Development of a "Wapiti Score" visual assessment tool for determining introgression of wapiti genes in young red deer[C]//Proceedings of the New Zealand Society of Animal Production.Napier: NZSAP, 2006: 139-141. |


