


The gas-liquid two-phase flow exists widely in the industrial environments. Research is focused on the different signals of the two-phase flow,since the flow signals contain a lot of features of gas-liquid two-phase flow information[1, 2, 3]. The flow features can be indicated and highlighted by signal processing and analysis. With the development of signal technology,many signal analysis methods can explore the characteristics of this flow regime. However,different methods have distinguished advantages and disadvantages at the same occasion. A good method should show both the flow characteristics and an advanced resolution of analysis result,which means the more characteristics of the signal can be identified,the less cross interference of signal decompositions can be.
Short Time Fourier Transformation (STFT) is considered as a development of Fourier Transformation,which employs the window function with a fixed shape and length,so the time and frequency domain resolution can’t achieve optimum at the same time and thus some information is lost. The time-frequency resolution of STFT is relatively low. Wavelet Transformation (WT) uses the basic function with constant Q value[4, 5, 6],which is suitable for analyzing the self-similar signal. Although it can profile the energy distribution,WT induces energy aliasing.
The bandwidth of energy distribution is long,resulting in low resoultion of energy distribution. HHT(Hilbert-Huang Transformation) is a signal time-frequency analysis method of a perferable local characteristic[7, 8]. It is requested to perform the Empirical Mode Decomposition (EMD) before HHT transformation,and each Intrinsic Mode Factor (IMF) of EMD reflects a single component in a single instantaneous frequency. Generally speaking,EMD is a way of decomposing the signal into a superposition of single-component information. However,the gas-liquid two-phase flow is a complex non-stationary system that contains different frequency components at different times,and thus the EMD decomposition overlays the main component of signals and the details of frequency characteristics will be lost. AOK transformation is a new method of time-frequency analysis with high resolution,and it can clearly express the signal energy profile. But it can′t either get away from the cross interference as quadratic time-frequency analysis method.
The method of the adaptive Chirplet transformation has been widely used in the analytical processing of mechanics vibration signals[9, 10]. The basic idea of this method is to decompose the complicated signal into a combination of basic signals. Through analyzing the basic signals,the purpose of analyzing the complex signal is achieved. Compared with EMD,Chirplet transformed Gaussian function (used as the base function,transformed by time-shift,frequency-shift,time-frequency telescopic,time-inclined,and frequency-inclined,computing the inner product with the signal),is applicable for the analysis of the multi-component signals[11]. This method can be used in the analysis of non-stationary signals with varying bandwidth or proportion bandwidth. This paper mainly discusses the applications of this method in the analysis of gas-liquid two-phase flow dynamic differential pressure signals.
 |
| Fig 1 The schematic diagram of two-phase flow signals with adaptive Chirplet transformation 图 1 自适应线性调频小波分析气液两相流的原理框图 |
The quadratic time-frequency analysis method will introduce the interference,and its result is with low resolution[9]. The adaptive Chirplet transformation as a new method could solve the two problems above.
The basic idea of the adaptive Chirplet transformation[12]is: Firstly,choose the elementary function to establish the function library model which could be consistant with the internal hierarchy of the signal; secondly,the elements in the function library are used to optimize four parameters to match the components of the signal,and then the Chirplet elementary function is the most matching function with the original signal. This Chirplet elementary function is called optimal Chirplet time frequency atom. The Chirplet transformation can get the inner product of the signal and the optimal time-frequency atoms,and change the signal to a series of function.
Its definition is
For a given signal x(t),* denoting complex conjugate,gtc,fc,log(Δt),c,d(t) as the Chirplet elementary function,which has four parameters: time center tc,frequency center fc,linear frequency modulation rate c,and time scale parameter Δt.
The key part of Chirplet transformation processing is to choose the best elementary function. The Gauss Chirplet as a common elementary function is widely used in signal processing.

Matching pursuit algorithm is an iterative algorithm for signal decomposition; signals will be rectangularly projected in the space and then be expanded to the weighted sum of Gauss Chirplet functions. The most relevant function is sel ected from the elementary function library to match residual signals.
That is,for a given signal x(t),firstly a Gauss Chirplet function g0(t) should be selected,which should ensure that the distance between x(t) and its orthogonal projection on g0(t) can reach minimum value in the sense of
In the expression,x0(t)=x(t),finding a g0(t) that is the closest to x0(t) so that the inner product gets the largest value:

Where Ak=〈xk(t),gk(t)〉,if the elementary functions have unit energy,‖gk(t)‖2=1,the energy of the signal can be expressed as follows:
2 Parametric estimation of adaptive Chirplet transformation
The specific value of ‖xk+1(t)‖2 and ‖x(t)‖2 is used to determine the times of the Chirplet decomposition (‖xk+1(t)‖2 is the energy of residual,‖x(t)‖2 is the energy of signal),until the specific value is less than 10%. It can be considered that the main information of signals has been extracted. The signal is decomposed into different components (the component can be called atom) by the adaptive Chirplet transformation,and these atoms’ information can be read in the time-frequency spectrum. Figure 2 shows the time-frequency parameters of a single Gauss Chirplet atom.
 |
| Fig 2 Gauss Chirplet time-frequency parameter 图 2 Gauss线性调频小波时频参数 |
The estimated Gauss Chirplet parameters can be obtained as follow
Where B is: Where m means the test point. (tck,fck,ck,dk) can be calculated by a group of test points (tck,m,fck,m,ck,m,dk,m).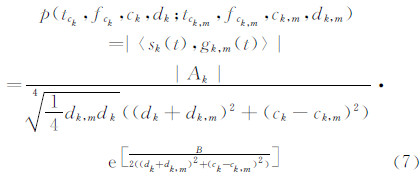
According to the above method,the parameters of every optimal elementary Chirplet function can be gotten. Table 1 shows some parameters of the bubbly flow with the liquid phase flow rate 9.5m3/h and gas phase flow rate 2.79m3/h. Decomposition times are 80,and the specific value of ‖xk+1(t)‖2 and ‖x(t)‖2 is 9.17%.
| t c | f c | arctan( c) | d |
| 8.417 | 20.863 | -2.66 | 0.114 |
| 5.666 | 21.157 | 59.564 | 0.053 |
| 0.493 | 22.838 | 33.712 | 0.046 |
| 13.281 | 21.654 | -78.006 | 0.035 |
| 10.860 | 18.777 | 0.015 | 2.4355 |
| 9.656 | 20.590 | -0.005 | 2.685 |
| 14.621 | 21.356 | 20.035 | 0.141 |
| 3.475 | 22.0873 | -70.674 | 0.032 |
In this paper,the gas-liquid two-phase flow in a horizontal pipeline is investigated. Air and water are the experimental media. The φ50mm pipe system and standard flowmeters were set up in accordance with the measurement requirements.
The experimental system is shown in Fig. 3,which is composed of water pump,air compressor,gas surge tank and water surge tank. The whole system has liquid phase route and gas phase route: air compressor is the power equipment of gas phase route,where the entrance pressure is in range of (0.4-0.8)MPa and the flow could be modulated between (0.5-6)m3/h; water pump is the power equipment of liquid phase route,where the flow range is in (4-16)m3/h. After the two phases going through the surge tank,there are standard flowmeters to measure the two routes: electromagnetic flowmeter and LUX-50vor-tex precession flowmeter were used in water and gas flow measurement,respectively. The two-phase flow could be produced in mix phase detectors.
 |
| Fig 3 Scheme of the experimental system 图 3 实验装置示意图 |
In this experiment,the rates of flow were changed and adjusted to produce three flow patterns: bubbly flow,slug flow and plug flow. The HM31 high frequency differential pressure sensors manufactured by Nanjing Helm Sci-tech Co.Ltd which has 1kHz frequency response,0.8% accuracy,and (0-2)MPa measuring range,were used to collect differential pressure signals.
3.2 The multi-hole orifices plate flowmeterThe multi-hole orifices plate flowmeter is a new kind of differential-pressure- type flowmeter,which is composed of several holes and has more advantages than the traditional orifice plate flowmeter. Its working principle is based on the law of conservation of energy (Bernoulli equation) and fluid continuity equation. The structural drawing is shown in Fig. 4.
 |
| Fig 4 The structural drawing of multi-hole orifices plate flowmeter 图 4 多孔孔板流量计结构图 |
The multi-hole orifices plate flowmeter in this study has 14 holes with two different diameters. 10 holes on orifices plate are of 50mm diameter,the rest 4 holes are of 5mm diameter. The equivalent diameter ratio is calculated as below:
Where,
A0——The sum of the holes circulation area (m2),
A——The flow area of pipeline(m2),
N——The holes number(N1 is the number of big holes,N2 is the number of small holes)
D——The inner diameter of the pipeline under working condition(m),
d——The inner diameter of the small hole(m),
β——The diameter ratio of circulation,non-dimensional.
qv is the volume flow of fluid(m3/s),
where
C——The efflux coefficient,non-dimensional;
ε——The expansibility factor of measured media,for the incompressible fluid,ε=1; for compressible fluid as gas or steam,etc,ε < 1;
Δp——The differential pressure,Δp=pA-pB (Pa);
ρA——The fluidic density upstream of throttling component under working condition(kg/m3).
Manufactured by Tianjin Runtai Automation Instrument Company Limited,the main parameters of the flowmeter are as follow: the inner diameter of pipeline is 50mm,accuracy class is 0.5,the flowrate range is (7-25)m3/h,the efflux coefficient is 0.6704,the inner diameter of orifice plate is 30.406,and the circulation diameter ratio β is 0.6081.
4 Analyzing the gas-liquid two-phase flow signals based on the adaptive Chirplet transformation 4.1 The time-frequency spectrum of adaptive Chirplet transformationIn this work,the Gauss Chirplet is chosen as the elementary function for transformation. The adaptive Chirplet transformation is a four dimensional procedure (time-frequency-scale-linear frequency modulation slope transformation). The superiority of this transformation is not only providing the movement characteristics of the time and frequency in the time-frequency domain but also introducing the frequency tilt and time tilt,which could better adapt to the signals’ local characteristics.
The spectrum analysis of Chirplet transformation (CT) and STFT transformation with different flow types is shown in Fig. 5-Fig. 7.
 |
| Fig 5 Time-frequency spectrum of bubble flow 图 5 泡状流时频谱图 |
 |
| Fig 6 Time-frequency spectrum of slug flow 图 6 弹状流时频谱图 |
 |
| Fig 7 Time-frequency spectrum of plug flow 图 7 塞状流时频谱图 |
Figure 5 shows the time-frequency spectrum of bubble flow. The upper figure is the time-frequency spectrum obtained by CT. It demonstrates that the signal’s energy mostly concentrates on the high frequency region,and the frequency band is narrow,mainly located in the region of (18-30)Hz. The energy of bubble flow signal is feeble. From the spectrum diagram,it is clear that CT transformation has a higher resolution with no cross-term interference. In the CT transformation spectrum,the signal’s time-frequency distribution information is illustrated in the time-frequency domain,which can well reveal the instantaneous frequency changes of the signal and the components of the signal. The frequency centers and time centers of the corresponding components could also be observed from the spectrum diagram,which thus could also indicate the frequency shifts in the time domain.
Figure 6 is the time-frequency spectrum of slug flow. As the time-frequency resolution getting high,the energy focuses can be clearly displayed. There are three frequency bands: (0-8)Hz,(18-23)Hz and (25-30)Hz. Slug flow has been defined as a transitional flow pattern between bubble flow and plug flow,and its time-frequency distribution is between bubble flow and plug flow. Slug flow signal loaded with some noises can be seen in the time-frequency spectrum of CT. The spectrum diagram shows the details of signal’s components distribution situation,excluding the interferences caused by noises.
The signals’ components information in the CT spectrum is presented in a linear distribution,which can be divided into horizontal and vertical components. Because the CT is based on Fourier theoretical model,the essence of the model is: the original signal is unfolded into the form of linear frequency modulation wavelet series form. Each individual atom of the time-frequency diagram represents one of the signal’s components,when it is combined with time domain information. We can study the instantaneous frequency of each component. The set of components’ instantaneous frequency embodies the original signal’s frequency variations. Through the spectrum diagram of CT,interference item is excluded in the time-frequency analysis of slug flow signals. Energy distribution reflects more essential and precise information.
Figure 7 is the time-frequency spectrum of plug flow. The energy is mainly concentrated in a low frequency region (0-5)Hz. The numbers of the CT decomposition are determined according to the ratio of the residual energy to the total energy. In the CT transformation,the signal information is considered as fully represented when the ratio of the residual energy to the original signal is within 10%.
4.2 Extracting characteristic value based on the Chirplet transformationThe flow pattern is an important parameter for gas-liquid two-phase flow which can be obtained by the feature extraction. The gas-liquid two-phase flow is of non-stationary characteristic; moreover,each flow regime has its own certain rules in flow process. It’s the most common method that can extract and estimate the characteristic values to identify flow patterns of gas-liquid two-phase flow. In this course,the characteristic values should represent close relationships with flow patterns; otherwise,it will not be possible to establish an accurate connection among them. We extract three characteristic values based on analyzing the time-frequency spectrum of adaptive Chirplet transformation.
F2: frequency domain coordinates of energy gravity centre in Chirplet transform time-frequency spectrum.

In formula (11),TR(x,y) is the energy distribution of Chirplet transformation time-frequency spectrum.

Time domain coordinates and frequency domain coordinates of energy gravity centre in Chirplet transformation time-frequency spectrum.
F3:Low frequency band energy accounted for the total energy percentage.
F4: High frequency band energy accounted for the total energy percentage.
PAOK(f,t) is an adaptive time-frequency distribution; E is the total energy of Chirplet transformation distribution; EL is the energy in low frequency region; EH is the energy in high frequency region. According to the analyzed results,(0-10)Hz is defined as the low frequency band; (15-30) Hz is the high frequency band.
Figure 8 is a scatter plot of F2-F3-F4. The flow pattern changes from bubble flow to slug flow and then to plug flow. F2 moves to the low-frequency band. At the same time,F3 gradually increases while F4 gradually decreases.
 |
| Fig 8 The scatter plot of F2-F3-F4 图 8 F2-F3-F4散点图 |
The following information can be obtained from Fig. 8: Firstly,through analyzing characteristic value changes of F2,it is found that F2 is distributed in the high-frequency band (15-25)Hz for bubble flow,mid-frequency band (7-15)Hz for slug flow,and low-frequency band (0-8)Hz for plug flow,respectively. F2 gradually moves from the high-frequency band to the low-frequency band with the flow pattern changing. Secondly,there is a relationship between the characteristic value F3 and the flow patterns: F3 is 1%~30% for bubble flow,45%~80% for slug flow,80%~100% for plug flow,respectively. Thirdly,F4 is the distribution of different flow patterns: bubble flow is in range of 60%~100%,slug flow,15%~40%,plug flow,15% or less,respectively. According to the above analysis,it could be concluded that when the gas flow increases,the flow patterns would change from bubble flow to slug flow and then to plug flow. F3 gradually increases while F4 gradually decreases.
From the scatter plot of F2-F3-F4,it can be obviously found out that the characteristic values′ distributions of different flow patterns are mainly concentrated in respective intervals. So it’s easy to achieve the signal classification which can get the relationship between the characteristic value distribution and the different flow patterns. It is a foundation for the flow pattern identification. In Fig. 8,other information also can be obtained. The coincident portion may be considered to be a slug-plug mixed flow and this phenomenon appears during the actual signal acquisition experiment. Because the transition from the slug flow to plug flow is a complicated process,with the gas increasing a lot of slug-plug mixed flow signals will form. The interface between slug flow and plug flow is not easy to distinguish and the slug-plug mixed flow signals are easily to be collected in the experiments.
5 ConclusionsIn this paper,adaptive Chirplet transformation is adopted to analyze the dynamic differential pressure signals of different gas-liquid two-phase flow and to identify the flow patterns. This method has high time-frequency resolution ratio,and good performance in reducing noise. The instantaneous frequency information of signal components can be clearly shown. By extracting characteristic value from the time-frequency spectrum of adaptive Chirplet transformation,scatter plots of the characteristic value can be set up for observing the corresponding relationship between scatter plots and flow patterns. Important theoretical basis for the flow pattern identification can be provided through analyzing each characteristic value distribution of different flow patterns.
| [1] | Bultan A. A four-parameter atomic decomposition of Chirplets[J]. IEEE Trans Signal Process, 1999, 47(3):731-745. |
| [2] | Trallero J L, Brill J P. A study of oil-water flow patterns in horizontal pipes[M]//Bruce E B. Production and Facilities, 1996:165-172 |
| [3] | Gourich, Bou Chaib, Christophe. Identification of flow regimes and transition points in a bubble column through analysis of differential pressure signal-Influence of the coalescence behavior of the liquid phase[J]. Chemical Engineering and Processing, 2006, 45(3):214-223. |
| [4] | Sun B, Bai H Z, Huang Y M. Application of AR model based on EMD and ICA in flow regime identification for gas-liquid two-phase flow[J]. CIESC Journal, 2010, 61(11):2789-2795. |
| [5] | Ding H, Huang Z Y, Song Z H. Hilbert-Huang transform based signal analysis for the characterization of gas-liquid two-phase flow[J]. Flow Measurement and Instrumentation, 2007, 18(1):37-46. |
| [6] | Feng Z, Chu F. Nonstationary vibration signal analysis of hydroturbine based on adaptive Chirplet decomposition[J]. Structural Health Monitoring, 2007, 6(4):265-279. |
| [7] | Sun Bin, Wang Erpeng, Zheng Yongjun. Time-frequency spectral analysis of gas-liquid two-phase flow's fluctuations[J]. Acta Physica Sinica, 2011, 60(1):014701_1-014701_8. |
| [8] | Sun Bin, Zhou Yunlong, Guan Yuebo, et al. Different pressure fluctuation characteristic of gas-liquid two-phase flow pattern in horizontal tube[J]. Journal of Northeast China Institute of Electric Power Engineering, 2002, 22(4):12-16. |
| [9] | Lopez-Risueno G, Grajal J, Yeste-Ojeda O. Atomic decomposition-based radar complex signal interception. IEE Proceedings-Radar[J]. Sonar& Navigation, 2003, 150(4):323-331 |
| [10] | Yin Q Y, Qian S E, Feng A G. A fast refinement for adaptive Gaussian Chirplet decomposition[J]. IEEE Transactions on Signal Processing, 2002, 50(6):1298-1306 |
| [11] | Qiu Jianfeng, Xie Juan, Wang Jiwen, et al. Chirplet transform and its extension[J]. Journal of Hefei University of Technology(Natural Science), 2007, 30(12):1575-1579. |
| [12] | Yu Fengqin, Dong Xilin, Cao Jialin. Three-parameter Chirp atoms and the searching method in matching pursuit[J]. Systems Engineering and Electronics, 2005, 10(27):1711-1713. |