2. 中海石油(中国)研究总院有限责任公司, 北京 100028
2. CNOOC Research Institute Co., Ltd, Beijing 100028, China
东海深层低渗气藏主要分布在3500 m以下[1],资源量巨大[2]。为了实现深层低渗气藏的高效开发,准确预测“甜点”具有重要的意义。
目前对“甜点”的预测主要集中在非常规储层方面,如页岩气[3]、页岩油[4]、煤层气[5]、致密油[6]、致密气[7-12]等。对于致密气的“甜点”预测,应用的地球物理方法主要包括:①地震资料优化处理,如保真、保幅宽频、高分辨率地震资料叠前成像等;②储层反演,如叠前AVO反演、岩相约束的孔隙度(Φ)反演、密度反演等;③地震沉积学技术,如利用地层切片对岩相开展“甜点”垂向分布规律分析。总体上,不同地区“甜点”的地震响应特征不同,地球物理预测方法虽有差异,但研究思路相似。具体而言,“甜点”类型的划分是“甜点”预测的基础,岩石物理敏感参数的识别是“甜点”预测的关键,储层反演是“甜点”预测的核心。因此,在地质特征定性分析、划分“甜点”类型的基础上,寻找不同“甜点”的岩石物理敏感参数,应用合适的反演技术,可以预测“甜点”的空间展布特征。
西湖凹陷Z气田是近期东海陆架盆地发现的大型低渗气田之一,储层非均质性强,“甜点”的空间展布规律直接影响开发井位的设计方案。前人研究主要集中在“甜点”的地质特征[13-16]、储层分类[17]、地质成因[18]、测井评价[19]等方面。在利用地球物理技术预测“甜点”方面 [20-21],尚未进一步开展不同类型“甜点”的精细预测。
为此,本文在划分“甜点”类型的基础上,分析不同类型“甜点”的岩石物理特征及变化规律;然后建立合适的地质—地球物理模型,模拟储层的地震反射特征;通过叠前弹性反演,实现厚储层内部“甜点”的精细表征,为大型低渗气田的有效开发提供地球物理技术支持。
1 甜点储层特征Z气田位于西湖凹陷中央反转构造带中北部,主要开发层系为H3(花港组三段),发育河流—三角洲相沉积[22-23]。砂体储层厚度约为200 m,非均质性强,埋深大于3500 m,一般具有低孔、低渗特征。H3进一步可以细分为H3a、H3b、H3c三个小层[24]。其中,H3a储层为特低孔、特低渗,H3b、H3c储层均以中低孔、中低渗为主,但是在局部发育物性相对较好的“甜点”。
1.1 “甜点”分类及地质特征在前人研究成果[25-30]的基础上,综合考虑产能、物性、孔隙结构等因素,同时将控制上述参数的沉积相和成岩相及相关参数纳入“甜点”评价标准。据此,研究区“甜点”可进一步划分为三类(表 1),即Ⅰ类、Ⅱ类和Ⅲ类。Ⅰ类和Ⅱ类“甜点”为高产层段,具有自然产能;Ⅲ类需要进行储层压裂改造。
|
|
表 1 Z气田H3b“甜点”分类评价参数及特征表 |
由表 1可见,Ⅰ类和Ⅱ类“甜点”差异较大。Ⅰ类“甜点”孔隙度(Φ)大于11%,渗透率大于10 mD,孔隙结构以大孔喉道型为主;Ⅱ类“甜点”孔隙度为9%~11%,渗透率为3~10 mD,孔隙结构以中孔喉道型为主。
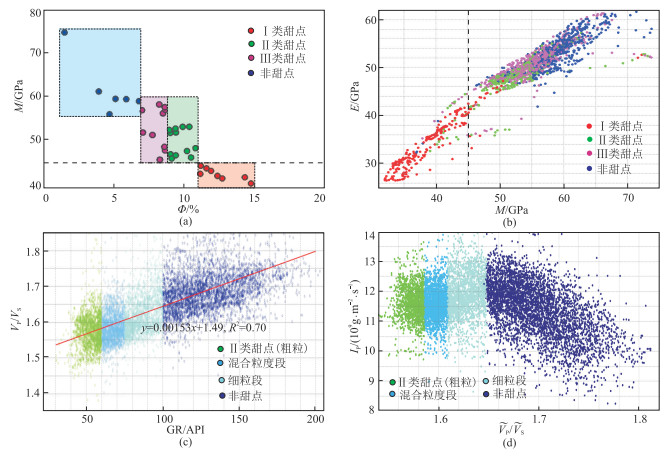
1.2 “甜点”敏感地球物理参数分析通过岩石孔隙度Φ与岩石物理实验实测纵波模量(M)交会分析(图 1a)、测井数据计算的纵波模量与杨氏模量(E)交会分析(图 1b),可以发现:相对于非“甜点”储层,“甜点”储层具有低M、低E的特征;Ⅰ类“甜点”的M低于45GPa,区分度较高,但是M较难用于区分Ⅱ类“甜点”。
|
图 1 “甜点”岩石物理分析 (a)Φ与M交会;(b)M与E交会;(c)Ⅱ类“甜点”GR与VP交会;(d)Ⅱ类“甜点” |
Ⅱ类“甜点”主要为中粗砂岩,自然伽马(GR)较低(图 1c),对Ⅱ类“甜点”有一定区分度。当GR≤60 API时,大部分为含砾砂岩和粗砂岩;当GR > 60 API时,各粒度砂岩叠置,无法区分。为了实现Ⅱ类“甜点”可预测的目的,采用GR划分储层类型,即当GR≤60 API时,为Ⅱ类“甜点”砂岩;当60 API < GR≤75 API时,为各粒度叠置混合砂岩;当75 API < GR≤100 API时,为细砂岩;当GR > 100 API时,为泥岩。因此,Ⅱ类“甜点”预测时只考虑GR≤60 API的储层。
利用地震资料直接预测GR难度较大,但VP/VS(纵横波速度比)与GR相关性较高(图 1c),相关度R2达到0.7。因此,可以利用VP/VS与GR的相关性,将GR转换成
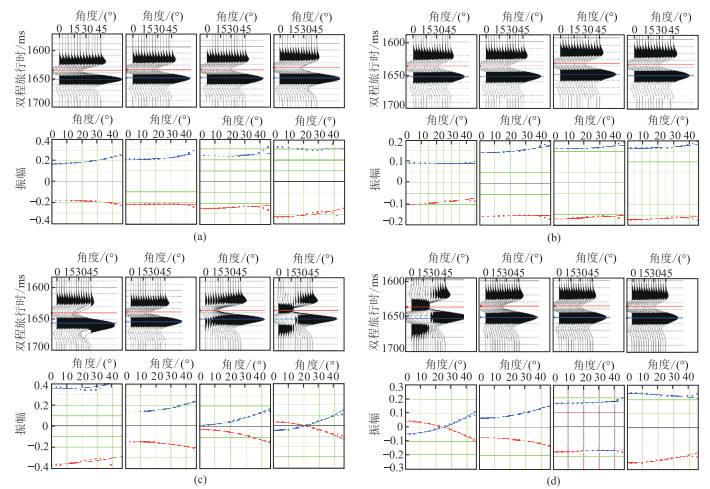
由图 2可见,对储层地震反射特征影响较大的两个因素分别是孔隙类型和孔隙度。随着泥质含量的增加,砂岩底面的地震反射AVO曲线的截距为正且增加,但是梯度逐渐减小,曲线趋于平缓(图 2a)。随着含气饱和度的增加,砂岩底面的地震反射AVO曲线的截距为正且增加,但是当含气饱和度超过50%后,AVO曲线无明显变化(图 2b)。随着原生孔隙占比降低、砂岩孔隙连通性的变好,砂岩底面的地震反射AVO曲线的截距逐渐减小,由正变负,但是梯度逐渐增大(图 2c)。随着孔隙度的增加,砂岩底面的地震反射AVO曲线的截距增加,由负变正,但是梯度逐渐减小,由正变负(图 2d)。
|
图 2 振幅的不同影响因素分析 (a)泥质含量(从左到右依次为5%、10%、20%、40%);(b)含气饱和度(从左到右依次为0、20%、50%、90%);(c)孔隙结构(从左到右原生孔孔隙占比依次为80%、40%、20%、10%);(d)孔隙度(从左到右依次为5%、10%、15%、20%) |
为了对比“甜点”与非“甜点”的AVO响应特征,分别将研究区Z1井Ⅰ类和Ⅱ类“甜点”的速度、密度设置与围岩一致,实现非“甜点”储层替换,具体参数见表 2。
|
|
表 2 Z1井简化地层模型的弹性参数 |
从图 3可以看出,Ⅰ类“甜点”是引起AVO异常的主要原因,Ⅰ类“甜点”替换为非“甜点”后反射振幅明显减弱。Ⅱ类“甜点”与非“甜点”的物性差异不大,所以替换前、后的AVO响应没有明显的变化。由此可见,Ⅰ类“甜点”在叠后地震资上表现为强振幅特征,而Ⅱ类“甜点”振幅无明显异常。

|
图 3 Ⅰ类(a)和Ⅱ类(b)“甜点”替换前(左)、后(右)地震响应特征对比 DTC、DTS、DEN分别为纵波时差、横波时差、密度。 |
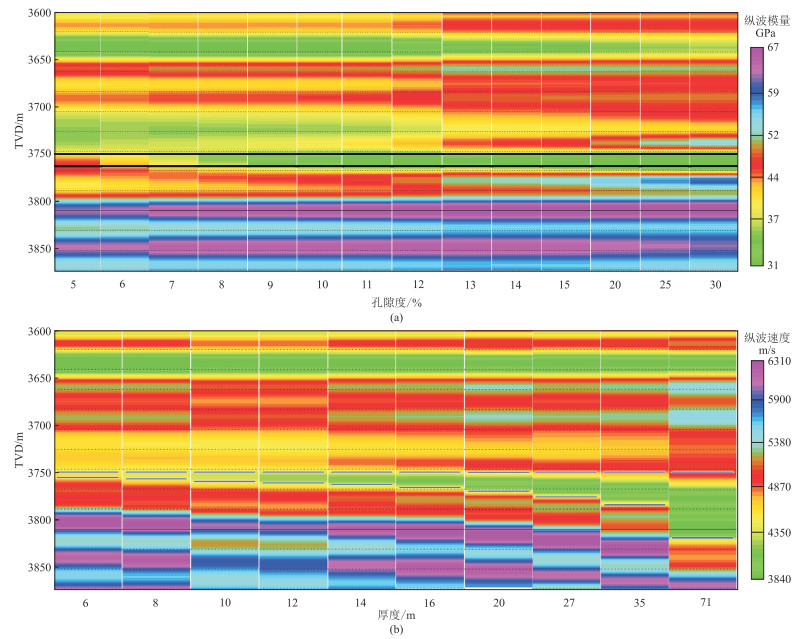
影响“甜点”识别精度的因素主要为孔隙度和厚度。通过AVO正演模拟不同孔隙度和不同厚度甜点的AVO响应特征(图 4)可以看到,Ⅰ类“甜点”在叠前地震正演中得到的纵波模量为异常低值,同时随着孔隙度的增大,纵波模量变小。
|
图 4 不同孔隙度(a)和不同厚度(b)“甜点”储层特征 |
随着孔隙度的变化,地震反演方法对甜点的预测精度规律如下(图 4a):当孔隙度<9%时,无法准确预测“甜点”的位置和厚度;当孔隙度 > 15%时,“甜点”预测厚度要大于真实厚度;当孔隙度在10%~15%时,“甜点”预测厚度与真实厚度基本一致。
随着厚度的变化,地震反演对甜点的预测精度规律如下(图 4b):当厚度 < 12 m时,反演结果无法同时准确地确定“甜点”的位置和厚度;当厚度范围在12~35 m时,“甜点”预测厚度与真实厚度基本吻合;当厚度 > 35 m时,可以确定“甜点”的位置但预测厚度存在一定偏差。因此,对于孔隙度 > 10%、厚度 > 12 m的“甜点”,反演预测结果的可靠性较高,即采用叠前反演方法可较好地表征厚度 > 12 m的Ⅰ类“甜点”。
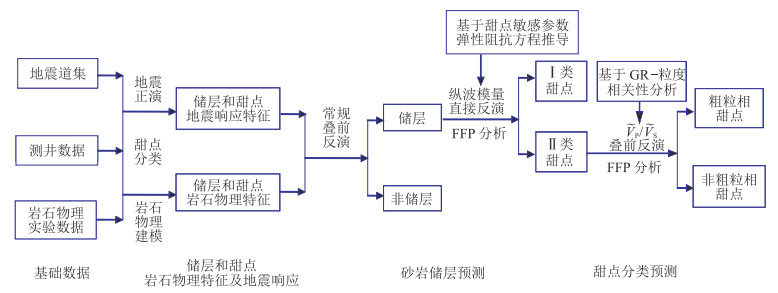
2 “甜点”地震预测方法 2.1 技术流程在“甜点”分类、岩石物理分析及地震响应特征分析的基础上,采用基于“甜点”敏感参数弹性阻抗方程推导的纵波模量可以直接反演以表征Ⅰ类“甜点”,基于GR—粒度相关分析的
|
图 5 甜点预测的关键技术与流程 FFP为岩相与流体概率(Facies & Fluid Probabilities)。 |
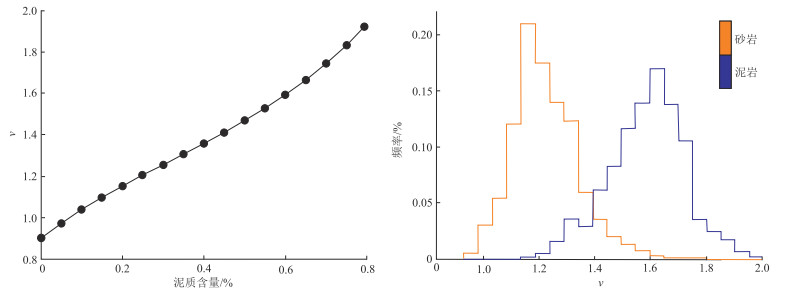
由图 6a可见,随着泥质含量的增加,ν (纵横波模量比)增大,二者之间相关性较高,这表明ν可作为储层预测的敏感参数。
|
图 6 泥质含量变化引起弹性参数的变化(左)及砂泥岩ν直方图(右) |
由图 6b可见,砂岩与泥岩ν范围存在一定的差异,砂岩ν ≤1.4,泥岩ν>1.4。
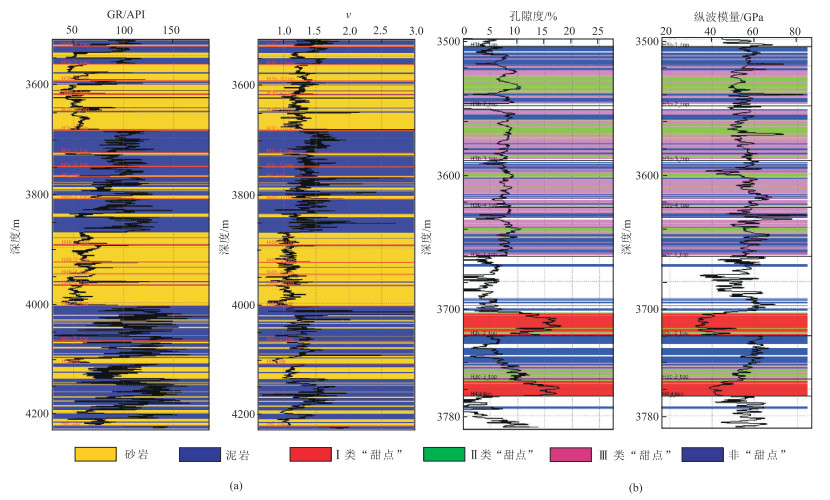
由图 7a可见,砂岩ν值低,泥岩ν值高,这表明利用ν可较好地区分砂岩与泥岩。由图 7b可见,砂岩区域Ⅰ类“甜点”存在低纵波模量值的特征,这更进一步验证了纵波模量用于区分Ⅰ类“甜点”的可行性。
|
图 7 Gr、ν对岩性(a)和孔隙度、纵波模量对甜点(b)的区分 |
Ⅰ类“甜点”的敏感弹性参数为M,而储层敏感参数为ν。为消除间接反演所导致的累计误差,需要构建M、ν的平面波反射特征方程。
Zeoppritz方程的近似公式为
| $ \begin{array}{l}R\left(\theta \right)\approx \frac{1}{2}\mathrm{s}\mathrm{e}{\mathrm{c}}^{2}\theta \frac{\mathrm{\Delta }{V}_{\mathrm{P}}}{\overline{V_\mathrm{P}}}-4{\gamma }^{2}\mathrm{s}\mathrm{i}{\mathrm{n}}^{2}\theta \frac{\mathrm{\Delta }{V}_{\mathrm{S}}}{\overline{V_\mathrm{S}}}+\\ \;\;\;\;\;\;\;\; \frac{1}{2}(1-4{\gamma }^{2}\mathrm{s}\mathrm{i}{\mathrm{n}}^{2}\theta )\frac{\mathrm{\Delta }\rho }{\overline{\rho }}\end{array} $ | (1) |
式中:
纵波模量反射系数
| $ \frac{\mathrm{\Delta }{V}_{\mathrm{P}}}{\overline{V_\mathrm{P}}}=\frac{1}{2}\left(\frac{\mathrm{\Delta }M}{\overline{M}}-\frac{\mathrm{\Delta }{V}_{\mathrm{S}}}{\overline{V_\mathrm{S}}}\right) $ | (2) |
| $ \frac{\mathrm{\Delta }\nu }{\overline{\nu }}=\frac{6}{3-4{\gamma }^{2}}\left(\frac{\mathrm{\Delta }{V}_{\mathrm{P}}}{\overline{V_\mathrm{P}}}-\frac{\mathrm{\Delta }{V}_{\mathrm{S}}}{\overline{V_\mathrm{S}}}\right) $ | (3) |
将式(2)、式(3)代入式(1),可得到基于
| $\begin{gathered} R\left(\theta \right)\approx \left(\frac{1}{4}\mathrm{s}\mathrm{e}{\mathrm{c}}^{2}\theta -2{\gamma }^{2}\mathrm{s}\mathrm{i}{\mathrm{n}}^{2}\theta \right)\frac{\mathrm{\Delta }M}{\overline{M}}+\\ \frac{(6{\gamma }^{2}-8{\gamma }^{4})\mathrm{s}\mathrm{i}{\mathrm{n}}^{2}\theta }{3}\frac{\mathrm{\Delta }\nu }{\overline{\nu }}+(\frac{1}{2}-\frac{1}{4}\mathrm{s}\mathrm{e}{\mathrm{c}}^{2}\theta )\frac{\mathrm{\Delta }\rho }{\overline{\rho }} \end{gathered} $ | (4) |
式中:
相比于叠前AVO反演及叠后反演,叠前弹性阻抗反演利用了叠前部分叠加道集资料,综合利用了叠后反演与叠前反演的优点,不仅可以反演对储层较为敏感的弹性参数和物性参数,而且具有较强的抗噪能力。因此,本文在Connolly弹性阻抗方程的基础上,提出了基于M、
| $ \mathrm{E}\mathrm{I}\left(\theta \right)={\left({M}_{0}{\rho }_{0}\right)}^{\frac{1}{2}}{\left(\frac{M}{{M}_{0}}\right)}^{a}{\left(\frac{\nu }{{\nu }_{0}}\right)}^{b}{\left(\frac{\rho }{{\rho }_{0}}\right)}^{c} $ | (5) |
式中:
由式(5)可知,为了获得纵波模量、
为了简化计算,可将式(5)模型进行线性变换,方程两边取对数,可以得到模型
| $ \mathrm{l}\mathrm{n}\frac{\mathrm{E}\mathrm{I}\left(\theta \right)}{{A}_{0}}=a\;\mathrm{l}\mathrm{n}\frac{M}{{M}_{0}}+b\;\mathrm{l}\mathrm{n}\frac{\nu }{{\nu }_{0}}+c\;\mathrm{l}\mathrm{n}\frac{\rho }{{\rho }_{0}} $ | (6) |
式中
| $ \left\{\begin{array}{c}\mathrm{l}\mathrm{n}\frac{\mathrm{E}\mathrm{I}\left({\theta }_{1}\right)}{{A}_{0}}=a\left({\theta }_{1}\right)\mathrm{l}\mathrm{n}\frac{M}{{M}_{0}}+b\left({\theta }_{1}\right)\mathrm{l}\mathrm{n}\frac{\nu }{{\nu }_{0}}+c\left({\theta }_{1}\right)\mathrm{l}\mathrm{n}\frac{\rho }{{\rho }_{0}}\\ \mathrm{l}\mathrm{n}\frac{\mathrm{E}\mathrm{I}\left({\theta }_{2}\right)}{{A}_{0}}=a\left({\theta }_{2}\right)\mathrm{l}\mathrm{n}\frac{M}{{M}_{0}}+b\left({\theta }_{2}\right)\mathrm{l}\mathrm{n}\frac{\nu }{{\nu }_{0}}+c\left({\theta }_{2}\right)\mathrm{l}\mathrm{n}\frac{\rho }{{\rho }_{0}}\\ \mathrm{l}\mathrm{n}\frac{\mathrm{E}\mathrm{I}\left({\theta }_{3}\right)}{{A}_{0}}=a\left({\theta }_{3}\right)\mathrm{l}\mathrm{n}\frac{M}{{M}_{0}}+b\left({\theta }_{3}\right)\mathrm{l}\mathrm{n}\frac{\nu }{{\nu }_{0}}+c\left({\theta }_{3}\right)\mathrm{l}\mathrm{n}\frac{\rho }{{\rho }_{0}}\end{array}\right. $ | (7) |
方程组(7)表达成矩阵的形式为
| $ \left[\begin{array}{ccc}\frac{1}{2}\mathrm{s}\mathrm{e}{\mathrm{c}}^{2}{\theta }_{1}-4{\gamma }^{2}\mathrm{s}\mathrm{i}{\mathrm{n}}^{2}{\theta }_{1}& \frac{1}{3}(12{\gamma }^{2}-16{\gamma }^{4})\mathrm{s}\mathrm{i}{\mathrm{n}}^{2}{\theta }_{1}& 1-\frac{1}{2}\mathrm{s}\mathrm{e}{\mathrm{c}}^{2}{\theta }_{1}\\ \frac{1}{2}\mathrm{s}\mathrm{e}{\mathrm{c}}^{2}{\theta }_{2}-4{\gamma }^{2}\mathrm{s}\mathrm{i}{\mathrm{n}}^{2}{\theta }_{2}& \frac{1}{3}(12{\gamma }^{2}-16{\gamma }^{4})\mathrm{s}\mathrm{i}{\mathrm{n}}^{2}{\theta }_{2}& 1-\frac{1}{2}\mathrm{s}\mathrm{e}{\mathrm{c}}^{2}{\theta }_{2}\\ \frac{1}{2}\mathrm{s}\mathrm{e}{\mathrm{c}}^{2}{\theta }_{3}-4{\gamma }^{2}\mathrm{s}\mathrm{i}{\mathrm{n}}^{2}{\theta }_{3}& \frac{1}{3}(12{\gamma }^{2}-16{\gamma }^{4})\mathrm{s}\mathrm{i}{\mathrm{n}}^{2}{\theta }_{3}& 1-\frac{1}{2}\mathrm{s}\mathrm{e}{\mathrm{c}}^{2}{\theta }_{3}\end{array}\right]\left[\begin{array}{c}\mathrm{l}\mathrm{n}\frac{M}{{M}_{0}}\\ \mathrm{l}\mathrm{n}\frac{\nu }{{\nu }_{0}}\\ \mathrm{l}\mathrm{n}\frac{\rho }{{\rho }_{0}}\end{array}\right]=\left[\begin{array}{c}\mathrm{l}\mathrm{n}\frac{\mathrm{E}\mathrm{I}\left({\theta }_{1}\right)}{{A}_{0}}\\ \mathrm{l}\mathrm{n}\frac{\mathrm{E}\mathrm{I}\left({\theta }_{2}\right)}{{A}_{0}}\\ \mathrm{l}\mathrm{n}\frac{\mathrm{E}\mathrm{I}\left({\theta }_{3}\right)}{{A}_{0}}\end{array}\right] $ | (8) |
式(8)是一个线性方程组,只需知道三个相互独立的弹性阻抗数据体,用常规的求解方法便可以求得M、
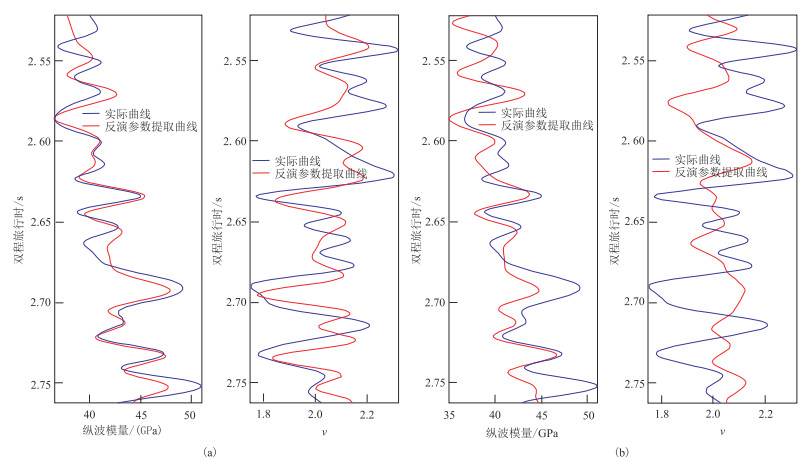
图 8为纵波模量直接提取与间接提取的反演结果对比,可以发现直接提取的反演结果误差更小、更加准确。
|
图 8 不同参数直接提取(a)与间接提取(b)反演结果对比 |
| $\begin{align} R\left(\theta \right)&\approx \left(\frac{1}{2}\mathrm{s}\mathrm{e}{\mathrm{c}}^{2}\theta -4{\gamma }^{2}\mathrm{s}\mathrm{i}{\mathrm{n}}^{2}\theta \right)\frac{\mathrm{\Delta }{I}_{\mathrm{P}}}{\overline{I_\mathrm{P}}}+\\&4{\gamma }^{2}\mathrm{s}\mathrm{i}{\mathrm{n}}^{2}\theta \frac{\mathrm{\Delta }\tau }{\overline{\tau }}+\left(2{\gamma }^{2}\mathrm{s}\mathrm{i}{\mathrm{n}}^{2}\theta -\frac{1}{2}\mathrm{t}\mathrm{a}{\mathrm{n}}^{2}\theta \right)\frac{\mathrm{\Delta }\rho }{\overline{\rho }} \end{align} $ | (9) |
式中:
MCMC算法通过构建一条乃至若干条平稳分布与后验概率分布特征相同的马尔科夫链以实现对贝叶斯公式的求解。根据贝叶斯定理,后验概率分布正比于先验分布与似然函数的乘积。因此,首先利用测井数据建立不同类型“甜点”的
| $ P\left(\boldsymbol{m}\right)~\underset{}{\sum\limits _{k=1}^{h}{\lambda }_{k}\mathrm{N}\left(\boldsymbol{m};{\overline{\boldsymbol{m}}}_{k}, {\sigma }_{{\boldsymbol{m}}_{k}}^{2}\right)} $ | (10) |
式中:
对于似然函数
| $ \begin{array}{l}p\left(\boldsymbol{d}\left|\boldsymbol{m}\right.\right)=\frac{1}{(2\mathrm{\pi }{\sigma }_{\mathrm{n}}^{2}{)}^{\frac{G}{2}}}\times \\ \mathrm{e}\mathrm{x}\mathrm{p}\left\{-\sum \frac{[\boldsymbol{d}-f{\left(\boldsymbol{m}\right)]}^{\begin{array}{l}2\\ \end{array}}}{2{\sigma }_{\mathrm{n}}^{2}}-\sum \frac{[\boldsymbol{d}-f{\left(\boldsymbol{m}\right)]}^{\begin{array}{l}2\\ \end{array}}}{2{\sigma }_{\mathrm{n}}^{2}}\right\}\end{array} $ | (11) |
式中:
| $ p\left(\boldsymbol{m}\left|\boldsymbol{d}\right.\right)\hspace{0.33em}\propto \underset{k=1}{\sum\limits _{}^{h}}\left\{\frac{{\lambda }_{k}}{(2\mathrm{\pi }{\sigma }_{{\boldsymbol{m}}_{k}}^{2}{)}^{\frac{{G}_{k}}{2}}}\mathrm{e}\mathrm{x}\mathrm{p}\left[-\frac{({\boldsymbol{m}}_{k}-{\overline{\boldsymbol{m}}}_{k}{)}^{\begin{array}{l}2\\ \end{array}}}{2{\sigma }_{{\boldsymbol{m}}_{k}}^{2}}\right.-\\ \left.\frac{({\boldsymbol{m}}_{k}-{\overline{\boldsymbol{m}}}_{k}{)}^{\begin{array}{l}2\\ \end{array}}}{2{\sigma }_{{\boldsymbol{m}}_{k}}^{2}}\right]\right\}\times \frac{1}{(2\mathrm{\pi }{\sigma }_{\mathrm{n}}^{2}{)}^{\frac{G}{2}}}\mathrm{e}\mathrm{x}\mathrm{p}\left\{-\sum\limits _{}^{}\frac{[\boldsymbol{d}-f{\left(\boldsymbol{m}\right)]}^{\begin{array}{l}2\\ \end{array}}}{2{\sigma }_{\mathrm{n}}^{2}}\right\} $ | (12) |
式中
| $ \begin{array}{l}J\left(\boldsymbol{m}\right)=-\sum \frac{[\boldsymbol{d}-f{\left(\boldsymbol{m}\right)]}^{\begin{array}{l}2\\ \end{array}}}{2{\sigma }_{\mathrm{n}}^{2}}-\\ \;\;\;\;\mathrm{l}\mathrm{n}\underset{k=1}{\sum\limits _{}^{h}}\left\{\frac{{\lambda }_{k}}{(2\mathrm{\pi }{\sigma }_{{\boldsymbol{m}}_{k}}^{2}{)}^{\frac{{G}_{k}}{2}}}\mathrm{e}\mathrm{x}\mathrm{p}[-\frac{({\boldsymbol{m}}_{k}-{\overline{\boldsymbol{m}}}_{k}{)}^{\begin{array}{l}2\\ \end{array}}}{2{\sigma }_{{\boldsymbol{m}}_{k}}^{2}}]\right\}\end{array} $ | (13) |
在反演过程中,针对反演参数值,可利用以下概率公式进行反演值的优选,即
| $ \alpha ({\boldsymbol{m}}^{\boldsymbol{\text{'}}}, {\boldsymbol{m}}^{\boldsymbol{*}})=\mathrm{m}\mathrm{i}\mathrm{n}\left[1, \frac{\pi \left({\boldsymbol{m}}^{\boldsymbol{*}}\right)}{\pi \left({\boldsymbol{m}}^{\text{'}}\right)}\right] $ | (14) |
式中:
将式(11)代入式(14)并简化常数项,即可得到接受概率表达式
| $\begin{array}{l} \alpha \left({\boldsymbol{m}}^{\boldsymbol{*}}, {\boldsymbol{m}}^{\boldsymbol{\text{'}}}\right)=\\ \left\{\begin{array}{l}1 \;\;\;\;\;\;\;\;\;\;\;\;\;\;\;\;\;\;\;\;\;\;\;\;\;\;\;\;\;\;\;\;\;\;\;\;\;\;\left({\boldsymbol{m}}^{\boldsymbol{*}}\right)-J\left({\boldsymbol{m}}^{\text{'}}\right)\ge 0\\ \mathrm{e}\mathrm{x}\mathrm{p}\left[J\right({\boldsymbol{m}}^{\boldsymbol{*}})-J({\boldsymbol{m}}^{\boldsymbol{\text{'}}}\left)\right]\hspace{0.33em}\hspace{0.33em}\;\;\;J\left({\boldsymbol{m}}^{\boldsymbol{*}}\right)-J\left({\boldsymbol{m}}^{\boldsymbol{\text{'}}}\right) < 0\end{array}\right. \end{array}$ | (15) |
考虑到反演参数之间存在一定的相关性,在采样过程中,不再对反演参数的全局概率分布采样,而是在联合分布约束下的条件概率分布中采样,以此缩小解空间,即
| $ \begin{array}{l}P\left(\frac{{{\tilde{V}}_{\mathrm{P}}}^{\boldsymbol{*}}}{{{\tilde{V}}_{\mathrm{S}}}^{\boldsymbol{*}}}\left|{I}_{\mathrm{P}}={{I}_{\mathrm{P}}}^{*}\right.\right)\\ \;\;\;\;\;\;=P\left[\frac{{{\tilde{V}}_{\mathrm{P}}}^{\boldsymbol{*}}}{{{\tilde{V}}_{\mathrm{S}}}^{\boldsymbol{*}}}\left|\left({{I}_{\mathrm{P}}}^{*}-{\psi }_{\mathrm{P}}\right)\right. < {I}_{\mathrm{P}} < \left({{I}_{\mathrm{P}}}^{*}+{\psi }_{\mathrm{P}}\right)\right]\end{array} $ | (16) |
式中:
利用“甜点”敏感参数在不同“甜点”类型(或非“甜点”)的分布特征,估算不同类型“甜点”概率。假设其在Ⅱ类“甜点”的条件概率服从高斯分布,则Ⅱ类“甜点”概率可以表示为
| $\begin{align} p\left({\rm I}={T}_{2}\left|{I}_{\mathrm{P}}\right., \frac{{\tilde{V}}_{\mathrm{P}}}{{\tilde{V}}_{\mathrm{S}}}\right)=&\left[1-\frac{p\left(I={T}_{1}\left|{I}_{P}\right.\right)}{\underset{}{\sum\limits _{k=1}^{h}p\left(I={T}_{1}\left|{I}_{\mathrm{P}}\right.\right)}}\right]\times \\& \frac{p\left(I={T}_{2}\left|\frac{{\tilde{V}}_{\mathrm{P}}}{{\tilde{V}}_{\mathrm{S}}}\right.\right)}{\underset{}{\sum\limits _{k=1}^{h}p\left(I={T}_{2}\left|\frac{{\tilde{V}}_{\mathrm{P}}}{{\tilde{V}}_{\mathrm{S}}}\right.\right)}} \end{align} $ | (17) |
式中:
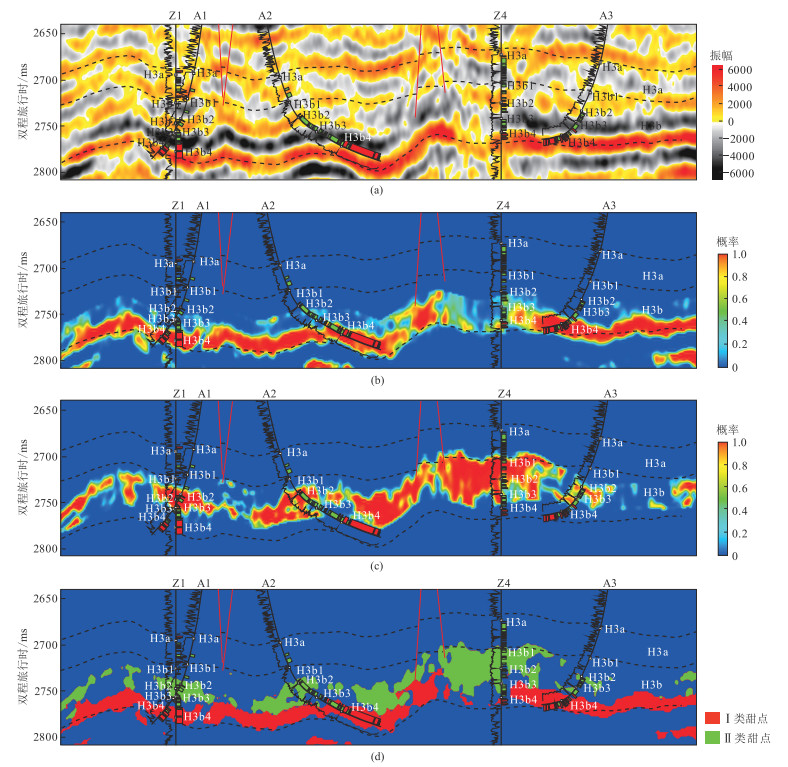
在Ⅰ类“甜点”和Ⅱ类“甜点”分布特征预测的基础上,采用FFP技术,定义各类“甜点”的概率密度函数(PDFs);然后对反演结果的每一样本点应用贝叶斯模糊判别分析(Bayesian Inference)计算各种“甜点”类型的空间分布概率(图 9b、图 9c),最后叠加就可以形成各类“甜点”的概率体(图 9d)。
|
图 9 过开发井剖面 (a)常规地震剖面;(b)Ⅰ类“甜点”概率剖面;(c)Ⅱ类“甜点”概率剖面;(d)“甜点”岩相剖面。 井旁黑线为GR,红色、绿色块分别为Ⅰ类和Ⅱ类“甜点”。 |
应用本文方法预测H3b“甜点”分布特征(图 9), 发现Ⅰ类“甜点”主要分布在中下部(H3b3、H3b4小层),Ⅱ类“甜点”主要分布中部(H3b2小层)。
钻井资料揭示:“甜点”垂向分布主要受控于沉积环境,H3b早期以高能辫状水道沉积为主,在单期水道中部的中—粗砂岩发育Ⅰ类“甜点”;H3b中晚期以中低能水道沉积为主,Ⅱ类“甜点”主要发育在单期水道下部的中粗砂岩,少量发育在水道中部的中细砂岩。
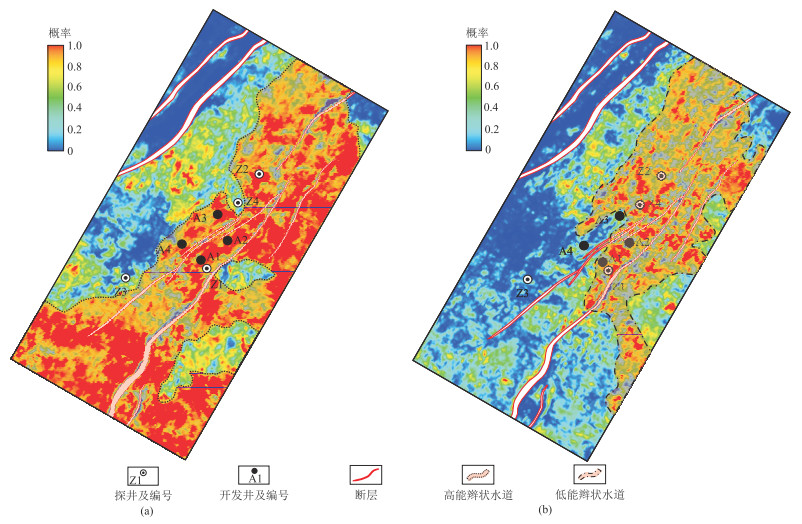
由图 10可见,Ⅰ类“甜点”主要分布在研究区中南部和西南部,多发育在高能辫状水道中;Ⅱ类“甜点”主要从东北方向沿着南部方向广泛分布,主要发育在中低能辫状水道中。据此,设计、部署井位11口,目前已完钻4口(A1~A4井)。新钻井结果表明本文研究预测的“甜点”是可靠的, Ⅰ类“甜点”厚度吻合率高达80%以上,Ⅱ类达70%以上(表 3)。该成果指导了气田井位的部署,实现了高效开发。
|
图 10 研究区Ⅰ类(a)和Ⅱ类(b)“甜点”平面展布特征 |
|
|
表 3 预测“甜点”厚度吻合率 |
(1) 针对东海厚层低渗气藏不同类型“甜点”,采用不同地球物理预测方法,即:Ⅰ类“甜点”采用纵波模量直接反演;Ⅱ类“甜点”采用拟纵横波速度比反演。
(2) 本文方法“甜点”预测厚度结果准确率高,Ⅰ类“甜点”吻合率达80%以上,Ⅱ类“甜点”吻合率70%以上。该方法可对其他类似低渗气藏的勘探具有参考价值。
| [1] |
张国华. 西湖凹陷高压形成机制及其对油气成藏的影响[J]. 中国海上油气, 2013, 25(2): 1-8. ZHANG Guohua. Origin mechanism of high formation pressure and its influence on hydrocarbon accumulation in Xihu sag[J]. China Offshore Oil and Gas, 2013, 25(2): 1-8. |
| [2] |
叶加仁, 刘金水, 徐陈杰, 等. 东海盆地西湖凹陷西次凹天然气资源分级评价[J]. 地质科技通报, 2020, 39(3): 1-9. YE Jiaren, LIU Jinshui, XU Chenjie, et al. Grading evaluation of natural gas resources in the western sub-sag of Xihu Depression, East China Sea Basin[J]. Bulletin of Geological Science and Technology, 2020, 39(3): 1-9. |
| [3] |
张少龙, 闫建平, 郭伟, 等. 基于岩石物理相的深层页岩气地质—工程甜点参数测井评价方法——以四川盆地LZ区块五峰组—龙马溪组为例[J]. 石油地球物理勘探, 2023, 58(1): 214-227. ZHANG Shaolong, YAN Jianping, GUO Wei, et al. Logging evaluation method of geological-engineering sweet spot parameters for deep shale gas based on petrophysical facies: a case study of the Wufeng-Longmaxi Formation in LZ block of Sichuan Basin[J]. Oil Geophysical Prospecting, 2023, 58(1): 214-227. |
| [4] |
陈国文, 覃素华, 刘雷颂, 等. 辽河坳陷大民屯凹陷沙四段页岩油"甜点" 预测及评价[J]. 石油地球物理勘探, 2022, 57(增刊1): 145-153. CHEN Guowen, QIN Suhua, LIU Leisong, et al. Prediction and evaluation of sweet spots for shale oil in Es4 of Damintun Sag, Liaohe Depression[J]. Oil Geophysical Prospecting, 2022, 57(S1): 145-153. |
| [5] |
霍丽娜, 徐礼贵, 邵林海, 等. 煤层气"甜点区" 地震预测技术及其应用[J]. 天然气工业, 2014, 34(8): 46-52. HUO Lina, XU Ligui, SHAO Linhai, et al. Seismic prediction technologies of CBM sweet spots and their application[J]. Natural Gas Industry, 2014, 34(8): 46-52. |
| [6] |
李岳桐, 卢宗盛, 吴振东, 等. 沧东凹陷孔二段细粒沉积岩致密油甜点预测[J]. 石油地球物理勘探, 2018, 53(5): 1059-1066. LI Yuetong, LU Zongsheng, WU Zhendong, et al. Sweet spot prediction for fine-grain sediment reservoirs in the Cangdong Sag[J]. Oil Geophysical Prospecting, 2018, 53(5): 1059-1066. |
| [7] |
李国斌, 张亚军, 谢天峰, 等. 煤系地层致密砂岩气甜点区地震逐级预测——以鄂尔多斯盆地东南缘下二叠统山西组2~3亚段为例[J]. 天然气工业, 2020, 40(5): 34-42. LI Guobin, ZHANG Yajun, XIE Tianfeng, et al. Seismic stepped prediction technology for tight sandstone gas sweet spot in coal measure strata: a case study of the Submember 2~3 of the Lower Permian Shanxi Formation along the southeastern margin of the Ordos Basin[J]. Natural Gas Industry, 2020, 40(5): 34-42. |
| [8] |
郭贵安, 关旭, 肖富森, 等. 四川盆地中部侏罗系沙溪庙组致密砂岩气藏地震一体化描述技术[J]. 天然气工业, 2022, 42(1): 40-50. GUO Guian, GUAN Xu, XIAO Fusen, et al. Integrated seismic description technology for tight sandstone gas reservoir of Jurassic Shaximiao Formation in the central Sichuan Basin[J]. Natural Gas Industry, 2022, 42(1): 40-50. |
| [9] |
赵爽, 高倩, 谯述容. 川西DY地区三叠系须家河组二段地震相分析与沉积相预测[J]. 石油地球物理勘探, 2009, 44(3): 341-346. ZHAO Shuang, GAO Qian, QIAO Shurong. Analysis on Triassic Xujiahe stage second segment (Tx2) seismic facies and prediction of sedimentary facies in Chuanxi DY Area[J]. Oil Geophysical Prospecting, 2009, 44(3): 341-346. |
| [10] |
何晓菊, 郭亚斌. 鄂尔多斯盆地苏里格庙地区上古生界砂岩储层预测技术和效果[J]. 石油地球物理勘探, 2002, 37(增刊1): 9-13. HE Xiaoju, GUO Yabin. Prediction of Upper Paleozoic sandstone reservoir in Suligemiao area, Ordos Basin[J]. Oil Geophysical Prospecting, 2002, 37(S1): 9-13. |
| [11] |
杨海军, 李勇, 唐雁刚, 等. 塔里木盆地克深气田成藏条件及勘探开发关键技术[J]. 石油学报, 2021, 42(3): 399-414. YANG Haijun, LI Yong, TANG Yangang, et al. Accumulation conditions, key exploration and development technologies for Keshen gas field in Tarim Basin[J]. Acta Petrolei Sinica, 2021, 42(3): 399-414. |
| [12] |
付宁海, 唐海发, 刘群明. 低渗―致密砂岩气藏开发中后期精细调整技术[J]. 西南石油大学学报(自然科学版), 2018, 40(3): 136-145. FU Ninghai, TANG Haifa, LIU Qunming. Technologies for fine adjustment in the middle-later development stage of low permeability tight sandstone gas reservoirs[J]. Journal of Southwest Petroleum University (Science & Technology Edition), 2018, 40(3): 136-145. |
| [13] |
刘勇, 徐国盛, 曾兵, 等. 东海盆地西湖凹陷花港组储层孔隙演化与油气充注关系[J]. 石油实验地质, 2018, 40(2): 168-176. LIU Yong, XU Guosheng, ZENG Bing, et al. Relationship between porosity evolution and hydrocarbon charging in tight sandstone reservoirs in Oligocene Huagang Formation, Xihu Sag, East China Sea Basin[J]. Petroleum Geology and Experiment, 2018, 40(2): 168-176. |
| [14] |
徐国盛, 崔恒远, 刘勇, 等. 东海盆地西湖凹陷古近系花港组砂岩储层致密化与油气充注关系[J]. 地质科技通报, 2020, 39(3): 20-29. XU Guosheng, CUI Hengyuan, LIU Yong, et al. Relationship between sandstone reservoirs densification and hydrocarbon charging in the Paleogene Huagang Formation of Xihu Depression, East China Sea Basin[J]. Bulletin of Geological Science and Technology, 2020, 39(3): 20-29. |
| [15] |
张武, 蒋一鸣, 肖晓光, 等. 东海陆架盆地西湖凹陷中北部花港组储层致密化过程分析[J]. 石油实验地质, 2021, 43(1): 86-95. ZHANG Wu, JIANG Yiming, XIAO Xiaoguang, et al. Densification process of Huagang Formation in northern and central Xihu Sag of East China Sea Shelf Basin[J]. Petroleum Geology and Experiment, 2021, 43(1): 86-95. |
| [16] |
林承焰, 孙小龙, 马存飞, 等. 西湖凹陷中央反转构造带花港组储层物性演化[J]. 中国矿业大学学报, 2017, 46(4): 820-829. LIN Chengyan, SUN Xiaolong, MA Cunfei, et al. Physical property evolution of Huagang formation in central inversion tectonic belt in Xihu Depression[J]. Journal of China University of Mining & Technology, 2017, 46(4): 820-829. |
| [17] |
赵仲祥, 董春梅, 林承焰, 等. 西湖凹陷深层低渗―致密气藏"甜点" 类型划分及成因探讨[J]. 石油与天然气地质, 2018, 39(4): 778-790. ZHAO Zhongxiang, DONG Chunmei, LIN Chengyan, et al. Classification and origin of "sweet spots" in deep low permeability tight gas reservoirs, Xihu Sag, East China Sea Shelf Basin[J]. Oil & Gas Geology, 2018, 39(4): 778-790. |
| [18] |
张武, 侯国伟, 肖晓光, 等. 西湖凹陷低渗储层成因及优质储层主控因素[J]. 中国海上油气, 2019, 31(3): 40-49. ZHANG Wu, HOU Guowei, XIAO Xiaoguang, et al. Genesis of low permeability reservoirs and main controlling factors of high quality reservoirs in Xihu Sag, East China Sea Basin[J]. China Offshore Oil and Gas, 2019, 31(3): 40-49. |
| [19] |
王猛, 刘志杰, 杨玉卿, 等. 西湖凹陷花港组储层综合分类方法探讨[J]. 现代地质, 2020, 34(6): 1214-1220. WANG Meng, LIU Zhijie, YANG Yuqing, et al. Comprehensive classification scheme of Huagang reservoir in Xihu Depression[J]. Geoscience, 2020, 34(6): 1214-1220. |
| [20] |
李久娣, 孙莉, 魏水建, 等. 东海海域深层HG组低渗储层"甜点" 预测方法及应用[J]. 石油物探, 2019, 58(5): 758-765. LI Jiudi, SUN Li, WEI Shuijian, et al. "sweet spot"prediction and its application in the low permeability reservoir of the deep HG formation in the East China Sea[J]. Geophysical Prospecting for Petroleum, 2019, 58(5): 758-765. |
| [21] |
李久娣. 东海西湖N区块致密砂岩气藏甜点预测研究[J]. 石油物探, 2019, 58(3): 444-452. LI Jiudi. "Sweet Spot" prediction of a tight sandstone gas reservoir in the N Block in Xihu Sag, China[J]. Geophysical Prospecting for Petroleum, 2019, 58(3): 444-452. |
| [22] |
娄敏, 蔡华, 何贤科, 等. 地震沉积学在东海陆架盆地西湖凹陷河流―三角洲相储集层刻画中的应用[J]. 石油勘探与开发, 2023, 50(1): 125-138. LOU Min, CAI Hua, HE Xianke, et al. Application of seismic sedimentology in characterization of fluvial-deltaic reservoirs in Xihu Sag, East China Sea Shelf Basin[J]. Petroleum Exploration and Development, 2023, 50(1): 125-138. |
| [23] |
毛云新, 娄敏. 河流相储层刻画与垂向非均质性分析——以西湖凹陷C油田柳浪组为例[J]. 东北石油大学学报, 2021, 45(5): 51-62. MAO Yunxin, LOU Min. Fluvial reservoir characterization and vertical heterogeneity analysis: taking Liulang Formation of C Oilfield in Xihu Depression as example[J]. Journal of Northeast Petroleum University, 2021, 45(5): 51-62. |
| [24] |
娄敏, 刘江, 涂齐催, 等. 河流—三角洲相不同厚度储层的地震沉积学研究[J]. 地球物理学进展, 2021, 36(5): 2191-2203. LOU Min, LIU Jiang, TU Qicui, et al. Application of seismic sedimentology to the prediction of fluvial-delta facies reservoirs with different thickness[J]. Progress in Geophysics, 2021, 36(5): 2191-2203. |
| [25] |
WANG W, LIN C, ZHANG X, et al. Provenance, clastic composition and their impact on diagenesis: a case study of the Oligocene sandstone in the Xihu Sag, East China Sea Basin[J]. Marine and Petroleum Geology, 2021, 126: 104890. |
| [26] |
ZENG F, DONG C, LIN C, et al. Pore structure characteristics of reservoirs of Xihu Sag in East China Sea Shelf Basin based on dual resolution X-ray computed tomography and their influence on permeability[J]. Energy, 2022, 239(Part D): 122386. |
| [27] |
ZHAO Z, DONG C, ZHANG X, et al. Reservoir controlling factors of the Paleogene Oligocene Huagang Formation in the north central part of the Xihu Depression, East China Sea Basin, China[J]. Journal of Petroleum Science and Engineering, 2019, 175: 159-172. |
| [28] |
ZENG F, DONG C, LIN C, et al. Analyzing the effects of multi-scale pore systems on reservoir Properties: a case study on Xihu Depression, East China Sea Shelf Basin, China[J]. Journal of Petroleum Science and Engineering, 2021, 203: 108609. |
| [29] |
WANG W, LIN C, ZHANG X, et al. Seismic diagenetic facies prediction of tight sandstone in the offshore sparse well area: an example from the Xihu Depression of the East China Sea Basin[J]. Journal of Petroleum Science and Engineering, 2022, 216: 110825. |
| [30] |
WANG W, LIN C, ZHANG X, et al. Effect of burial history on diagenetic and reservoir-forming process of the Oligocene sandstone in Xihu sag, East China Sea Basin[J]. Marine and Petroleum Geology, 2020, 112: 104034. |


 娄敏,上海市长宁区通协陆388号中海油大厦中海石油(中国)有限公司上海分公司,200335。Email: