页岩气作为一种清洁的非常规天然气,已成为中国天然气勘探开发领域的一个热点[1-2]。为了提高页岩气井的产能,目前主要采用水平井与分段体积压裂相结合的增产措施[3]。然而,页岩气井在水平压裂投产后普遍面临产出剖面未知、裂缝贡献不清、有效裂缝参数不明等问题,使压裂改造措施的准确性、有效性和合理性等难以得到保证,极大地影响了页岩气藏的开发效益[4]。如何定量评价页岩气水平井产出剖面、每一条有效人工裂缝的产量贡献及特征参数,是解决上述难题的关键。
近年来,分布式光纤温度传感(Distributed Temperature Sensing,DTS)技术用于页岩气水平井动态监测[5-7]。目前已有学者通过建立理论模型反演DTS监测数据,实现了水平井产出剖面及井下未知参数的定量评价[8-11]。Nowak[12]最早根据温度测量结果描述井筒流量的分布,提出了一种根据温度测井曲线估算注入剖面的方法。Yoshioka等[13-14]基于莱文伯格—马夸特算法(简称L-M算法)定量解释了水平井产出剖面,但基于梯度的L-M算法易使反演计算陷入局部最优而无法获得全局最优解。Li等[15]基于马尔可夫链—蒙特卡洛(MCMC)算法建立了反演模型,通过DTS数据反演获得了水平井产液剖面,但MCMC算法是一种随机抽样算法,计算效率较低。朱世琰[5]、蔡珺君[7]、Cai等[16]也分别采用L-M算法和MCMC算法解释油藏水平井的产出剖面,但解释结果的准确性有待提高。Zhang等[17]以Cui等[18]的水平井温度模型为基础,采用L-M算法建立了单相压裂水平井温度数据反演模型,预测了一口压裂水平井的产气剖面;同时指出,若想获得可收敛的反演解,仅只能对单一目标参数(如裂缝半长)进行反演,其他参数(如导流能力、储层渗透率分布等)均须为已知条件。Luo等[19-20]、罗红文等[21]也分别基于L-M和MCMC算法建立了低渗气藏压裂水平井温度数据反演模型,但通过现场实测DTS数据的反演,发现当裂缝较多时,两种反演算法的计算效率都有待提高。为此,罗红文等[22]还采用模拟退火算法(简称SA算法)建立了更为高效的反演模型,假设仅以裂缝半长作为未知参数,完成了一口低渗气藏水平井的产出剖面定量解释。
综上所述,目前国内外对于水平井温度剖面数据的反演主要基于L-M和MCMC两种算法。页岩气水平井温度剖面受人工裂缝特征参数、改造区缝网渗透率分布等诸多因素的交互影响[17, 23-25],而人工裂缝参数(人工主裂缝长度、导流能力等)、缝网渗透率分布等通常又都是未知的[26],因此在页岩气水平井DTS数据反演时,从本质上讲,待反演的未知参数是一个m×n维(m为待反演目标参数个数,n为每个待反演目标参数的维数)的矩阵变量。常规的L-M和MCMC算法难以基于DTS数据实现页岩气水平井m×n维未知参量的自适应反演,因此页岩气水平井产出剖面和人工裂缝中的参数定量解释是一项技术难题。
针对多参数自适应反演问题,Wu等[27]采用粒子群优化(Particle Swarm Optimization,PSO)算法对地震资料进行反演,同时获得了纵波速度、横波速度和密度等3个反映地下油气饱和度的关键弹性参数。马海等[28]将PSO方法应用于测井资料,反演结果准确性较高。由此可见,PSO算法具有解决基于评价目标的多自变量优化问题的潜力。
鉴于此,本文采用PSO算法建立页岩气水平井DTS数据反演模型,实现基于DTS数据的页岩气水平井m×n维未知参数的自适应反演,从而实现页岩气水平井产出剖面、有效人工裂缝半长、导流能力以及改造区缝网渗透率分布的定量解释,以期为页岩气水平井精准压裂的实现和生产优化提供依据。
1 方法原理实现页岩气水平井DTS数据反演,需分别建立温度剖面正演预测模型、基于温度的拟合评价目标(误差)函数和基于PSO算法的反演模型。
在反演、迭代过程中,温度剖面正演预测模型用于模拟温度剖面,而DTS数据反演模型用于更新人工裂缝参数、渗透率分布等未知参数,使预测的温度剖面向实测DTS数据逐渐靠近,直至反演结果收敛。
1.1 页岩气水平井温度剖面正演预测模型考虑到页岩储层的渗流和传热特性,将已建立的一套气藏压裂水平井温度剖面预测模型[29]作为基础模型,并做如下补充说明:①压裂改造后的页岩储层形成由基质—次生缝—人工主裂缝组成的高渗缝网区,未改造区为均匀低渗基质;②压裂段内存在一条或多条人工主裂缝,人工主裂缝为平板状且垂直于水平井筒,储层流体仅能通过人工裂缝流入水平井筒。
为表征页岩储层压裂改造区的高渗透性,采用改造区缝网综合渗透率模型[30],即
| $ {K}_{\mathrm{n}\mathrm{e}\mathrm{t}}=\frac{W}{W+X}{K}_{\mathrm{f}\mathrm{h}}+\frac{W}{W+X}{K}_{\mathrm{f}\mathrm{v}} $ | (1) |
式中:W为裂缝宽度;X为裂缝间距;
根据式(1)可建立改造区缝网综合热导率模型以表征压裂改造区储层的传热速率,即
| $ {K}_{\mathrm{T}\mathrm{n}\mathrm{e}\mathrm{t}}=\frac{W}{W+X}{K}_{\mathrm{T}\mathrm{f}\mathrm{h}}+\frac{W}{W+X}{K}_{\mathrm{T}\mathrm{f}\mathrm{v}} $ | (2) |
式中
将已建立的气藏水平井温度剖面预测模型[29]作为基础模型,联立式(1)、式(2),共同构建页岩气水平井温度剖面预测模型,用以在DTS数据反演的每一步迭代过程中,模拟页岩气水平井温度剖面。
1.2 页岩气水平井DTS数据反演方法DTS数据反演方法主要由拟合评价目标函数和反演模型两部分组成。拟合评价目标函数又称为误差函数,用于表征模拟计算的温度剖面与实测DTS数据之间的误差;而反演模型则是用于优化每一步迭代计算过程中的产出剖面、裂缝参数等未知参量,进而逐渐减小模拟计算的温度剖面与实测DTS数据之间的误差,直至收敛。
1.2.1 基于温度的拟合评价目标函数基于温度的拟合评价目标函数为
| $ \varGamma \left({\left[{\boldsymbol{x}}_{\mathrm{i}\mathrm{n}\mathrm{v}\mathrm{e}\mathrm{r}}\right]}_{m\times n}\right)=\left(\overline{{\boldsymbol{T}}_{\mathrm{i}\mathrm{n}\mathrm{v}\mathrm{e}\mathrm{r}}}-\overline{{\boldsymbol{T}}_{\mathrm{o}\mathrm{b}\mathrm{s}}}\right){\left(\overline{{\boldsymbol{T}}_{\mathrm{i}\mathrm{n}\mathrm{v}\mathrm{e}\mathrm{r}}}-\overline{{\boldsymbol{T}}_{\mathrm{o}\mathrm{b}\mathrm{s}}}\right)}^{\mathrm{T}} $ | (3) |
式中:
从式(3)可以看出,页岩气水平井DTS数据反演的实质就是通过迭代更新未知的待反演目标参数
| $ \varGamma \left({\left[{\boldsymbol{x}}_{\mathrm{i}\mathrm{n}\mathrm{v}\mathrm{e}\mathrm{r}}\right]}_{m\times n}\right) < {\varepsilon }_{} $ | (4) |
式中
本文采用PSO算法[31]实现DTS数据自适应反演,以定量预测页岩气水平井m×n维的待反演目标参数(包括每一条有效人工裂缝的特征参数、对应的缝网渗透率分布及产量贡献)。
PSO算法原理:设在m×n维的可行解空间里,存在粒子种群P,P中存在I个随机分布的粒子,每个粒子都有自己的初始移动速度和初始位置,种群中的粒子迭代寻优
| $ {\boldsymbol{x}}_{i}^{\left(t\right)}=\left[\begin{array}{l}{x}_{i, \mathrm{1, 1}}^{\left(t\right)}& {x}_{i, \mathrm{1, 2}}^{\left(t\right)}& \cdots & {x}_{i, 1, m}^{\left(t\right)}\\ {x}_{i, \mathrm{2, 1}}^{\left(t\right)}& {x}_{i, \mathrm{2, 2}}^{\left(t\right)}& \cdots & {x}_{i, 2, m}^{\left(t\right)}\\ & & ⋮& \\ {x}_{i, n, 1}^{\left(t\right)}& {x}_{i, n, 2}^{\left(t\right)}& \cdots & {x}_{i, n, m}^{\left(t\right)}\end{array}\right] $ | (5) |
第i个粒子在第t次迭代中的速度设为一个m×n维的矩阵,即
| $ {\boldsymbol{v}}_{i}^{\left(t\right)}=\left[\begin{array}{l}{v}_{i, \mathrm{1, 1}}^{\left(t\right)}& {v}_{i, \mathrm{1, 2}}^{\left(t\right)}& \cdots & {v}_{i, 1, m}^{\left(t\right)}\\ {v}_{i, \mathrm{2, 1}}^{\left(t\right)}& {v}_{i, \mathrm{2, 2}}^{\left(t\right)}& \cdots & {v}_{i, 2, m}^{\left(t\right)}\\ & & ⋮& \\ {v}_{i, n, 1}^{\left(t\right)}& {v}_{i, n, 2}^{\left(t\right)}& \cdots & {v}_{i, n, m}^{\left(t\right)}\end{array}\right] $ | (6) |
第i个粒子在第t次迭代中找到的最优解设为一个m×n维的矩阵,即个体极值为
| $ {\bf{pbest}}_{i}^{\left(t\right)}=\left[\begin{array}{l}\mathrm{p}\mathrm{b}\mathrm{e}\mathrm{s}{\mathrm{t}}_{i, \mathrm{1, 1}}^{\left(t\right)} & \mathrm{p}\mathrm{b}\mathrm{e}\mathrm{s}{\mathrm{t}}_{i, \mathrm{1, 2}}^{\left(t\right)}& \cdots & \mathrm{p}\mathrm{b}\mathrm{e}\mathrm{s}{\mathrm{t}}_{i, 1, m}^{\left(t\right)}\\ \mathrm{p}\mathrm{b}\mathrm{e}\mathrm{s}{\mathrm{t}}_{i, \mathrm{2, 1}}^{\left(t\right)}& \mathrm{p}\mathrm{b}\mathrm{e}\mathrm{s}{\mathrm{t}}_{i, \mathrm{2, 2}}^{\left(t\right)}& \cdots & \mathrm{p}\mathrm{b}\mathrm{e}\mathrm{s}{\mathrm{t}}_{i, 2, m}^{\left(t\right)}\\& & ⋮& \\ \mathrm{p}\mathrm{b}\mathrm{e}\mathrm{s}{\mathrm{t}}_{i, n, 1}^{\left(t\right)}& \mathrm{p}\mathrm{b}\mathrm{e}\mathrm{s}{\mathrm{t}}_{i, n, 2}^{\left(t\right)}& \cdots & \mathrm{p}\mathrm{b}\mathrm{e}\mathrm{s}{\mathrm{t}}_{i, n, m}^{\left(t\right)}\end{array}\right] $ | (7) |
粒子种群P在第t次迭代中找到的最优解设为一个m×n维的矩阵,即全局极值为
| $ {{\bf{gbest}}}_{}^{\left(t\right)}=\left[\begin{array}{l}\mathrm{g}\mathrm{b}\mathrm{e}\mathrm{s}{\mathrm{t}}_{\mathrm{1, 1}}^{\left(t\right)}& \mathrm{g}\mathrm{b}\mathrm{e}\mathrm{s}{\mathrm{t}}_{\mathrm{1, 2}}^{\left(t\right)}& \cdots & \mathrm{g}\mathrm{b}\mathrm{e}\mathrm{s}{\mathrm{t}}_{1, m}^{\left(t\right)}\\ \mathrm{g}\mathrm{b}\mathrm{e}\mathrm{s}{\mathrm{t}}_{\mathrm{2, 1}}^{\left(t\right)}& \mathrm{g}\mathrm{b}\mathrm{e}\mathrm{s}{\mathrm{t}}_{\mathrm{2, 2}}^{\left(t\right)}& \cdots & \mathrm{g}\mathrm{b}\mathrm{e}\mathrm{s}{\mathrm{t}}_{2, m}^{\left(t\right)}\\& & ⋮& \\ \mathrm{g}\mathrm{b}\mathrm{e}\mathrm{s}{\mathrm{t}}_{n, 1}^{\left(t\right)}& \mathrm{g}\mathrm{b}\mathrm{e}\mathrm{s}{\mathrm{t}}_{n, 2}^{\left(t\right)}& \cdots & \mathrm{g}\mathrm{b}\mathrm{e}\mathrm{s}{\mathrm{t}}_{n, m}^{\left(t\right)}\end{array}\right] $ | (8) |
粒子在解空间里不断依据自身和周围其他个体的速度、位移信息进行寻优,其中粒子速度的更新方式为
| $ \begin{array}{l}{\boldsymbol{v}}_{i}^{(t+1)}=w{\boldsymbol{v}}_{i}^{\left(t\right)}+{c}_{1}{r}_{1}[{{\bf{pbest}}}_{i}^{\left(t\right)}-{\boldsymbol{x}}_{i}^{\left(t\right)}]+\\ {c}_{2}{r}_{2}[{{\bf{gbest}}}_{}^{\left(t\right)}-{\boldsymbol{x}}_{i}^{\left(t\right)}]\end{array} $ |
| $ {\boldsymbol{w}}={w}_{\mathrm{m}\mathrm{a}\mathrm{x}}^{}-\frac{t}{{T}^{\mathrm{*}}}\left({w}_{\mathrm{m}\mathrm{a}\mathrm{x}}^{}-{w}_{\mathrm{m}\mathrm{i}\mathrm{n}}^{}\right) $ | (10) |
式中:c1、c2分别为个体极值、全局极值的学习因子,可以控制粒子对个体极值、全局极值的学习程度,个体极值学习因子值越大,代表个体极值对粒子速度更新的影响度越大,反之则亦然;r1、r2分别为个体极值、全局极值的影响度扰动因子,可以间接增加种群多样性;w为惯性权重参数,最大值
粒子位置更新方式为
| $ {\boldsymbol{x}}_{i}^{(t+1)}={\boldsymbol{x}}_{i}^{\left(t\right)}+{\boldsymbol{v}}_{i}^{\left(t\right)} $ | (11) |
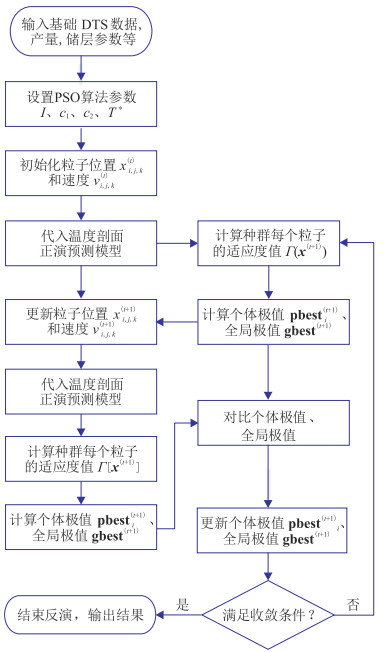
采用PSO算法进行DTS数据反演时,只需将种群P中I个粒子的位置、速度分别设为待反演目标参数的值、每一步迭代中待反演目标参数值的更新量,并将拟合评价目标函数式(3)作为适应度函数即可。本文采用PSO算法进行页岩气水平井DTS监测反演的流程如图 1所示。具体步骤如下。
|
图 1 页岩气水平井DTS监测反演流程 |
(1)设置种群P规模为I、学习因子分别为c1和c2、最大迭代次数为
(2)随机初始化种群P中I个粒子的位置和速度,将每个粒子的位置
(3)分别用式(9)和式(11)更新每个粒子的速度和位置,得到每个粒子新的速度
(4)将步骤(3)与步骤(2)得到的个体极值
(5)重复步骤(2)~步骤(4),直到满足算法终止条件之一:①迭代次数超过
此时,反演模拟的温度剖面与现场实测DTS温度剖面之间的误差足够小,达到了DTS数据反演可接受的
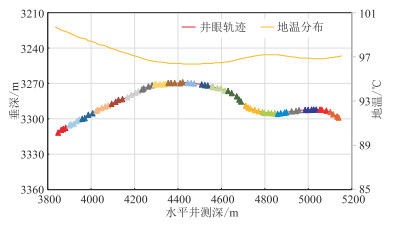
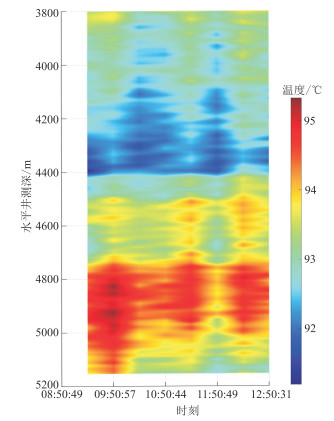
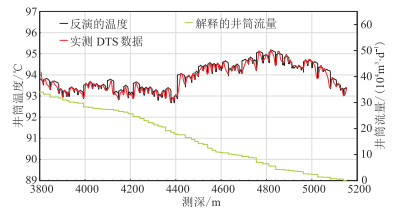
YHW-2井为页岩气生产井,完钻深度为5153 m,水平段长为1400 m。采用大规模水力压裂进行增产改造,压裂设计共20段、85簇,井眼轨迹、压裂分段设计及地温分布如图 2所示。该井采用10 mm油嘴生产,目前产量为34×104 m3/d,无地层水产出。为了明确主要产出层位并准确评估压裂效果,采用连续油管携带分布式光纤对该井进行了连续温度动态监测,分布式光纤覆盖全井段,现场测得的水平井段DTS数据如图 3所示,储层、井筒及流体物性等基础参数如表 1所示。
|
图 2 YHW-2井压裂分段设计及井眼轨迹 实三角形代表射孔簇位置,不同颜色表示不同压裂段。 |
|
图 3 YHW-2井DTS监测数据 |
|
|
表 1 YHW-2井储层及井筒基础参数 |
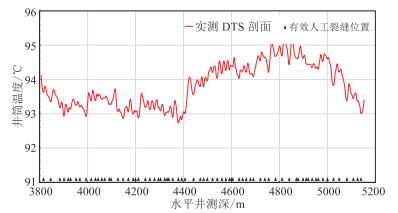
页岩气水平井主要采用分段、多簇压裂,射孔簇数较多,但压裂时并不是所有射孔簇都能形成有效支撑裂缝,部分射孔簇无法进液、进砂,投产后也没有产量贡献。在进行DTS数据反演之前,需要先对有效支撑的人工裂缝进行识别。水平井在有气体流入的射孔簇位置温度明显降低[16-18, 21-23],据此将YHW-2井现场实测的DTS温度数据与射孔簇设计位置相结合,共识别出72条有效人工裂缝(图 4)。该井有效射孔簇率为84.7%,仍有相当一部分无效射孔簇,压裂施工及分簇射孔仍有待进一步优化。
|
图 4 利用DTS数据的有效人工裂缝识别结果 |
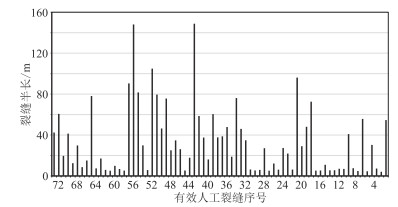
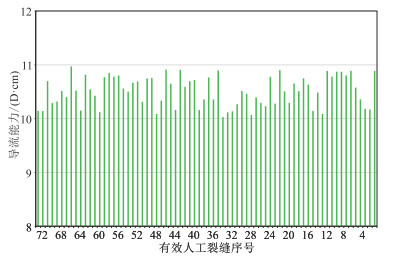
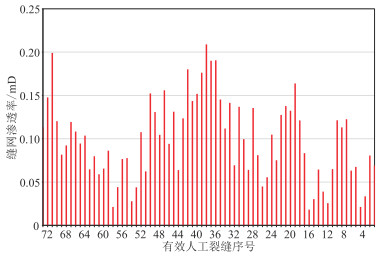
对于YHW-2井而言,有效人工裂缝半长、导流能力以及每一条人工裂缝对应的改造区渗透率均未知。在反演模型中,将人工裂缝半长、导流能力和改造区渗透率分布作为待反演目标参数。YHW-2井有72条有效人工裂缝,因此待反演目标参数
|
图 5 YHW-2井温度剖面反演结果及井筒流量反演结果 |
|
图 6 YHW-2井裂缝半长反演结果 |
|
图 7 YHW-2井裂缝导流能力反演结果 |
|
图 8 YHW-2井有效人工裂缝对应改造区缝网渗透率反演结果 |
从图 5中可以看出,反演拟合的温度剖面与现场实测DTS温度数据拟合较好,各级有效人工裂缝位置处的绝对温度偏差小于0.03 ℃。
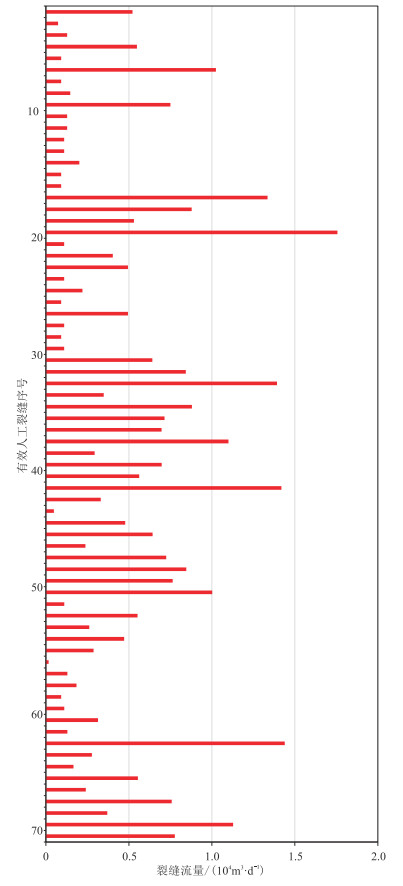
有效人工裂缝半长、导流能力及改造区缝网渗透率分布解释结果分别如图 6~图 8所示。将待反演目标参数的反演解输入正演模拟,获得该井产出剖面(图 9)。
|
图 9 YHW-2井裂缝产量贡献反演结果 |
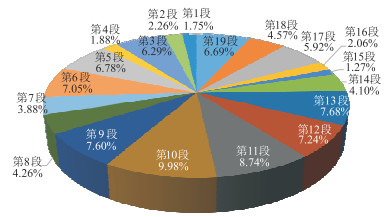
从产出剖面解释结果(图 9)可以看出,该井流体产出分布极不均匀,各压裂段产量贡献率差异较为明显(图 10)。部分压裂段单段产量贡献率大于8%(如第10、第11段),而部分压裂段产量贡献率小于2%(如第1、第4、第15段),表明各压裂段压裂改造有效性和压裂效果差异显著。
|
图 10 YHW-2井各压裂段产量贡献率 |
裂缝参数反演结果(图 6)也可对此加以印证。由图可见,压裂时裂缝扩展延伸极不均匀,形成的有效支撑裂缝平均半长为51.18 m,部分压裂段内存在明显的优势裂缝,人工主裂缝半长大于110 m(如第42、第50、第51有效射孔簇),而较多的裂缝半长小于20 m,如第2、第3、第12、第57、第60有效射孔簇等对应的人工主裂缝。
从图 7可以看出,该井人工主裂缝导流能力总体较为均匀。除了人工主裂缝,导致井筒产量分布极不均匀的另外一个因素是水力压裂沟通天然裂缝后所形成缝网的渗透率分布特征。虽然部分压裂段形成的人工主裂缝长度偏小,但水力压裂所形成的缝网区渗透率(图 8)明显更高,这些压裂段的产量贡献也可能相对更高。如第11段(第39~第42有效射孔簇)中的平均人工主裂缝半长为96.17 m,是所有压裂段中平均裂缝半长最长的,压裂改造区平均渗透率为0.15 mD;第10段(第35~第38有效射孔簇)中的平均人工主裂缝半长为80.26 m,压裂改造区平均渗透率为0.191 mD。相比第11段,第10段平均裂缝半长少了15.91 m,但更好地沟通天然裂缝,形成的改造区缝网渗透率明显更高,所以第10段是该井产量贡献率最高的压裂段(图 10),单段产量为3.39×10⁴ m3/d,产量贡献率为9.98%。当然,在水力压裂所形成的缝网渗透率相近的情况下,单段平均人工主裂缝半长越大,单段产能越高。如第3段(第6~第10有效射孔簇)压裂改造区平均渗透率为0.097 mD、第8段(第27~第31有效射孔簇)压裂改造区平均渗透率为0.101 mD,而第3段的平均人工主裂缝半长为63.19 m、第8段的平均人工主裂缝半长为30.94 m,所以第3段产量贡献比第8段高0.69×10⁴ m3/d。
产出剖面分布不均会极大制约页岩气水平井产能的发挥,因此可以对该井产量贡献明显较低的压裂段(如第1、第2、第4、第15、第16段)进行二次改造或重复压裂,以实现均衡产出剖面,进而提高该井产量。
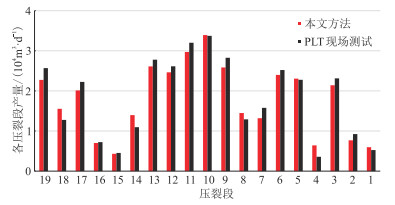
根据产出剖面反演结果计算各压裂段的产量,并与现场生产测井工具(Production Logging Tool,PLT)测得的各压裂段产量对比(图 11),可知本文方法反演结果与现场PLT测试结果吻合较好,单段最大流量偏差仅为0.291×10⁴ m3/d,反演结果较准确,从而验证了本文反演方法的可靠性。
|
图 11 YHW-2井各压裂段本文方法产量解释结果与PLT现场测试结果对比 |
采用PSO算法实现页岩气水平井DTS数据反演,可得到页岩气水平井m×n维未知参数和产出剖面。反演结果与现场PLT测试结果吻合较好,验证了本文方法的可靠性。
通过本文方法,可以明确每一簇裂缝的产量、裂缝半长、导流能力及对应的改造区缝网渗透率,进而确定压裂改造不足的层段,为页岩气水平井二次改造或重复压裂等提供直接依据。
| [1] |
郑建雄, 朱斗星, 袁立川, 等. 非常规水平井地震导向关键参数分析及预测方法[J]. 石油地球物理勘探, 2021, 56(6): 1170-1179. ZHENG Jianxiong, ZHU Douxing, YUAN Lichuan, et al. Analysis and prediction method of key parameters for seismic steering of unconventional horizontal wells[J]. Oil Geophysical Prospecting, 2021, 56(6): 1170-1179. |
| [2] |
王猛. 我国页岩气勘探开发现状及发展前景分析[J]. 石化技术, 2017, 24(7): 150-151. WANG Meng. The present situation and development prospect of shale gas exploration and development in China are analyzed[J]. Petrochemical Industry Technology, 2017, 24(7): 150-151. DOI:10.3969/j.issn.1006-0235.2017.07.118 |
| [3] |
李亚龙, 刘先贵, 胡志明, 等. 页岩储层压裂缝网模拟研究进展[J]. 石油地球物理勘探, 2019, 54(2): 480-492. LI Yalong, LIU Xiangui, HU Zhiming, et al. Research progress on fracture network simulation in shale reservoirs[J]. Oil Geophysical Prospecting, 2019, 54(2): 480-492. |
| [4] |
赵文智, 贾爱林, 位云生, 等. 中国页岩气勘探开发进展及发展展望[J]. 中国石油勘探, 2020, 25(1): 31-44. ZHAO Wenzhi, JIA Ailin, WEI Yunsheng, et al. Progress in shale gas exploration in China and prospects for future development[J]. China Petroleum Exploration, 2020, 25(1): 31-44. |
| [5] |
朱世琰. 基于分布式光纤温度测试的水平井产出剖面解释理论研究[D]. 四川成都: 西南石油大学, 2016. ZHU Shiyan. Horizontal Well Production Profile Interpretation Based on Distributed Temperature Sensing[D]. Southwest Petroleum University, Chengdu, Sichuan, 2016. |
| [6] |
MA H, LUO H, LI H, et al. Study on the influence law of temperature profile of vertical wells in gas reservoirs[J]. International Journal of Petroleum Technology, 2022, 9: 54-66. DOI:10.15377/2409-787X.2022.09.7 |
| [7] |
蔡珺君. 水平井井筒温度预测及解释模型研究[D]. 四川成都: 西南石油大学, 2016. CAI Junjun. Research on Temperature Prediction and Interpretation Model of Horizontal Well[D]. Southwest Petroleum University, Chengdu, Sichuan, 2016. |
| [8] |
UGUETO G A, HUCKABEE P T, MOLENAAR M M. Challenging assumptions about fracture stimulation placement effectiveness using fiber optic distributed sensing diagnostics: diversion, stage isolation and overflushing[C]. SPE Hydraulic Fracturing Technology Conference, 2015, SPE-173348-MS.
|
| [9] |
SOOKPRASONG P A, GILL C C, HURT R S. Lessons learned from das and dts in multicluster multistage horizontal well fracturing: interpretation of hydraulic fracture initiation and propagation through diagnostics[C]. IADC/SPE Asia Pacific Drilling Technology Conference, 2014, SPE-170512-MS.
|
| [10] |
SOOKPRASONG P A, HURT R S, GILL C C. Downhole monitoring of multicluster, multistage horizontal well fracturing with fiber optic distributed acoustic sensing (DAS) and distributed temperature sensing (DTS)[C]. International Petroleum Technology Conference, 2014, IPTC-17972-MS.
|
| [11] |
UGUETO C G A, HUCKABEE P T, MOLENAAR M M, et al. Perforation cluster efficiency of cemented plug and Perf limited entry completions; insights from fiber optics diagnostics[C]. SPE Hydraulic Fracturing Technology Conference, 2016, SPE-179124-MS.
|
| [12] |
NOWAK T J. The estimation of water injection profiles from temperature surveys[J]. Journal of Petroleum Technology, 1953, 5(8): 203-212. DOI:10.2118/953203-G |
| [13] |
YOSHIOKA K, ZHU D, HILL A D, et al. Detection of water or gas entries in horizontal wells from temperature profiles[C]. SPE Europec/EAGE Annual Conference and Exhibition, 2006, SPE-100209-MS.
|
| [14] |
YOSHIOKA K, ZHU D, HILL A D, et al. A comprehensive model of temperature behavior in a horizontal well[C]. SPE Annual Technical Conference and Exhibition, 2005, SPE-95656-MS.
|
| [15] |
LI Z, ZHU D. Predicting flow profile of horizontal well by downhole pressure and distributed-temperature data for waterdrive reservoir[J]. SPE Production & Operations, 2010, 25(3): 296-304. |
| [16] |
CAI J, DUAN Y. Study on temperature distribution along wellbore of fracturing horizontal wells in oil reservoir[J]. Petroleum, 2015, 1(4): 358-365. DOI:10.1016/j.petlm.2015.10.003 |
| [17] |
ZHANG S, ZHU D. Inversion of downhole temperature measurements in multistage fracture stimulation in horizontal wells[C]. SPE Annual Technical Conference and Exhibition, 2017, SPE-187322-MS.
|
| [18] |
CUI J, ZHU D. Diagnosis of multiple fracture stimulation in horizontal wells by downhole temperature measurements[C]. International Petroleum Technology Conference, 2014, IPTC-17700-MS.
|
| [19] |
LUO H, LI H, LU Y, et al. Inversion of distributed temperature measurements to interpret the flow profile for a multistage fractured horizontal well in low-permeability gas reservoir[J]. Applied Mathematical Modelling, 2020, 77(Part 1): 360-377. |
| [20] |
LUO H, LI H, TAN Y, et al. A novel inversion approach for fracture parameters and inflow rates diagnosis in multistage fractured horizontal wells[J]. Journal of Petroleum Science and Engineering, 2020, 184: 106585. DOI:10.1016/j.petrol.2019.106585 |
| [21] |
罗红文, 李海涛, 蒋贝贝, 等. 基于DTS数据反演的低渗气藏压裂水平井产出剖面解释新方法[J]. 天然气地球科学, 2019, 30(11): 1639-1645. LUO Hongwen, LI Haitao, JIANG Beibei, et al. A novel method to interpret production profiles of fractured horizontal well in low-permeability gas reservoir by inversing DTS data[J]. Natural Gas Geoscience, 2019, 30(11): 1639-1645. |
| [22] |
罗红文, 李海涛, 李颖, 等. 低渗透气藏压裂水平井产出剖面与裂缝参数反演解释[J]. 石油学报, 2021, 42(7): 936-947. LUO Hongwen, LI Haitao, LI Ying, et al. Inversion and interpretation of production profile and fracture parameters of fractured horizontal wells in low-permeability gas reservoirs[J]. Acta Petrolei Sinica, 2021, 42(7): 936-947. |
| [23] |
ZHANG S, ZHU D. Efficient flow rate profiling for multiphase flow in horizontal wells using downhole temperature measurement[C]. International Petroleum Technology Conference, 2019, IPTC-19138-MS.
|
| [24] |
LUO H, LI Y, LI H, et al. Simulated annealing algorithm-based inversion model to interpret flow rate profiles and fracture parameters for horizontal wells in unconventional gas reservoirs[J]. SPE Journal, 2021, 26(4): 1679-1699. |
| [25] |
林鹤, 李德旗, 周博宇, 等. 天然裂缝对压裂改造效果的影响[J]. 石油地球物理勘探, 2018, 53(增刊2): 156-161, 167. LIN He, LI Deqi, ZHOU Boyu, et al. Influences of natural cracks on fracturing[J]. Oil Geophysical Prospecting, 2018, 53(S2): 156-161, 167. |
| [26] |
李雄炎, 秦瑞宝, 曹景记, 等. 复杂储层连通孔隙度评价与渗透率定量计算方法[J]. 石油地球物理勘探, 2022, 57(2): 377-385. LI Xiongyan, QIN Ruibao, CAO Jingji, et al. Method of connected porosity evaluation and quantitative permeability calculation for complex reservoirs[J]. Oil Geophysical Prospecting, 2022, 57(2): 377-385. |
| [27] |
WU Q, ZHU Z, YAN X, et al. An improved particle swarm optimization algorithm for AVO elastic parameter inversion problem[J]. Concurrency and Computation: Practice and Experience, 2019, 31(9): e4987. |
| [28] |
马海, 王延江, 胡睿, 等. 测井岩性识别新方法研究[J]. 地球物理学进展, 2009, 24(1): 263-269. MA Hai, WANG Yanjiang, HU Rui, et al. A novel method for well logging lithologic identification[J]. Progress in Geophysics, 2009, 24(1): 263-269. |
| [29] |
李海涛, 罗红文, 向雨行, 等. 基于DTS的页岩气水平井人工裂缝识别与产出剖面解释方法[J]. 天然气工业, 2021, 41(5): 66-75. LI Haitao, LUO Hongwen, XIANG Yuxing, et al. DTS based hydraulic fracture identification and production profile interpretation method of horizontal well[J]. Natural Gas Industry, 2021, 41(5): 66-75. |
| [30] |
亓倩. 页岩气储层多级压裂水平井多场耦合非线性渗流理论研究[D]. 北京: 北京科技大学, 2020. QI Qian. Multi-field Coupling Nonlinear Seepage Theory of Multisatge Fractured Horizontal Wells for Shale Gas Reservoirs[D]. University of Science & Technology Beijing, Beijing, 2020. |
| [31] |
SHAW R, SRIVASTAVA S. Particle swarm optimization: A new tool to invert geophysical data[J]. Geophysics, 2007, 72(2): 75-83. |


 罗红文,四川省成都市新都区新都大道8号西南石油大学石油与天然气工程学院,610500。Email: