根据烃源岩弹性特征和地震响应特征,可以利用地震资料识别烃源岩、预测总有机碳(TOC)含量。Løseth等[1]分析了TOC含量与弹性阻抗的关系,认为在烃源岩层顶、底存在两个极性相反的强反射同相轴,仅依据地震数据就可以识别烃源岩层,并根据弹性阻抗与TOC含量的对应关系预测了烃源岩的空间展布特征。Carcione[2]构建了烃源岩的地震岩石物理模型,分析烃源岩的AVO特征,发现烃源岩层顶部呈第Ⅳ类AVO特征。在此基础上,其他学者[3-5]利用AVO或地震属性分析和反演方法在不同地区开展了烃源岩预测。另外,众多学者[6-12]建立了TOC含量与岩石弹性参数之间的映射关系,利用地震资料,通过弹性参数反演实现了烃源岩的预测。随着人工智能技术的发展,部分学者[13-21]利用神经网络或深度学习技术成功开展了烃源岩和页岩的TOC含量预测。
然而,上述方法多是基于有机质含量与弹性参数之间的对应关系,需要依赖大量的测井数据以获取烃源岩的弹性参数与物性参数的响应规律及对应关系。面对海上钻井难度大、成本较高、烃源岩勘探区多为少井或无井的低勘探程度区等,如何开展精细的井震标定提取准确子波,以及怎样构建精细的低频模型以获取烃源岩弹性参数与物性参数之间的定量关系等,已成为制约烃源岩预测的关键。
常规的叠前地震反演方法大多依靠井震标定从测井数据中获取地震子波,然而无井或少井区难以依据井资料提取确定性子波,使叠前地震反演方法在应用中受到较大限制。为此,部分学者依靠叠前地震资料获取符合工区特点的盲子波。地震子波盲提取的方法最先是由Robinson[22]提出,即在一系列的假设条件下,只依赖地震数据本身,不需要测井数据参与就可得到估计子波。依据地震数据高阶累积量和它与子波高阶矩的关系,可将高阶累积量方法用于子波提取[23-24]。相对于二阶累积量,高阶累积量的方法中包含相位信息,可以应用地震数据的四阶累积量对混合相位子波进行提取[25-26]。之后,Misra等[27]、Lazear[28]联合全通子波与最小相位子波估计混合相位子波。遗传算法具备进行全局寻优且不需要对目标函数求导等诸多优点。因此,本文采用遗传算法,结合高阶统计量理论提取混合相位子波[29];依据地震数据高阶累积量与子波高阶矩之间的关系推导目标泛函,并加入初始约束项,得到包含约束项的新的目标函数;约束项的加入可提高子波盲提取的稳定性[30-31],从而为少井区烃源岩地震反演预测奠定了子波基础。
初始低频模型可以补偿地震数据中缺失的低频分量,从而解决了叠前地震反演中的带限问题,因此选择一个可靠的初始模型将提高地震反演方法的收敛精度和可靠性。然而,可靠的低频参数信息在无井或少井的低勘探程度区中经常难以获取。
为了解决地震反演中模型精度过度依赖低频的问题,专家们试图利用带限的地震数据和模糊的参数模型预测模型参数蕴含的超低频信息。若将地震衰减效应引入纯频率域地震反演中,即将产生复频域地震反演方法,将有助于缓解“带限反演”带来的不确定性。Shin等[32]利用复频率反演中衰减地震波场的零频率分量,在全波形反演框架下恢复地下模型的长波长速度背景。复频域Laplace反演和低频包络反演[33-36]是不同变换域低频反演的代表,两者均旨在深度挖掘原始数据中的超低频响应,进而解决不确定性中的低频先验构建问题,提高预测结果的可靠性。依据复Laplace域低频反演的思想,本文改进了复频域反演方法以构建低频模型策略,恢复少井区地震数据中更加丰富的低频信息。
岩石物理模型是岩石弹性参数与物性参数之间的桥梁。准确的岩石物理模型是物性参数反演结果的保障。通过对目标区烃源岩的特征分析,本文选用Yu等[37]提出的适用于富泥质烃源岩岩石物理模型,建立了弹性阻抗与泥质含量、TOC含量等烃源岩主要参数之间的定量关系,据此利用弹性阻抗反演实现了烃源岩泥质含量、TOC含量等参数的直接预测。不同于依据测井资料所获取的统计关系而开展的弹性参数反演预测TOC含量的间接预测方法,该方法具有明确的物理意义、正演成因,可以定性地预测烃源岩分布范围。
1 方法原理 1.1 根据盲信号理论提取地震子波在地震子波提取的传统方法中,将地震子波假设为一个确定的子波,但在实际中地震子波是不确定的。在少井区缺乏钻井资料的情况下,不能做统计性假设,因此需要进行盲子波提取。
根据高阶统计量理论,假设噪声为高斯白噪声或者高斯有色噪声,且与地层反射系数独立统计时,噪声的高阶统计量为零,则褶积模型可去掉噪声项,表示为
| $ \boldsymbol{s}\left(t\right)=\boldsymbol{w}\left(t\right)\mathrm{*}\boldsymbol{r}\left(t\right) $ | (1) |
式中:t为时间;
地震数据与反射系数的
| $\begin{gathered} \boldsymbol{c}_s{ }^{(k)}\left(\tau_1, \tau_2, \cdots, \tau_{k-1}\right)=\boldsymbol{c}_r{ }^{(k)}\left(\tau_1, \tau_2, \cdots, \tau_{k-1}\right) * \\ \boldsymbol{c}_w{ }^{(k)}\left(\tau_1, \tau_2, \cdots, \tau_{k-1}\right) \end{gathered}$ | (2) |
式中:
当反射系数个数趋近无穷时,反射系数的
| $ {{\boldsymbol{c}}_{\boldsymbol{r}}}^{\left(k\right)}({\tau }_{1}, {\tau }_{2}, \dots , {\tau }_{k-1})={{\boldsymbol{\beta }}_{\boldsymbol{r}}}^{\left(k\right)} $ | (3) |
式中
| $ {{\boldsymbol{c}}_{\boldsymbol{s}}}^{\left(k\right)}({\tau }_{1}, {\tau }_{2}, \dots , {\tau }_{k-1})={{\boldsymbol{\beta }}_{\boldsymbol{r}}}^{\left(k\right)}{{\boldsymbol{c}}_{\boldsymbol{w}}}^{\left(k\right)}({\tau }_{1}, {\tau }_{2}, \dots , {\tau }_{k-1}) $ | (4) |
| $ {{\boldsymbol{c}}_{\boldsymbol{w}}}^{\left(k\right)}({\tau }_{1}, {\tau }_{2}, \dots , {\tau }_{k-1})=\sum\limits _{i=1}^{n}{\boldsymbol{w}}_{i}·{{\boldsymbol{w}}_{i}}_{+{\tau }_{1}}·\dots ·{{\boldsymbol{w}}_{i}}_{+{\tau }_{k-1}} $ | (5) |
式中n为地震子波脉冲响应样值的总数。
当地层反射系数为超高斯白噪声时,地震数据高阶累积量与子波高阶矩仅相差一个常数,可以构建如下目标函数求取子波高阶累积量。
| $ \begin{array}{l}{{\boldsymbol{c}}_{\boldsymbol{w}}}^{\left(4\right)}=\sum\limits _{{\tau }_{1}, {\tau }_{2}, {\tau }_{3}}\left[a\right({\tau }_{1}, {\tau }_{2}, {\tau }_{3})\cdot {{\boldsymbol{c}}_{{}_{\boldsymbol{s}}}}^{\left(4\right)}({\tau }_{1}, {\tau }_{2}, {\tau }_{3})-{{\boldsymbol{\beta }}_{\boldsymbol{r}}}^{\left(4\right)}{{\boldsymbol{c}}_{\boldsymbol{w}}}^{\left(4\right)}({\tau }_{1}, {\tau }_{2}, {\tau }_{3}{\left)\right]}^{2}\mathrm{s}.\mathrm{t}.\left\{\begin{array}{c}{\nu }_{\mathrm{d}\mathrm{o}\mathrm{w}\mathrm{n}}\le w\le {\nu }_{\mathrm{u}\mathrm{p}}\\ \sum w=0\end{array}\right\}\\ \end{array} $ | (6) |
式中:
| $ \begin{aligned} a\left(\tau_1, \tau_2, \tau_3\right)= & d\left(\tau_1\right) d\left(\tau_2\right) d\left(\tau_3\right) d\left(\tau_2-\tau_1\right) \times \\ & d\left(\tau_3-\tau_2\right) d\left(\tau_3-\tau_1\right) \end{aligned}$ | (7) |
式中
| $ d(\tau)= \begin{cases}1-6\left(\frac{|\tau|}{L}\right)^2+6\left(\frac{|\tau|}{L}\right)^3 & |\tau| \leqslant \frac{L}{2} \\ 2\left(1-\frac{|\tau|}{L}\right)^3 & \frac{L}{2}<|\tau| \leqslant L \\ 0 & |\tau|>L\end{cases}$ | (8) |
式中L为下降时间步长。
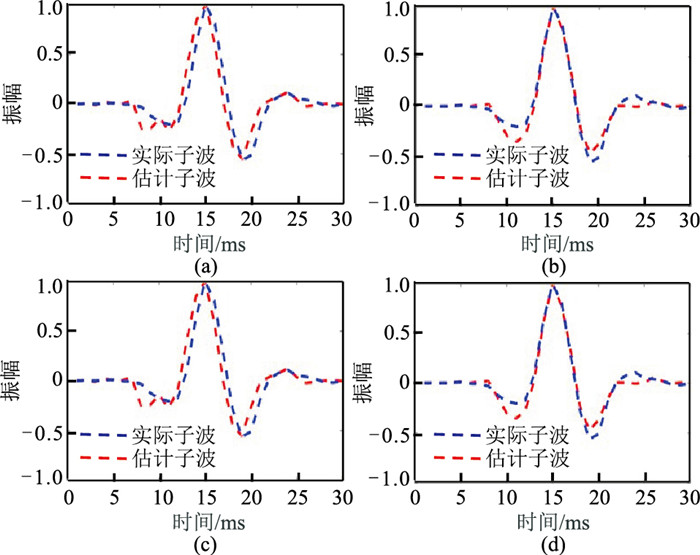
为验证该方法提取地震子波的准确性,本文采用一个已知的混合相位子波与反射系数模型褶积得到合成地震记录,然后利用该合成地震记录进行子波估计。图 1为合成地震记录迭代20~100次的子波提取结果。由图可见,估计子波与实际子波基本吻合,表明该方法在子波盲提取过程中的应用效果较好,能够为少井区烃源岩反演预测提供良好的子波基础。
|
图 1 不同迭代次数的混合相位子波提取结果 (a)20;(b)60;(c)80;(d)100 |
传统叠前地震反演方法中的低频分量通常是从测井资料获得,然而在少井甚至无井的情况下该方法难以获得较为准确的低频模型。本文方法是从地震数据中补充低频分量,基于复频域反演思想,建立符合实际情况的初始模型,然后通过复频域反演实现精细低频模型的预测,为少井区烃源岩反演提供可靠的低频先验约束。
在复频域反演过程中,首先根据复频域Laplace正演算子建立模型参数映射方程,该方程是构建无井反演目标函数的重要基础。
时间域褶积模型(式(1))经过变换可以获得频率域的褶积模型,即
| $ \boldsymbol{S}\left(\omega \right)=\boldsymbol{W}\left(\omega \right)\mathrm{*}\boldsymbol{R}\left(\omega \right) $ | (9) |
式中
| $ F\left(\omega \right)={\int }_{0}^{\mathrm{\infty }}\left[{\int }_{0}^{\mathrm{\infty }}\boldsymbol{W}(\mathrm{t}-\tau )\boldsymbol{R}\left(\tau \right)\mathrm{d}\tau \right]{\mathrm{e}}^{-\boldsymbol{\sigma }t}{\mathrm{e}}^{-\mathrm{j}\omega t}\mathrm{d}t $ | (10) |
式中:
| $ F\left(\omega \right)={\int }_{0}^{\mathrm{\infty }}\left[{\int }_{0}^{\mathrm{\infty }}\boldsymbol{W}(\mathrm{t}-\tau ){\mathrm{e}}^{-\boldsymbol{\sigma }t}{\mathrm{e}}^{-\mathrm{j}\omega t}\mathrm{d}t\right]\boldsymbol{R}\left(\tau \right)\mathrm{d}\tau $ | (11) |
根据Laplace变换时移性质,式(10)可以写成
| $ F\left(\omega \right)=\boldsymbol{W}\left(\omega \right){\int }_{0}^{\infty }\boldsymbol{R}\left(\tau \right){\mathrm{e}}^{-\boldsymbol{\sigma }\tau }{\mathrm{e}}^{-\mathrm{j}\omega \tau }\mathrm{d}\tau $ | (12) |
将式(11)简写为
| $ {\boldsymbol{F}}_{\boldsymbol{\omega }}={\boldsymbol{W}}_{\boldsymbol{\omega }}·\boldsymbol{C}·{\boldsymbol{E}}_{\boldsymbol{\omega }}·\boldsymbol{m} $ | (13) |
式中:
| $ \begin{array}{c}\\ {\boldsymbol{W}}_{{\omega }_{}}=\left[\begin{array}{cccc}W({\sigma }_{1}+\mathrm{i}\boldsymbol{\omega })& 0& & 0\\ 0& W({\sigma }_{2}+\mathrm{i}\boldsymbol{\omega })& & 0\\ & & \ddots & \\ 0& 0& & W({\sigma }_{x}+\mathrm{i}\boldsymbol{\omega })\end{array}\right]\end{array} $ | (14) |
式中下标x为衰减系数的个数。
衰减矩阵为
| $ \boldsymbol{C}={\left[\begin{array}{cccc}{\mathrm{e}}^{-{\tau }_{1}{\sigma }_{1}}& {\mathrm{e}}^{-{\tau }_{2}{\sigma }_{1}}& \dots & {\mathrm{e}}^{-{\tau }_{\mathrm{y}}{\sigma }_{1}}\\ {\mathrm{e}}^{-{\tau }_{1}{\sigma }_{2}}& {\mathrm{e}}^{-{\tau }_{2}{\sigma }_{2}}& \dots & {\mathrm{e}}^{-{\tau }_{\mathrm{y}}{\sigma }_{2}}\\ & & ⋮& \\ {\mathrm{e}}^{-{\tau }_{1}{\sigma }_{k}}& {\mathrm{e}}^{-{\tau }_{2}{\sigma }_{x}}& \dots & {\mathrm{e}}^{-{\tau }_{\mathrm{y}}{\sigma }_{x}}\end{array}\right]}_{x\times y} $ | (15) |
式中:y为时间采样点数;
离散Fourier正演算子为
| $ {\boldsymbol{E}}_{\boldsymbol{\omega }}={\left[\begin{array}{cccc}{\mathrm{e}}^{-\mathrm{i}{\tau }_{1}\omega }& 0& & 0\\ 0& {\mathrm{e}}^{-\mathrm{i}{\tau }_{2}\omega }& & 0\\ & & \ddots & \\ 0& 0& & {\mathrm{e}}^{-i{\tau }_{y}{\omega }_{}}\end{array}\right]}_{y\times y} $ | (16) |
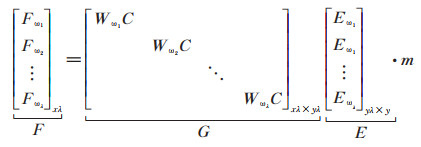
假定频率的个数为
|
(17) |
为更容易构建地震反问题目标泛函,式(17)可以改写成虚部与实部结合的形式,即
| $ \left[\begin{array}{l}\mathrm{r}\mathrm{e}\mathrm{a}\mathrm{l}\left(\boldsymbol{F}\right)\\ \mathrm{i}\mathrm{m}\mathrm{a}\mathrm{g}\left(\boldsymbol{F}\right)\end{array}\right]=\left[\begin{array}{l}\mathrm{r}\mathrm{e}\mathrm{a}\mathrm{l}(\boldsymbol{G}\cdot \boldsymbol{E})\\ \mathrm{i}\mathrm{m}\mathrm{a}\mathrm{g}(\boldsymbol{G}\cdot \boldsymbol{E})\end{array}\right] \cdot \boldsymbol{m} $ | (18) |
令
| $ {\boldsymbol{S}}^{\text{'}}={\boldsymbol{G}}^{\text{'}}·{\boldsymbol{L}}^{\text{'}}·\boldsymbol{m} $ | (19) |
式中:
以式(19)为先验方程,模型参数的后验概率密度函数为
| $ p\left(\boldsymbol{m}\left|\boldsymbol{S}\mathrm{\text{'}}\right.\right)=\frac{p\left(\boldsymbol{m}\right)p\left(\boldsymbol{S}\mathrm{\text{'}}\left|\boldsymbol{m}\right.\right)}{\int p\left(\boldsymbol{m}\right)p\left(\boldsymbol{S}\mathrm{\text{'}}\left|\boldsymbol{m}\right.\right)\mathrm{d}\left(\boldsymbol{m}\right)}\propto p\left(\boldsymbol{m}\right)p\left(\boldsymbol{S}\mathrm{\text{'}}\left|\boldsymbol{m}\right.\right) $ | (20) |
式中:
| $\begin{aligned} & p\left(\boldsymbol{S}^{\prime} \mid \boldsymbol{m}\right)=\frac{1}{2 \pi \sigma_{\mathrm{n}}^2} \times \\ & \quad \exp \left[\frac{-\left(\boldsymbol{S}^{\prime}-G^{\prime} L^{\prime} \boldsymbol{m}\right)^{\mathrm{T}}\left(\boldsymbol{S}^{\prime}-G^{\prime} L^{\prime} \boldsymbol{m}\right)}{2 \sigma_{\mathrm{n}}^2}\right] \end{aligned}$ | (21) |
| $ p\left(\boldsymbol{m}\right)=\frac{1}{(\mathrm{\pi }{\sigma }_{\mathrm{m}}{)}^{n}}\prod \limits_{i=1}^{n}{\left[\frac{1+{R}_{i}^{2}}{{\sigma }_{\mathrm{m}}^{2}}\right]}^{-1} $ | (22) |
式中:
将式(21)、式(22)代入式(20),可以得到
| $\begin{array}{r} p\left(\boldsymbol{m}, \sigma_{\mathrm{n}} \mid \boldsymbol{S}^{\prime}\right) \propto \exp \left[-\sum\limits_{i=1}^n \ln \left(1+\frac{R_i^2}{\sigma_{\mathrm{m}}^2}\right)\right] \times \\ \exp \left[\frac{-\left(\boldsymbol{S}^{\prime}-\boldsymbol{G}^{\prime} \boldsymbol{L}^{\prime} \boldsymbol{m}\right)^{\mathrm{T}}\left(\boldsymbol{S}^{\prime}-\boldsymbol{G}^{\prime} \boldsymbol{L}^{\prime} \boldsymbol{m}\right)}{2 \sigma_{\mathrm{m}}^2}\right] \end{array}$ | (23) |
式(23)中e的指数函数是单调递增的,故可将其改写成另一种形式,即
| $\begin{gathered} \ln \left[p\left(\boldsymbol{m}, \sigma_{\mathrm{n}} \mid \boldsymbol{S}^{\prime}\right)\right] \propto-\left(\boldsymbol{S}^{\prime}-\boldsymbol{G}^{\prime} \boldsymbol{L}^{\prime} \boldsymbol{m}\right)^{\mathrm{T}}\left(\boldsymbol{S}^{\prime}-\right. \\ \left.\boldsymbol{G}^{\prime} \boldsymbol{L}^{\prime} \boldsymbol{m}\right)-2 \sigma_{\mathrm{n}}^2 \sum\limits_{i=1}^n \ln \left(1+\frac{R_i^2}{\sigma_{\mathrm{m}}^2}\right) \end{gathered}$ | (24) |
对式(24)求偏导,求取
| $ \begin{array}{c} & \frac{\partial \ln p}{\partial \boldsymbol{m}}=\left[\boldsymbol{G}^{\prime} \boldsymbol{L}^{\prime}\right]^{\mathrm{T}}\left[\boldsymbol{G}^{\prime} \boldsymbol{L}^{\prime}\right] \boldsymbol{m}-\left[\boldsymbol{G}^{\prime} \boldsymbol{L}^{\prime}\right]^{\mathrm{T}} \boldsymbol{S}^{\prime}+ \\ & 4 \frac{\sigma_{\mathrm{n}}^2}{\sigma_{\mathrm{m}}^2} \operatorname{diag}\left[\left(1+\frac{R_i^2}{\sigma_{\mathrm{m}}^2}\right)^{-1}\right] \boldsymbol{m} \\ & \end{array}$ | (25) |
得到如下目标泛函
| $ \begin{aligned} \boldsymbol{m}= & \left(\boldsymbol{S}^{\prime}-\boldsymbol{G}^{\prime} \boldsymbol{L}^{\prime} \boldsymbol{m}\right)^{\mathrm{T}}\left(\boldsymbol{S}^{\prime}-\boldsymbol{G}^{\prime} \boldsymbol{L}^{\prime} \boldsymbol{m}\right)+ \\ & 2 \sigma_{\mathrm{n}}^2 \sum\limits_{i=1}^n \ln \left(1+\frac{R_i^2}{\sigma_{\mathrm{m}}^2}\right) \end{aligned} $ | (26) |
为增加无井条件下反演结果的稳定性,加入线性模型约束,得到新的目标函数
| $ \begin{aligned} \boldsymbol{m}= & \left(\boldsymbol{S}^{\prime}-\boldsymbol{G}^{\prime} \boldsymbol{L}^{\prime} \boldsymbol{m}\right)^{\mathrm{T}}\left(\boldsymbol{S}^{\prime}-\boldsymbol{G}^{\prime} \boldsymbol{L}^{\prime} \boldsymbol{m}\right)+ \\ & 2 \sigma_{\mathrm{n}}^2 \sum\limits_{i=1}^n \ln \left(1+\frac{R_i^2}{\sigma_{\mathrm{m}}^2}\right)+\boldsymbol{\varGamma} \end{aligned}$ | (27) |
| $ \boldsymbol{\varGamma }=\xi {(\boldsymbol{\eta }-P\boldsymbol{m})}^{\mathrm{T}}{(\boldsymbol{\eta }-P\boldsymbol{m})}^{\mathrm{T}} $ | (28) |
式中:
利用式(27)的反演目标函数,即可在复频域内基于贝叶斯理论实现低勘探程度区烃源岩的低频模型和弹性阻抗的反演预测。
2 算例分析选用A区进行本文方法验证。该区地震资料品质较好且具有丰富的测井资料。通过依次减少参与反演的井数,对比不同井数参与反演的结果,分析复频域低频模型/弹性阻抗反演方法的适用性及准确性。
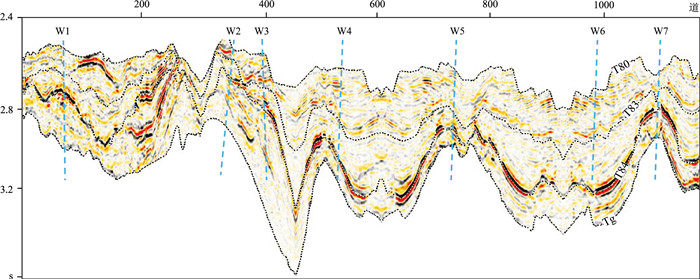
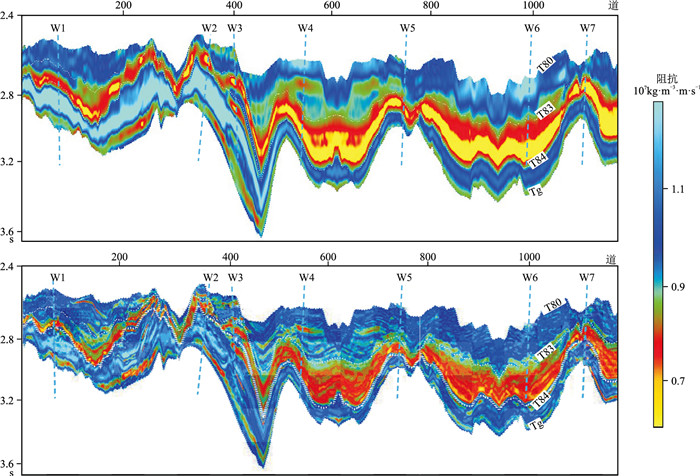
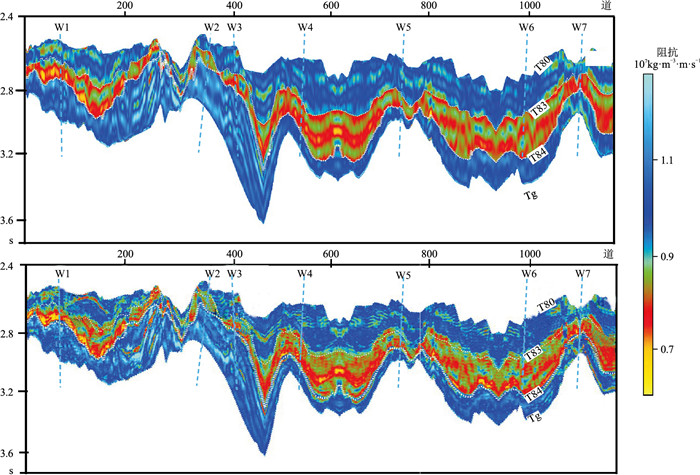
图 2为过A区7口井的连井测线的小角度地震剖面。分别对比7口井(图 3)、1口井(图 4)、无井参与(图 5)反演的弹性阻抗结果,可见随着参与反演井数的减少,反演结果与井的吻合程度存在一定程度下降。但从整体反演效果看,通过复频域无井/少井参与反演得到的弹性阻抗结果与多井趋势一致,且两者预测低阻抗烃源岩层段(T80~Tg)的位置和形态基本相似,这说明复频域的低频模型与弹性阻抗的预测结果较为可信,验证了该方法适用于无井/少井区烃源岩分布范围的预测。
|
图 2 小角度连井地震剖面 |
|
图 3 7口井参与建模的低频模型(上)及弹性阻抗反演结果(下) |

|
图 4 1口井参与建模的低频模型(上)及弹性阻抗反演结果(下) |
|
图 5 无井参与建模的低频模型(上)及弹性阻抗反演结果(下) |
为进一步分析复频域反演方法的准确性,提取反演结果的伪井波阻抗曲线与实际井进行对比,得到二者之间的误差分布直方图(图 6)。由图可见,无井/少井参与反演得到的弹性阻抗反演结果与7口井参与的结果的误差相当,误差均为正态分布,且主要在10%以内,证明复频域反演得到的低频模型可靠,该方法在无井/少井区可行。

|
图 6 复频域7口井(a)、1口井(b)及无井(c)参与反演的小角度弹性阻抗反演误差直方图 左为W1井,中为W3井,右为W5井。 |
选用Yu等[37]提出的适用于富泥质烃源岩的地震岩石物理模型,建立弹性阻抗与烃源岩参数泥质含量、烃源岩指示因子、孔隙度之间的关系(具体的推导过程见附录A),分别为
| $ {K}_{\mathrm{s}\mathrm{o}\mathrm{u}\mathrm{r}\mathrm{c}\mathrm{e}\mathrm{-}\mathrm{r}\mathrm{o}\mathrm{c}\mathrm{k}}=f\left({V}_{\mathrm{s}\mathrm{h}}, \mathrm{T}\mathrm{O}\mathrm{C}, \phi \right) $ | (29) |
| $ {\mu }_{\mathrm{s}\mathrm{o}\mathrm{u}\mathrm{r}\mathrm{c}\mathrm{e}\mathrm{-}\mathrm{r}\mathrm{o}\mathrm{c}\mathrm{k}}=g\left({V}_{\mathrm{s}\mathrm{h}}, \mathrm{T}\mathrm{O}\mathrm{C}, \phi \right) $ | (30) |
| $ {\rho }_{\mathrm{s}\mathrm{o}\mathrm{u}\mathrm{r}\mathrm{c}\mathrm{e}\mathrm{-}\mathrm{r}\mathrm{o}\mathrm{c}\mathrm{k}}=h\left({V}_{\mathrm{s}\mathrm{h}}, \mathrm{T}\mathrm{O}\mathrm{C}, \phi \right) $ | (31) |
上述式中:
已知岩石的弹性模量及密度,即可计算岩石的纵波(VP)、横波(VS)速度分别为
| $ {V}_{\mathrm{P}}=\sqrt{\frac{{K}_{\mathrm{s}\mathrm{o}\mathrm{u}\mathrm{r}\mathrm{c}\mathrm{e}\mathrm{-}\mathrm{r}\mathrm{o}\mathrm{c}\mathrm{k}}+\frac{4}{3}{\mu }_{\mathrm{s}\mathrm{o}\mathrm{u}\mathrm{r}\mathrm{c}\mathrm{e}\mathrm{-}\mathrm{r}\mathrm{o}\mathrm{c}\mathrm{k}}}{{\rho }_{\mathrm{s}\mathrm{o}\mathrm{u}\mathrm{r}\mathrm{c}\mathrm{e}\mathrm{-}\mathrm{r}\mathrm{o}\mathrm{c}\mathrm{k}}}} $ | (32) |
| $ {V}_{\mathrm{s}}=\sqrt{\frac{{\mu }_{\mathrm{s}\mathrm{o}\mathrm{u}\mathrm{r}\mathrm{c}\mathrm{e}\mathrm{-}\mathrm{r}\mathrm{o}\mathrm{c}\mathrm{k}}}{{\rho }_{\mathrm{s}\mathrm{o}\mathrm{u}\mathrm{r}\mathrm{c}\mathrm{e}\mathrm{-}\mathrm{r}\mathrm{o}\mathrm{c}\mathrm{k}}}} $ | (33) |
Connolly[38]推导的经典弹性阻抗方程为
| $ \mathrm{E}\mathrm{I}\left(\theta \right)={{V}_{\mathrm{P}}}^{1+\mathrm{t}\mathrm{a}{\mathrm{n}}^{2}\theta }{{V}_{\mathrm{S}}}^{-8K\mathrm{s}\mathrm{i}{\mathrm{n}}^{2}\theta }{\rho }^{1-4K\mathrm{s}\mathrm{i}{\mathrm{n}}^{2}\theta } $ | (34) |
式中:
综合式(29)~式(34),即可得到烃源岩弹性阻抗与泥质含量、TOC含量、孔隙度等物性参数之间的定量表达关系,即
| $ [\mathrm{E}{\mathrm{I}}_{1}, \mathrm{E}{\mathrm{I}}_{2}, \mathrm{E}{\mathrm{I}}_{3}]={f}_{\mathrm{R}\mathrm{P}\mathrm{M}}\left({V}_{\mathrm{s}\mathrm{h}}, \mathrm{T}\mathrm{O}\mathrm{C}, \phi \right) $ | (35) |
式中
在实际建模过程中,引入随机误差项
| $ [\mathrm{E}{\mathrm{I}}_{1}, \mathrm{E}{\mathrm{I}}_{2}, \mathrm{E}{\mathrm{I}}_{3}]={f}_{\mathrm{R}\mathrm{P}\mathrm{M}}\left({V}_{\mathrm{s}\mathrm{h}}, \mathrm{T}\mathrm{O}\mathrm{C}, \phi \right)+\varepsilon $ | (36) |
利用贝叶斯理论,构建基于弹性阻抗反演烃源岩重要物性参数的目标函数,并通过最大化期望算法求取最终的反演结果,即
| $ \left[{V}_{\mathrm{s}\mathrm{h}}, T, \phi \right]=\mathrm{a}\mathrm{r}\mathrm{g}\mathrm{m}\mathrm{a}\mathrm{x}P\left(\left[{V}_{\mathrm{s}\mathrm{h}}, T, \phi \right]\left|\left[\mathrm{E}{\mathrm{I}}_{1}, \mathrm{E}{\mathrm{I}}_{2}, \mathrm{E}{\mathrm{I}}_{3}\right]\right.\right) $ | (37) |
式中:
选择B区实际资料验证本文方法的应用效果。首先,结合目标区先验地质认识,通过复频域低频模型/弹性阻抗反演方法得到目标区的弹性阻抗反演结果;然后,基于构建的弹性阻抗与烃源岩关键物性参数之间的定量表征关系,利用弹性阻抗反演结果进一步预测泥质含量、T的分布特征,从而预测优质烃源岩的空间分布范围及评价其丰度等级。
图 7a和图 7b分别为无井反演预测的

|
图 7 Vsh(a)和T(b)反演结果 测线位置见图 8。 |
为了获得更明确的烃源岩平面分布特征,利用T预测数据体可对工区内烃源岩丰度进行分级刻画(图 8)。由图可见,T > 1.5时,T73~T80及T80~Tg的优质烃源岩范围均较大;T > 2时,T80~Tg的优质烃源岩范围相对更广,这与区域地质认识相符。

|
图 8 烃源岩不同层段T分级刻画结果 (a)T73~T80,T > 1.5;(b)T70~T80,T > 2.0;(c)T80~Tg,T > 1.5;(d)T80~Tg,T > 2.0 |
针对少井区难以进行井震标定提取准确子波、构建精细低频模型等问题,本文根据盲井理论,提出了提取地震盲子波和复频域反演地震低频模型的方法。在测井、地震资料丰富的地区,通过盲井测试验证了该方法能够在少井/无井条件下获得可靠的弹性阻抗。为获取烃源岩弹性参数与物性参数之间的定量表征,本文根据研究区的烃源岩岩石物理特征,基于岩石物理模型,建立了弹性阻抗与泥质含量、烃源岩指示因子之间的关系,并基于贝叶斯理论,通过弹性阻抗直接反演预测了泥质含量、烃源岩指示因子等关键参数,实现了少井区烃源岩空间分布的定性及定量预测,预测结果符合地质认识。
附录A 富泥质烃源岩岩石物理模型表达式根据Yu等[37]提出的适用于富泥质烃源岩岩石物理模型,可以直接写出烃源岩体积模量、剪切模量、密度与泥质含量、干酪根含量、孔隙度等关键物性参数之间的关系式,即
| $ \begin{array}{l}{K}_{\mathrm{s}\mathrm{o}\mathrm{u}\mathrm{r}\mathrm{c}\mathrm{e}\mathrm{-}\mathrm{r}\mathrm{o}\mathrm{c}\mathrm{k}}=\left[{K}_{\mathrm{m}}+{V}_{\mathrm{k}\mathrm{e}\mathrm{r}\mathrm{o}\mathrm{g}\mathrm{e}\mathrm{n}}({K}_{\mathrm{k}\mathrm{e}\mathrm{r}\mathrm{o}\mathrm{g}\mathrm{e}\mathrm{n}}-{K}_{\mathrm{m}}){P}^{\mathrm{*}}\right]{(1-\phi )}^{P}+\\ \quad\quad\quad\quad\quad\quad\frac{{\alpha }^{2}{K}_{\mathrm{f}\mathrm{l}\mathrm{u}\mathrm{i}\mathrm{d}}}{\phi +\left(\alpha -\phi \right)\frac{{K}_{\mathrm{f}\mathrm{l}\mathrm{u}\mathrm{i}\mathrm{d}}}{{K}_{\mathrm{m}}}}\end{array} $ | (A-1) |
| $ \begin{array}{l}{K}_{\mathrm{m}}=\frac{1}{2}\left({V}_{\mathrm{c}\mathrm{l}\mathrm{a}\mathrm{y}}{K}_{\mathrm{c}\mathrm{l}\mathrm{a}\mathrm{y}}+{V}_{\mathrm{q}\mathrm{u}\mathrm{a}\mathrm{r}\mathrm{t}\mathrm{z}}{K}_{\mathrm{q}\mathrm{u}\mathrm{a}\mathrm{r}\mathrm{t}\mathrm{z}}+{V}_{\mathrm{o}\mathrm{t}\mathrm{h}\mathrm{e}\mathrm{r}}{K}_{\mathrm{o}\mathrm{t}\mathrm{h}\mathrm{e}\mathrm{r}}\right)+\\ \quad\quad\quad\frac{1}{2\left(\frac{{V}_{\mathrm{c}\mathrm{l}\mathrm{a}\mathrm{y}}}{{K}_{\mathrm{c}\mathrm{l}\mathrm{a}\mathrm{y}}}+\frac{{V}_{\mathrm{q}\mathrm{u}\mathrm{a}\mathrm{r}\mathrm{t}\mathrm{z}}}{{K}_{\mathrm{q}\mathrm{u}\mathrm{a}\mathrm{r}\mathrm{t}\mathrm{z}}}+\frac{{V}_{\mathrm{o}\mathrm{t}\mathrm{h}\mathrm{e}\mathrm{r}}}{{K}_{\mathrm{o}\mathrm{t}\mathrm{h}\mathrm{e}\mathrm{r}}}\right)}\end{array} $ | (A-2) |
| $ \begin{array}{l}{\mu }_{\mathrm{s}\mathrm{o}\mathrm{u}\mathrm{r}\mathrm{c}\mathrm{e}\mathrm{-}\mathrm{r}\mathrm{o}\mathrm{c}\mathrm{k}}=\left[{\mu }_{\mathrm{m}}+{V}_{\mathrm{k}\mathrm{e}\mathrm{r}\mathrm{o}\mathrm{g}\mathrm{e}\mathrm{n}}({\mu }_{\mathrm{k}\mathrm{e}\mathrm{r}\mathrm{o}\mathrm{g}\mathrm{e}\mathrm{n}}-{\mu }_{\mathrm{m}}){Q}^{\mathrm{*}}\right]\times \\ \quad\quad\quad\quad\quad\quad{(1-\phi )}^{Q}\end{array} $ | (A-3) |
| $ \begin{array}{l}{\mu }_{\mathrm{m}}=\frac{1}{2}\left({V}_{\mathrm{c}\mathrm{l}\mathrm{a}\mathrm{y}}{\mu }_{\mathrm{c}\mathrm{l}\mathrm{a}\mathrm{y}}+{V}_{\mathrm{q}\mathrm{u}\mathrm{a}\mathrm{r}\mathrm{t}\mathrm{z}}{\mu }_{\mathrm{q}\mathrm{u}\mathrm{a}\mathrm{r}\mathrm{t}\mathrm{z}}+{V}_{\mathrm{o}\mathrm{t}\mathrm{h}\mathrm{e}\mathrm{r}}{\mu }_{\mathrm{o}\mathrm{t}\mathrm{h}\mathrm{e}\mathrm{r}}\right)+\\ \quad\quad\quad\frac{1}{2\left(\frac{{V}_{\mathrm{c}\mathrm{l}\mathrm{a}\mathrm{y}}}{{\mu }_{\mathrm{c}\mathrm{l}\mathrm{a}\mathrm{y}}}+\frac{{V}_{\mathrm{q}\mathrm{u}\mathrm{a}\mathrm{r}\mathrm{t}\mathrm{z}}}{{\mu }_{\mathrm{q}\mathrm{u}\mathrm{a}\mathrm{r}\mathrm{t}\mathrm{z}}}+\frac{{V}_{\mathrm{o}\mathrm{t}\mathrm{h}\mathrm{e}\mathrm{r}}}{{\mu }_{\mathrm{o}\mathrm{t}\mathrm{h}\mathrm{e}\mathrm{r}}}\right)}\end{array} $ | (A-4) |
| $ \begin{aligned} & \rho_{\text {source-rock }}=\left(1-V_{\text {kerogen }}-\phi\right)\left[V_{\text {clay }} \rho_{\text {clay }}+\right. \\ & \left.\quad\left(1-V_{\text {clay }}\right) \rho_{\text {quartz }}\right]+V_{\text {kerogen }} \rho_{\text {kerogen }}+\phi \rho_{\text {fluid }} \end{aligned}$ | (A-5) |
上述式中:
| $ {V}_{\mathrm{k}\mathrm{e}\mathrm{r}\mathrm{o}\mathrm{g}\mathrm{e}\mathrm{n}}=\frac{{\rho }_{\mathrm{s}\mathrm{o}\mathrm{u}\mathrm{r}\mathrm{c}\mathrm{e}\mathrm{-}\mathrm{r}\mathrm{o}\mathrm{c}\mathrm{k}}}{0.75{\rho }_{\mathrm{k}\mathrm{e}\mathrm{r}\mathrm{o}\mathrm{g}\mathrm{e}\mathrm{n}}}\mathrm{T}\mathrm{O}\mathrm{C} $ | (A-6) |
| [1] |
LØSETH H, WENSAAS L, GADING M, et al. Can hydrocarbon source rocks be identified on seismic data?[J]. Geology, 2011, 39(12): 1167-1170. DOI:10.1130/G32328.1 |
| [2] |
CARCIONE J M. AVO effects of a hydrocarbon source-rock layer[J]. Geophysics, 2001, 66(2): 419-427. DOI:10.1190/1.1444933 |
| [3] |
曹强, 叶加仁. 南黄海北部盆地东北凹陷烃源岩的早期预测[J]. 地质科技情报, 2008, 27(4): 75-79. CAO Qiang, YE Jiaren. Prediction of source rock of Northeast sag in North depression in South Yellow Sea Basin[J]. Geological Science and Technology Information, 2008, 27(4): 75-79. DOI:10.3969/j.issn.1000-7849.2008.04.013 |
| [4] |
李继龙, 刘财, 郭智奇, 等. 页岩储层岩石物理模型及地震AVO响应模拟[J]. 世界地质, 2015, 34(2): 497-504. LI Jilong, LIU Cai, GUO Zhiqi, et al. Rock physics model and simulation of seismic AVO responses for a shale reservoir[J]. Global Geology, 2015, 34(2): 497-504. DOI:10.3969/j.issn.1004-5589.2015.02.027 |
| [5] |
KISWAKA E B, FELIX M. Norwegian Sea area Permo-Triassic organic-carbon-rich deposits from seismic[J]. Marine and Petroleum Geology, 2020, 119: 104463. DOI:10.1016/j.marpetgeo.2020.104463 |
| [6] |
张寒, 朱光有. 利用地震和测井信息预测和评价烃源岩——以渤海湾盆地富油凹陷为例[J]. 石油勘探与开发, 2007, 34(1): 55-59. ZHANG Han, ZHU Guangyou. Using seismic and log information to predict and evaluate hydrocarbon source rocks: an example from rich oil depressions in Bohai Bay[J]. Petroleum Exploration and Development, 2007, 34(1): 55-59. DOI:10.3321/j.issn:1000-0747.2007.01.011 |
| [7] |
陈祖庆. 海相页岩TOC地震定量预测技术及其应用——以四川盆地焦石坝地区为例[J]. 天然气工业, 2014, 34(6): 24-29. CHEN Zuqing. Quantitative seismic prediction technique of marine shale TOC and its application: a case from the Longmaxi Shale Play in the Jiaoshiba area, Sichuan Basin[J]. Natural Gas Industry, 2014, 34(6): 24-29. |
| [8] |
BROADHEAD M K, CHESHIRE S G, HAYTON S. The effect of TOC on acoustic impedance for a Middle Eastern source rock[J]. The Leading Edge, 2016, 35(3): 258-264. DOI:10.1190/tle35030258.1 |
| [9] |
AMATO DEL A, ANTONIELLI E, DE TOMASI V, et al. Methods for source rock identification on seismic data: an example from the Tanezzuft Formation (Tunisia)[J]. Marine and Petroleum Geology, 2018, 91: 108-124. DOI:10.1016/j.marpetgeo.2017.12.015 |
| [10] |
李金磊, 尹成, 刘晓晶, 等. 页岩储层叠前密度稳定反演方法[J]. 地球物理学报, 2019, 62(5): 1861-1871. LI Jinlei, YIN Cheng, LIU Xiaojing, et al. Robust prestack density inversion method for shale reservoir[J]. Chinese Journal of Geophysics, 2019, 62(5): 1861-1871. |
| [11] |
LIM U Y, GIBSON R L, KABIR N. Estimation of total organic carbon (TOC) content of shale from AVO inversion: a new crossplot approach based on Zoeppritz equations[C]. Unconventional Resources Technology Conference, 2019, 2247-2259.
|
| [12] |
申雯龙, 漆滨汶, 许广臣, 等. 基于地震反演的烃源岩有机质丰度预测方法及其在丽水凹陷的应用[J]. 中国海上油气, 2019, 31(3): 68-74. SHEN Wenlong, QI Binwen, XU Guangchen, et al. The seismic inversion based organic matter abundance prediction method for source rocks and its application in Lishui sag[J]. China Offshore Oil and Gas, 2019, 31(3): 68-74. |
| [13] |
HUANG Z, WILLIAMSON M A. Artificial neural network modelling as an aid to source rock characterization[J]. Marine and Petroleum Geology, 1996, 13(2): 277-290. DOI:10.1016/0264-8172(95)00062-3 |
| [14] |
BOLANDI V, KADKHODAIE-ILKHCHI A, ALIZADEH B, et al. Source rock characterization of the Albian Kazhdumi formation by integrating well logs and geochemical data in the Azadegan oilfield, Abadan plain, SW Iran[J]. Journal of Petroleum Science and Engineering, 2015, 133: 167-176. DOI:10.1016/j.petrol.2015.05.022 |
| [15] |
BOLANDI V, KADKHODAIE A, FARZI R. Analyzing organic richness of source rocks from well log data by using SVM and ANN classifiers: a case study from the Kazhdumi formation, the Persian Gulf basin, offshore Iran[J]. Journal of Petroleum Science and Engineering, 2017, 151: 224-234. DOI:10.1016/j.petrol.2017.01.003 |
| [16] |
季少聪, 杨香华, 朱红涛, 等. 下刚果盆地A区块Madingo组烃源岩TOC含量的地球物理定量预测[J]. 石油地球物理勘探, 2018, 53(2): 369-380. JI Shaocong, YANG Xianghua, ZHU Hongtao, et al. Geophysical quantitative prediction of TOC content in source rocks of Madingo Formation in Block A, Lower Congo Basin[J]. Oil Geophysical Prospecting, 2018, 53(2): 369-380. |
| [17] |
石创, 朱俊章, 龙祖烈, 等. 基于概率神经网络的烃源岩TOC预测——以珠江口盆地陆丰南区为例[J]. 断块油气田, 2019, 26(5): 561-565. SHI Chuang, ZHU Junzhang, LONG Zulie, et al. Prediction of total organic carbon in source rocks by probabilistic neural network: a case study of southern Lufeng area in Pearl River Mouth Basin[J]. Fault-Block Oil & Gas Field, 2019, 26(5): 561-565. |
| [18] |
SHALABY M R, JUMAT N, LAI D, et al. Integrated TOC prediction and source rock characterization using machine learning, well logs and geochemical analysis: case study from the Jurassic source rocks in Shams Field, NW Desert, Egypt[J]. Journal of Petroleum Science and Engineering, 2019, 176: 369-380. |
| [19] |
SHALABY M R, MALIK O A, LAI D, et al. Thermal maturity and TOC prediction using machine learning technigues: case study from the CretaceousPaleocene source rock, Taranaki Basin, New Zealand[J]. Journal of Petroleum Exploration and Production Technology, 2020, 10(6): 2175-2193. |
| [20] |
卢鹏羽, 毛小平, 张飞, 等. 基于神经网络法预测伦坡拉盆地有机碳含量[J]. 地球物理学进展, 2021, 36(1): 230-236. LU Pengyu, MAO Xiaoping, ZHANG Fei, et al. Prediction of organic carbon content in Lunpola Basin by neural network method[J]. Progress in Geophysics, 2021, 36(1): 230-236. |
| [21] |
赵峦啸, 刘金水, 姚云霞, 等. 基于随机森林算法的陆相沉积烃源岩定量地震刻画: 以东海盆地长江坳陷为例[J]. 地球物理学报, 2021, 64(2): 700-715. ZHAO Luanxiao, LIU Jinshui, YAO Yunxia, et al. Quantitative seismic characterization of source rocks in lacustrine depositional setting using the Random Forest method: an example from the Changjiang sag in East China Sea basin[J]. Chinese Journal of Geophysics, 2021, 64(2): 700-715. |
| [22] |
ROBINSON E A. Predictive decomposition of time series with application to seismic exploration[J]. Geophysics, 1967, 32(3): 418-484. |
| [23] |
LAZEAR G D. Mixed-phase wavelet estimation using fourth-order cumulants[J]. Geophysics, 1993, 58(7): 1042-1051. |
| [24] |
MATSUOKA T, ULRYCH T J. Phase estimation using the bispectrum[J]. Proceedings of the IEEE, 1984, 72(10): 1403-1411. |
| [25] |
VELIS D R, ULRYCH T J. Simulated annealing wavelet estimation via fourth-order cumulant matching[J]. Geophysics, 1996, 61(6): 1939-1948. |
| [26] |
赵志伟. 高阶累积量子波估计及应用[D]. 四川成都: 西南石油学院, 2001. ZHAO Zhiwei. Seismic Wavelet Estimation and Applications Using High-order Cumulants[D]. Southwest Petroleum Institute, Chengdu, Sichuan, 2001. |
| [27] |
MISRA S, SACCHI M D. Non-minimum phase wavelet estimation by non-linear optimization of all-pass operators[J]. Geophysical Prospecting, 2007, 55(2): 223-234. |
| [28] |
LAZEAR G D. An examination of the exponential decay method of mixed-phase wavelet estimation[J]. Geophysics, 1984, 49(12): 2094-2099. |
| [29] |
杨培杰, 印兴耀, 张欣. 叠后地震盲反演及其应用[J]. 石油地球物理勘探, 2008, 43(3): 284-290. YANG Peijie, YIN Xingyao, ZHANG Xin. Poststack seismic blind inversion and application[J]. Oil Geophysical Prospecting, 2008, 43(3): 284-290. |
| [30] |
SACCHI M D, VELIS D R, COMINGUEZ A H. Minimum entropy deconvolution with frequency-domain constraints[J]. Geophysics, 1994, 59(6): 938-945. |
| [31] |
张生强, 张志军, 郭军, 等. 时频空间域低频约束AVO响应校正方法[J]. 石油地球物理勘探, 2021, 56(1): 137-145. ZHANG Shengqiang, ZHANG Zhijun, GUO Jun, et al. AVO response correction constrained by low-frequency components in time-frequency-space domain[J]. Oil Geophysical Prospecting, 2021, 56(1): 137-145. |
| [32] |
SHIN C, CHA Y H. Waveform inversion in the Laplace domain[J]. Geophysical Journal International, 2008, 173(3): 922-931. |
| [33] |
LUO J, WU R. Seismic envelope inversion: reduction of local minima and noise resistance[J]. Geophysical Prospecting, 2015, 63(3): 597-614. |
| [34] |
罗静蕊, 吴如山, 高静怀. 地震包络反演对局部极小值的抑制特性[J]. 地球物理学报, 2016, 59(7): 2510-2518. LUO Jingrui, WU Rushan, GAO Jinghuai. Local minima reduction of seismic envelope inversion[J]. Chinese Journal of Geophysics, 2016, 59(7): 2510-2518. |
| [35] |
杨培杰. 复数域约束最小二乘拓频[J]. 石油地球物理勘探, 2021, 56(6): 1244-1253. YANG Peijie. Constrained complex-domain leastsquares spectrum blueing[J]. Oil Geophysical Prospecting, 2021, 56(6): 1244-1253. |
| [36] |
WU R, LUO J, WU B. Seismic envelope inversion and modulation signal model[J]. Geophysics, 2014, 79(3): WA13-WA24. |
| [37] |
YU S, ZONG Z, YIN X. Rock physical model and AVO patterns for the mud-rich source rock[J]. Frontiers in Earth Science, 2021, 9: 633930. |
| [38] |
CONNOLLY P. Elastic impedance[J]. The Leading Edge, 1999, 18(4): 438-452. |


 张卫卫,广东省深圳市南山区后海滨路(深圳湾段)3168号海洋石油大厦,518054。Email: