b. University of Chinese Academy of Sciences, Beijing 100049, China
Collecting experimental materials is the necessary prerequisite for almost every biological research project. Researchers commonly collect plant materials from different locations or even from different countries in many cases. It is critical to preserve biological samples using methods that maintain the integrity of biological information for the longest time, especially for endemic plant species that are difficult to collect (Doyle and Dickson, 1987). DNA extracted from plant materials is often degraded to varying degrees, which may adversely affect future research. However, few studies have addressed the problem, and most of these studies were designed for one species, or different varieties, using short preservation time, ranging from a few hours to a few months; these studies are therefore not very convincing, especially for plant material that degrades slightly in a short time (Liang et al., 2016).
Degraded genomic DNA may have little effect on some traditional molecular markers, such as microsatellites (Ledoux et al., 2013; Prugh et al., 2005; Qin et al., 2017; Scandura et al., 2006). However, with the application of next-generation DNA sequencing (NGS), more and more reduced representation sequencing methods have been used in recent molecular research, such as molecular phylogenetics and molecular ecology (Baird et al., 2008; Peterson et al., 2012; Poland et al., 2012; Yang et al., 2016). Restriction-site associated DNA sequencing (RAD-seq) was first introduced in 2008 as a rapid SNP discovery and genotyping method (Baird et al., 2008). This technology utilizes RAD-tags, short DNA fragments adjacent to a particular restriction enzyme recognition site, to reflect the sequence characteristics of the whole genome and construct sequencing libraries for high-throughput sequencing (Baird et al., 2008; Peterson et al., 2012). Although originally designed for intraspecific genomic analysis, recent studies from various fields, such as phylogenetics, population genomics, as well as ecological and evolutionary genomics, have shown that RAD-seq can also be useful at interspecific levels (Andrews et al., 2016; Cariou et al., 2013; Cruaud et al., 2014; Rubin et al., 2012; Takahashi et al., 2014; Wang et al., 2013). Nevertheless, few studies have examined how DNA degradation affects this new technology. Previous studies have examined this problem in ants (Tin et al., 2014) and whitefish (Graham et al., 2015). However, plant and animal materials differ in important ways, and it is unclear if these results are applicable to plants.
Bambusoideae (bamboos), includes more than 1400 described species in nearly 120 genera, and is one of the most important members of Poaceae (Akinlabi et al., 2017; Bamboo Phylogeny Group (BPG), 2012). Woody bamboos have especially great ecological and economic value, providing food and raw materials for construction and manufacturing (Li et al., 2006). Because of its complex, polyploidy evolutionary history and slow evolutionary rate, Bambusoideae is a difficult group to classify (Triplett et al., 2014; Zhang et al., 2012). Although Bambusoideae has been extensively studied in evolutionary genetics contexts, it is still difficult to resolve the phylogenetic relationships of its members (Wysocki et al., 2016; Zhang et al., 2016). In recent years, analyses based on RAD tags have provided an opportunity to yield robust phylogenetic inferences on bamboo phylogenetics (Wang et al., 2013, 2017). The woody bamboos are widely distributed around the world, from Asia, America to Africa (Akinlabi et al., 2017; Bamboo Phylogeny Group (BPG), 2012). Therefore, it is a good model for conducting research on plant material preservation. In this study, we applied two DNA extraction methods and four different preservation methods to three temperate woody bamboos and three tropical woody bamboos to explore the appropriate preservation method for plant materials over various time periods up to three years. In addition, we used the modified ddRAD-seq (MiddRAD) with 21 woody bamboos to examine the effect of DNA quality on RAD-seq. Our main goals were: (1) to find an appropriate preservation method for precious plant materials that would protect high quality DNA for subsequent DNA analysis, and (2) to examine the effect of degraded DNA on the ddRAD-seq approach (MiddRAD-seq) using the STACKS bioinformatics pipeline (Catchen et al., 2013; Yang et al., 2016).
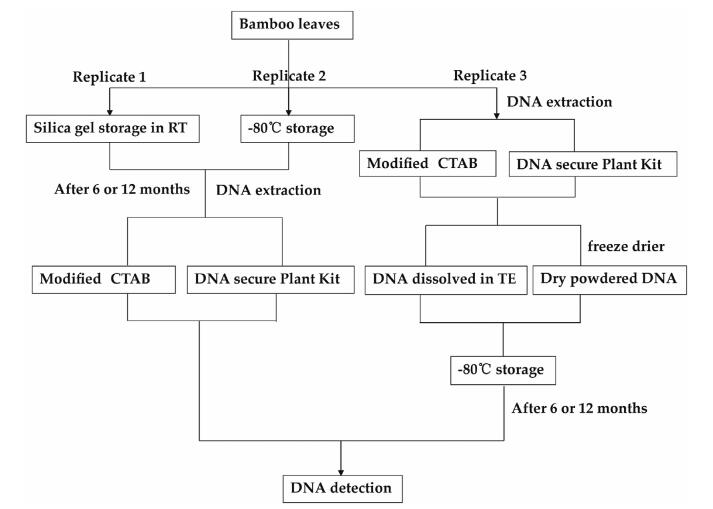
2. Materials and methods 2.1. Plant materials and treatmentsSix bamboo species, including three temperate woody bamboos (Phyllostachys edulis, Indosasa hispida cv. rainbow, Acidosasa purpurea) and three tropical woody bamboos (Dendrocalamus latiflorus, Bambusa multiplex cv. Alphonse-Karr, Bambusa emeiensis), were chosen to explore the ideal plant leaf material preservation method over various time periods extending to three years. Fresh leaves from each bamboo species were collected and divided into three equal parts (Replicate1, Replicate2, and Replicate3). Replicate1 was dried with silica gel at room temperature (RT), while Replicate2 was sealed within zip-lock bags and stored at -80 ℃. Replicate3 was used for DNA extraction directly using two different methods (the modified CTAB protocol and DNAsecure plant kit) respectively. Total genomic DNA extracted from Replicate3 was then divided equally into ten tubes, of which five were dissolved in TE solution and another five were dried by a freeze drier to obtain dry-powdered DNA. Finally, all ten tubes were stored at -80 ℃. For each six-month period that followed, DNA from Replicate3 were detected, and the material stored at low temperature (LT, Replicate1) and RT (Replicate2) were extracted and detected by electrophoresis and Nanodrop, respectively. After one year, we found that there was little difference between DNA quality following six months and twelve months of storage. We therefore extended the detection period to every 12 months. For drypowdered DNA, which is considered more stable, we extended the detection period to 24 months. If the DNA was degraded, this sample was re-extracted and detected again to confirm the degradation. Fig. 1 shows the experimental flowchart. Fresh leaf materials of these six species were all collected from plants grown at the Kunming Institute of Botany, Chinese Academy of Sciences (KIBCAS) (25°07'04.9"N, 102°44'15.2"E).
|
| Fig. 1 Flowchart of experimental design. Fresh leaves of each bamboo were divided into three equal parts (Replicate1, Replicate2, and Replicate3). Replicate1 was dried with silica gel at room temperature (RT), while Replicate2 was sealed within zip-lock bags and stored at -80 ℃ (LT). Replicate3 was used for DNA extraction directly with two different methods (the modified CTAB protocol and DNAsecure plant kit) |
Furthermore, to examine the effect of DNA quality on RAD-seq, we used MiddRAD-seq (Yang et al., 2016) to sequence 21 temperate woody bamboos (Indosasa singulispicula has two individuals), which had been collected from different locations (Table 1). DNA of some species was extracted immediately from fresh samples, whereas DNA for others was extracted following longer preservation times, as shown in Table 1.
| Taxon | Location | No. in Fig. 7 | Storage method | Storage time (month) |
| Indosasa singulispicula 12161 | Xishuangbanna, Yunnan, China | 1 | Ma | 48 |
| Indosasa singulispicula 16001 | Xishuangbanna, Yunnan, China | 2 | M | 0 |
| Phyllostachys nigra | KIB, Yunnan, Chinac | 3 | M | 0 |
| Pleioblastus chino | Kew, UKd | 4 | Db | 36 |
| Sasa bitchuensis | Kew, UK | 5 | D | 36 |
| Sasa ramosa | Kew, UK | 6 | D | 36 |
| Semiarundinaria fortis | Japan | 7 | D | 36 |
| Phyllostachys robustiramea | Anji, Zhejiang, China | 8 | D | 36 |
| Phyllostachys rubromarginata | Anji, Zhejiang, China | 9 | D | 36 |
| Phyllostachys kwangsiensis | Anji, Zhejiang, China | 10 | D | 36 |
| Phyllostachys mannii | Anji, Zhejiang, China | 11 | D | 36 |
| Phyllostachys sulphurea var. viridis | Anji, Zhejiang, China | 12 | D | 36 |
| Phyllostachys heteroclada | Anji, Zhejiang, China | 13 | D | 36 |
| Phyllostachys vivax | Guangde, Anhui, China | 14 | D | 36 |
| Phyllostachys varioauriculata | Guangde, Anhui, China | 15 | D | 36 |
| Phyllostachys nidularia | Anji, Zhejiang, China | 16 | M | 36 |
| Phyllostachys rubicunda | Anji, Zhejiang, China | 17 | M | 36 |
| Phyllostachys prominens | Anji, Zhejiang, China | 18 | M | 36 |
| Phyllostachys aureosulcata | Anji, Zhejiang, China | 19 | M | 36 |
| Phyllostachys acuta | Guangde, Anhui, China | 20 | M | 36 |
| Phyllostachys bissetii | Guangde, Anhui, China | 21 | M | 36 |
| a M represents leaf material stored in silica gel, while. b D represents DNA dissolved in TE solution. c KIB represents Kunming Institute of Botany, Chinese Academy of Sciences. d KEW represents Royal Botanic Gardens in the UK. |
||||
Total genomic DNA was extracted from leaf material using two different DNA extraction methods. The DNAsecure plant kit (Tiangen Biotech, Beijing, China, DP320) was used following the manufacturer's protocol. The other method was a modified CTAB procedure (Doyle and Doyle, 1987). Briefly, the mortars were washed and dried before starting the experiment; mortars were then sterilized by burning with alcohol; afterwards, 20 mg samples with moderate quartz sand were put in liquid nitrogen and grounded quickly; then the grounded powder was transferred into a 2-ml clean microcentrifuge tube and mixed immediately with 1 ml of 4 × CTAB extracting solution to which 1% of β-mercaptoethanol (BME) had been added; then the samples were incubated in water at 65 ℃ for 1 h; 1 ml of chloroform-isoamyl alcohol (24:1) was added, mixed and centrifuged at 9000 rpm after the tube was cooled to room temperature; the supernatant was then transferred to another clean 2 ml microcentrifuge tube and this step was repeated; the supernatant was mixed with 0.7 volumes of isopropanol and incubated at -20 ℃ for 1 h; after that, the solution was centrifuged at 10, 000 rpm for 8 min, the supernatant liquor was discarded and the DNA was cleaned with 70% and 100% ethyl alcohol twice respectively; dry-powdered DNA was produced by putting the tube in a vacuum centrifuge concentrator at 50 ℃ for 3-5 min; after that, we dissolved the dry-powdered DNA in 50 μl TE solution and incubated the mixture with 0.5 μl RNase at 37 ℃ for 1.5-2 h to digest RNA; finally, the solution was stored at -80 ℃.
The quality of total genomic DNA was detected by agarose gel electrophoresis, whereas the concentration and purity of DNA were detected by NanoDrop1000 spectrophotometer (Thermo Fisher Scientific, Delaware, USA).
2.3. Construction and sequencing of the ddRAD librariesWe used Qubit 2.0 (Thermo Fisher Scientific, Delaware, USA) to detect the concentration of total genomic DNA, and then diluted DNA to the proper concentration (40 ng/μl). Because of the different preservation times and methods, the samples were sequenced in different sequencing batches. ddRAD libraries were prepared according to Yang et al. (2016). Each sample was digested with two enzymes, i.e. AvaⅡ and MspⅠ. DNA fragments of 600-700 base pairs (bp) were selected from agarose gels and recovered by E.Z.N.A DNA gel extraction kit (D2500-02). We sequenced all ddRAD libraries on the Illumina HiSeq X10 (Illumina, San Diego, CA, USA) by employing paired-end 150-bp sequencing mode at the Cloud Health Genomics Company (Shanghai, China).
2.4. Data analysisClean data were obtained after two processing steps. Firstly, raw data were de-multiplexed using a process_radtags program implemented in STACKS version 1.41 (Catchen et al., 2011, 2013) and the sequence quality of each sample was checked using FastQC version 0.11.2 (Andrews, 2014). Then, adapter reads and low-quality bases with a Phred score below Q10 were deleted and the sequences were truncated to a final length of 140 bp with the process_radtags program. After reads were trimmed, the ustacks program was used to merge short-read sequences into tags/loci with ranging settings for minimum depth of coverage (m = 5-15) and a maximum of 5-bp difference allowed between stacks (M = 5). Then the cstacks program was used to merge loci into catalog with fourteen mismatches allowed between sample loci (n = 14). The sstacks program was applied to match loci from an individual against the catalog built by cstacks and loci that matched more than one catalog locus were excluded. Finally, the populations program was used to output single nucleotide polymorphism markers (SNPs) in phylip format. After that, we used custom shell commands to compute the RAD tags number and unexpected enzyme cutting site ratio for each sample. To determine and compare the mapping ratio of reads to the genome, clean data of each individual was mapped to P. edulis genome scaffolds (Zhao et al., 2014) with Bowtie 2.2.9 (Langmead and Salzberg, 2012).
Finally, the data set was analyzed with a maximum-likelihood method using the general time-reversible (GTR) model, which was implemented in RAxML-HPC BlackBox version 8.2.10 on the CIPRES Science Gateway web server, with a rapid bootstrapping analysis of 1000 bootstrap replicates (Stamatakis, 2014).
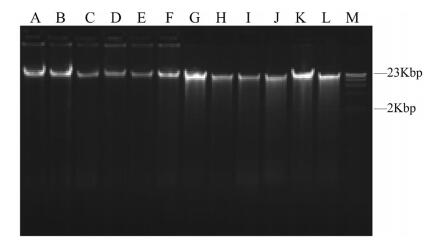
3. Results 3.1. Exploring appropriate methods for preserving DNA materials 3.1.1. Initial DNA quality detectionInitial total genomic DNA was extracted from fresh leaves of six woody bamboos using two methods, and detected by agarose gel electrophoresis and spectrophotometer, respectively. Electrophoresis showed that total genomic DNA extracted using the modified CTAB method had clear main bands (Fig. 2A-F), whereas DNA extracted using the DNAsecure plant kit showed slight degradation (Fig. 2G-L). The absorption ratios of DNA at 260/280 nm were all between 1.8 and 2.0, while the DNA concentrations of samples extracted by modified CTAB method were higher than DNA extracted by DNAsecure plant kit (Table 2).
|
| Fig. 2 Agarose gel electrophoresis of initial total genomic DNA. M: Marker. A-F: DNA extracted by modified CTAB procedure. G-L: DNA extracted by DNAsecure plant kit. Species name corresponding to A-L are shown in Table 2 |
| Extraction method | Species | Species ID | Concentration (ng/ul) | A260/280 |
| Modified CTAB procedure | Dendrocalamus latiflorusa | A | 1263.5 | 2.0 |
| Bambusa multiplex cv. Alphonse-Karra | B | 824.4 | 1.99 | |
| Bambusa emeiensisa | C | 940.4 | 1.99 | |
| Indosasa hispida cv. rainbowb | D | 647.7 | 1.99 | |
| Phyllostachys edulisb | E | 766.6 | 2.0 | |
| Acidosasa purpureab | F | 1021.9 | 2.0 | |
| DNAsecure plant kit | Dendrocalamus latiflorus | G | 217.9 | 1.94 |
| Bambusa multiplex cv. Alphonse-Karr | H | 119 | 1.83 | |
| Bambusa emeiensis | I | 136.5 | 1.95 | |
| Indosasa hispida cv. rainbow | J | 167.4 | 1.89 | |
| Phyllostachys edulis | K | 207.7 | 1.85 | |
| Acidosasa purpurea | L | 171.6 | 1.89 | |
| a Tropical woody bamboos. b Temperate woody bamboos. |
||||
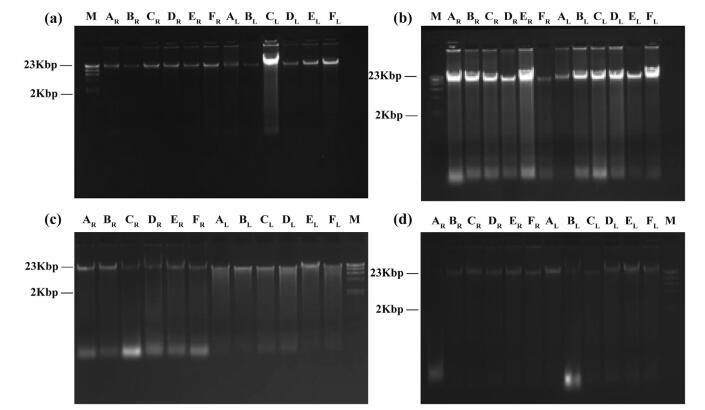
Firstly, total genomic DNA was extracted with the modified CTAB protocol from leaf materials stored under room temperature (RT, in silica gel) and low temperature (LT, fresh leaves) for 6, 12, 24 and 36 months, respectively. After 6 months, DNA showed no obvious degradation or only slight degradation (Fig. 3a). After 12 months, DNA degradation increased in both RT- and LT-stored materials (Fig. 3b), and after 24 months of storage, some DNA samples, which had unclear main DNA bands, showed obvious degradation (Fig. 3c, AL-FL). After 36 months, one DNA sample extracted from RT leaf material (Fig. 3d, AR) and one sample extracted from LT leaf material (Fig. 3d, BL) had degraded completely.
|
| Fig. 3 Agarose gel electrophoresis of total genomic DNA extracted from leaves by modified CTAB procedure after different preservation times. (a) 6 months, (b) 12 months, (c) 24 months, (d) 36 months. M: Marker. Species name corresponding to A-L are shown in Table 2. Subscript R represents that DNA was extracted from leaves stored in silica gel on RT. Subscript L represents that DNA was extracted from leaves stored at -80 ℃ |
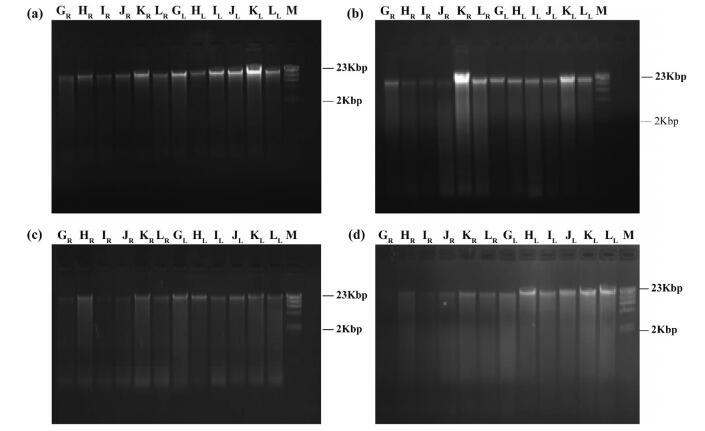
Secondly, total genomic DNA was extracted with DNAsecure plant kit from leaf materials stored under RT (in silica gel) and LT (fresh leaves) after 6, 12, 24 and 36 months of storage, respectively. After 6 months, DNA from LT-stored material was slightly degraded (Fig. 4a). After 12 months in storage, DNA degradation increased for both RT- and LT-stored materials (Fig. 4b). Moderate DNA degradation for most RT-stored materials and LT-stored materials were found after 24 months of storage (Fig. 4c), of which three individuals had ambiguous main DNA bands (Fig. 4c, GR, IR, JR). One sample degraded completely (Fig. 4d, GR), and many samples showed unclear bands (degraded moderately) after 36 months. On the other hand, the DNA concentrations of CTAB extractions appear higher than DNA concentrations from the DNAsecure plant kit (compare the brightness of DNA bands in Figs. 3 and 4). This may indicate that the CTAB method extracts DNA more efficiently than the DNAsecure plant kit.
|
| Fig. 4 Agarose gel electrophoresis of total genomic DNA extracted from leaves by the DNAsecure plant kit after different preservation times. (a) 6 months, (b) 12 months, (c) 24 months, (d) 36 months. M: Marker. Species name corresponding to A-L are shown in Table 2. Subscript R represents that DNA was extracted from leaves stored in silica gel on RT. Subscript L represents that DNA was extracted from leaves stored at -80 ℃ |
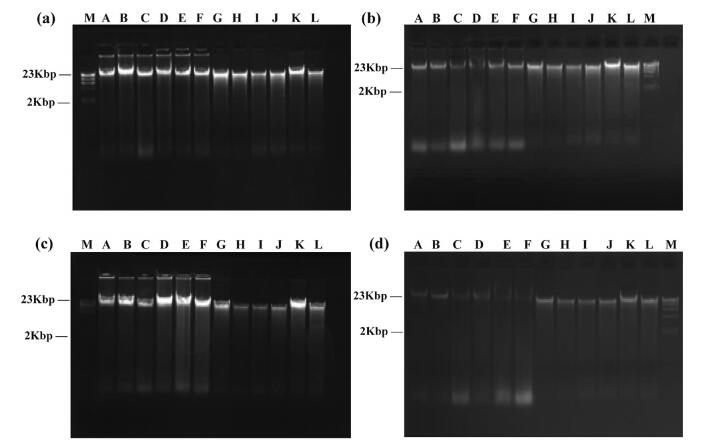
Thirdly, total genomic DNA extracted from fresh bamboo leaves stored in TE solution was detected after being preserved for 6, 12, 24 and 36 months, respectively. After storage for 6 and 12 months, respectively, DNA was only slightly degraded (Fig. 5a and b). DNA degradation increased by 24 months for DNA extracted by the modified CTAB method and the DNAsecure plant kit (Fig. 5c). Furthermore, four samples had ambiguous main bands and obvious degradation after 36 months in storage, and total genomic DNA of these four samples were all extracted by the modified CTAB method (Fig. 5d, C-F).
|
| Fig. 5 Agarose gel electrophoresis of total genomic DNA dissolved in TE after different preservation times. (a) 6 months, (b) 12 months, (c) 24 months, (d) 36 months. M: Marker. Species name corresponding to A-L are shown in Table 2 |
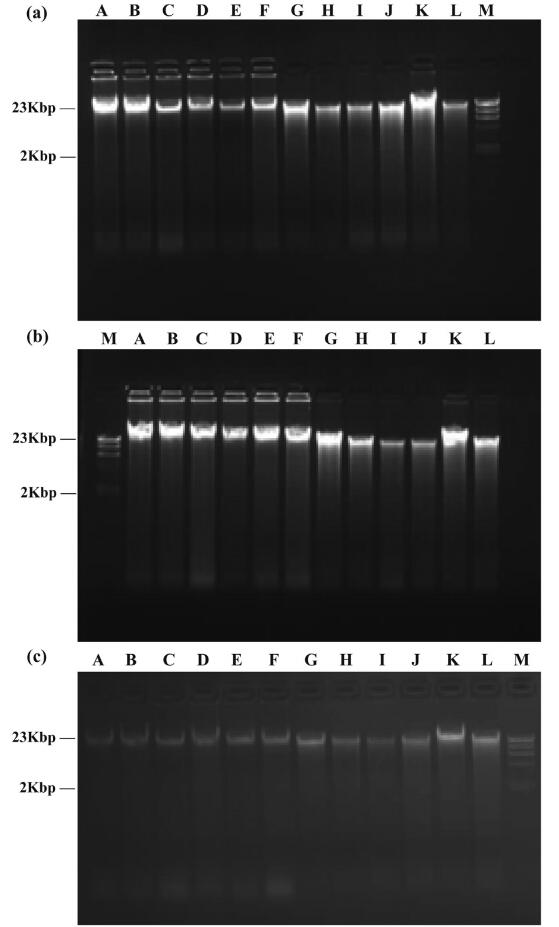
Dry-powdered DNA stored at -80 ℃ was detected after 6, 12 and 36 respectively. Electrophoresis showed that main DNA bands were clear, bright; and only slight degradations was found after 6-36 months of storage (Fig. 6). The 36-month samples were photographed using a different UV-spectrophotometer, which may have affected the brightness of images even under the same exposure. Nevertheless, by comparing sample DNA to the DNA marker, we found that after 36 months the DNA integrity remained high (Fig. 6a and b). Nanodrop spectrophotometer detection also verified the high concentration and purity of total genomic DNA for different preservation times (Appendix: Table A).
|
| Fig. 6 Agarose gel electrophoresis of dry-powdered DNA after different preservation times. (a) 6 months, (b) 12 months, (c) 36 months. M: Marker. Species name corresponding to A-L are shown in Table 2 |
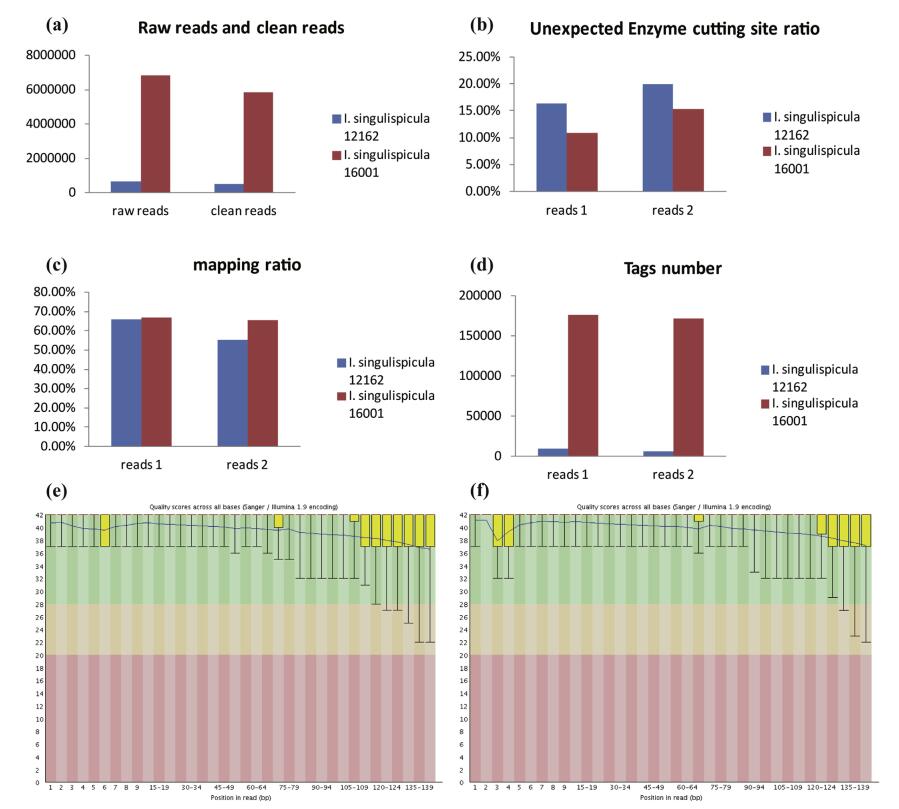
To determine the quality of DNA preserved under different preservation times, we sequenced and analyzed two I. singulispicula individuals using MiddRAD-seq (Table 1). One (I. singulispicula 12162) was collected in 2012 from Xishuangbanna, Yunnan province (21°48'51.18"N, 101°22'51.12"E, elevation 568 m), whereas the other (I. singulispicula 16001) was collected from the same place in 2016. Electrophoresis showed that DNA extracted from the leaf of I. singulispicula 12162 was completely degraded, whereas I. singulispicula 16001 DNA had a clear band with only slight degradation (Fig. 7, No.1-2). We estimated the data quality of these two samples using FastQC software and shell commands. The average reads quality of I. singulispicula 12162 showed no obvious difference from I. singulispicula 16001, but the raw reads number, clean reads number and tags number of I. singulispicula 16001 were ten times larger than I. singulispicula 12162 (Fig. 8a and d-f). Moreover, there were more reads which had unexpected restriction enzyme cutting sites and fewer reads which could be mapped to the P. edulis reference genome in I. singulispicula 12162 than the other individual (I. singulispicula 16001) (Fig. 8b and c). In summary, the data quality of I. singulispicula 12162 was clearly worse than I. singulispicula 16001, making it unfit for subsequent phylogenetic analyses.

|
| Fig. 7 Agarose gel electrophoresis of 21 bamboo species. M: Marker. 1: DNA of I. singulispicula 12162, 2-3: DNA were extracted with fresh materials, 4-15: DNA were dissolved in TE and stored at -80 ℃ for 36 months, 16-21: DNA were extracted from silica gel stored leaf materials for 36 months. Species name that correspond to the numbers are shown in Table 1 |
|
| Fig. 8 MiddRAD-seq data summaries for two individuals of I. singulispicula. This includes raw reads and clean reads number (a), Unexpected enzyme cutting sites ratio (b), Mapping ratio (c), Tags number (d), data quality of I. singulispicula 16001 read1 (e) and I. singulispicula 12162 read1 (f) |
We evaluated data quality of twenty more bamboo species from different batches of ddRAD sequencing runs (Table 3). Among them, DNA was extracted from two species using fresh materials immediately and sequenced within one month after sample collection (Table 1, No. 2-3); twelve species were sequenced after their DNA was dissolved in TE and stored in -80 ℃ for 36 months (Table 1, No. 4-15); and another six species were sequenced after their leaves were stored in silica gel for 36 months (Table 1, No. 16-21). DNA extracted from fresh leaves (Fig. 7, No. 2-3) were nearly intact, whereas DNA dissolved in TE and stored in -80 ℃ (Fig. 7, No. 4-15) showed slight degradation and DNA extracted from silica gel stored leaf materials (Fig. 7, No. 16-21) had moderate degradation. Furthermore, all samples had clear main DNA bands. These twenty species all yielded high quality data. The data size ranged from 1.28 G to 6.36 G (Table 3). Tag numbers were all between 150, 000 and 210, 000, and the unexpected enzyme cutting site ratios of most species (except I. singulispicula) were below 10% (Table 3). As expected, alignment ratios of Phyllostachys spp. to the reference genome were higher than that of species in other genera and the data missing ratios were generally lower than that of other species (except Phyllostachys nigra) (Table 3).
| Taxon | Data size (Gb) | Number of tags | Alignment ratio (%) | Unexcepted enzyme cutting site ratio (%) | Missing ratio (%) |
| Indosasa singulispiculaa | 1.68 | 175, 588 | 67 | 10.84 | 32.46 |
| Phyllostachys nigra | 6.36 | 199, 113 | 81.8 | 8.43 | 36.02 |
| Pleioblastus chino | 1.74 | 165, 174 | 64.74 | 7.9 | 34.03 |
| Sasa bitchuensis | 2.89 | 154, 681 | 66.43 | 7.16 | 34.65 |
| Sasa ramosa | 2.23 | 158, 035 | 66.7 | 6.6 | 39.27 |
| Semiarundinaria fortis | 2.87 | 176, 716 | 65.56 | 8.24 | 34.17 |
| Phyllostachys robustiramea | 2.66 | 188, 296 | 81.18 | 4.68 | 24.24 |
| Phyllostachys kwangsiensis | 2.65 | 176, 921 | 86.48 | 5.11 | 26.91 |
| Phyllostachys rubromarginata | 2.31 | 192, 009 | 79.79 | 4.53 | 24.24 |
| Phyllostachys mannii | 3.47 | 196, 504 | 79.74 | 7.06 | 22.78 |
| Phyllostachys sulphurea var. viridis | 2.58 | 164, 771 | 81.98 | 7.12 | 20.52 |
| Phyllostachys heteroclada | 4.4 | 204, 362 | 78.34 | 5.1 | 22.33 |
| Phyllostachys vivax | 3.63 | 191, 962 | 74.53 | 7.2 | 19.04 |
| Phyllostachys varioauriculata | 1.28 | 154, 792 | 78.38 | 8.51 | 15.25 |
| Phyllostachys aureosulcata | 3.71 | 207, 817 | 79.77 | 6.03 | 11.01 |
| Phyllostachys nidularia | 3.76 | 191, 329 | 78.25 | 4.71 | 22.4 |
| Phyllostachys prominens | 3.56 | 195, 164 | 81.44 | 4.8 | 16.45 |
| Phyllostachys acuta | 1.9 | 188, 183 | 77.33 | 7.04 | 17.18 |
| Phyllostachys bissetii | 1.88 | 183, 433 | 79.46 | 7.68 | 13.77 |
| Phyllostachys rubicunda | 3.54 | 187912 | 78.37 | 7.01 | 21.42 |
| a Indosasa singulispicula represents Indosasa singulispicula 16001 in Table 1. | |||||
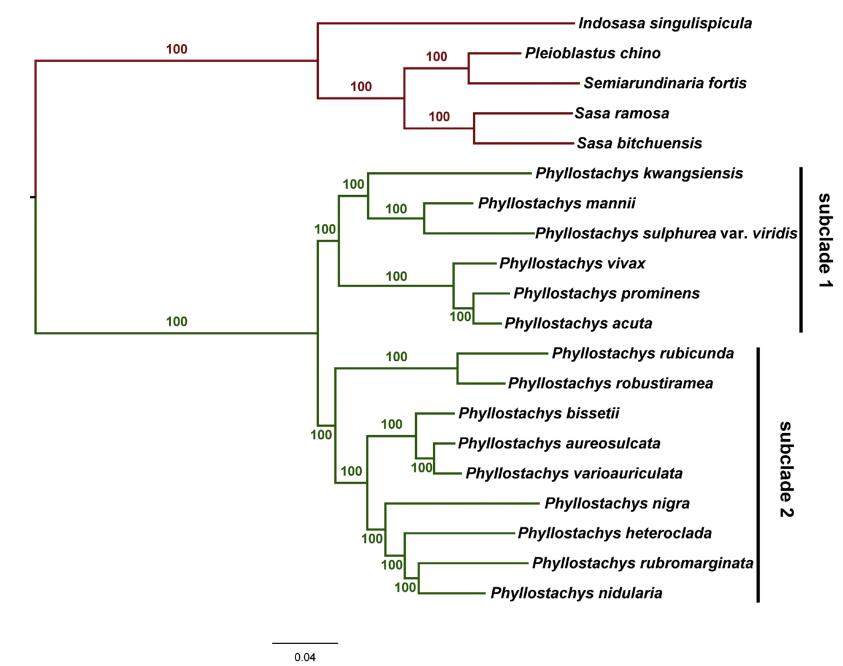
We then tried to use clean reads of these twenty species to reconstruct the phylogeny of temperate woody bamboos using the Stacks software. Eleven data sets, ranging from 11, 904 SNPs (p = 15) to 914, 416 SNPs (p = 5), were yielded and used for phylogenetic analyses with the maximum likelihood method. Topologies of phylogenetic trees constructed from different data sets were largely congruent, except low MLBS (maximum likelihood bootstrap support) of some nodes (Table 4). Phylogenetic analysis using a 21, 063- SNP data set (p = 14) revealed robust support for the relationships between twenty species (100% MLBS, Fig. 9). Two clades were found. The first contained five species, of which four were native to Japan (Suzuki, 1978) and clustered together, sister to I. singulispicula. Within the first clade, Sasa bitchuensis was sister to S. ramose, forming a clade that was sister to another clade which contained Pleioblastus chino and Semiarundinaria fortis. All the Phyllostachys members we used in this study were contained in the second clade with high support (100% MLBS), which agreed well with a previously phylogeny. Two subclades were recognized in this clade: the first one contained six species that all belonged to Phyllostachys sect. Phyllostachys, whereas the second subclade (Phyllostachys sect. Heterocladae) contained another nine species, which largely agreed with the morphology-based taxonomy (Fig. 9). Notably, five species (P. nigra, Phyllostachys robustiramea, Phyllostachys varioauriculata, Phyllostachys aureosulcata, Phyllostachys bissetii) which had previously occupied ambiguous systematic positions, were all clearly resolved in this study with 100% MLBS.
| P valuea | No. of SNPs | No. of Loci | Nodes (MLBS < 100) | Average missing ratio (%) |
| p5 | 914, 416 | 10, 6754 | 1 | 62.66 |
| p6 | 706, 221 | 75, 595 | 1 | 59.03 |
| p7 | 526, 555 | 53, 073 | 1 | 55.28 |
| p8 | 372, 902 | 36, 575 | 0 | 51.28 |
| p9 | 250, 782 | 25, 252 | 4 | 47.03 |
| p10 | 160, 448 | 17, 184 | 6 | 42.54 |
| p11 | 99, 010 | 11, 745 | 6 | 37.92 |
| p12 | 59, 843 | 8109 | 2 | 33.28 |
| p13 | 35, 754 | 5589 | 1 | 28.76 |
| p14 | 21, 063 | 3821 | 0 | 24.41 |
| p15 | 11, 904 | 2550 | 7 | 20.1 |
| a P value, minimum number of individuals a locus must be present in to process a locus. | ||||
|
| Fig. 9 Maximum likelihood phylogenetic reconstruction of twenty bamboo species. Two subclades were recognized in Phyllostachys, Phyllostachys sect. Phyllostachys (subclade 1, 100% MLBS), and Phyllostachys sect. Heterocladae (subclade 2, 100% MLBS) |
From the electrophoresis and spectrophotometer results, we determined that the initial total genomic DNA extracted from fresh leaves by two DNA extraction methods was high quality and could be used for subsequent analysis (Table 2, Fig. 2).
We found that DNA began to degrade noticeably after 12 months for RT material and 12 months for LT material. Both DNA extracted from RT material and LT material were degraded after 36 months of storage (Figs. 3 and 4). This indicates that neither silica gel nor cryopreservation efficiently preserve intact DNA long-term. This result was unexpected and we assume it is probably due to complex secondary metabolites in plant leaves. The difference between these two preservation methods became more evident after longer storage times. When we compared the effect of preservation drypowdered DNA and TE-dissolved DNA (Figs. 5 and 6), we found that the former had only slight degradation after 36 months of storage, whereas the latter showed obvious degradation after the same storage time. This indicates that dry-powdered DNA can be preserved longer than TE-dissolved DNA, and dry-powdered DNA can be preserved at least 36 months without severe degradation. Both DNA extraction methods yield high-purity DNA, but the modified CTAB method yields higher amounts of DNA than the other methods (Table 2, Table A). However, for DNA dissolved in TE solution, the four samples with clear degradation after 36 months had all been extracted using the modified CTAB method (Fig. 5). We re-examined these samples to exclude possible error. This phenomenon suggests that the DNAsecure plant kit may preserve intact DNA longer than the CTAB method, although this should be confirmed using longer preservation times.
Previous research examined DNA preservation and extraction methods in animals or bacteria; however, these studies were limited to one or few species and examined short storage times (Dillon et al., 1996; Gray et al., 2013; Maxine and Andrea, 2003; Mitchell and Takacs-Vesbach, 2008). In contrast, our study examines more plant species with a more detailed experimental design and longer observation times. Our results may therefore provide useful suggestions for preservation of plant materials. We may also conclude that: (1) The CTAB method is appropriate for extracting DNA from fresh leaves of bamboos and even grass plants, as more high-quality DNA by this method than by the DNAsecure plant kit and the low reagent cost under the same experimental conditions; (2) The quality of DNA extracted from leaf materials stored at RT showed no obvious difference from the DNA extracted from materials stored in LT after 12 months (both moderately degraded); (3) Dry-powdered DNA is better preserved than TE-dissolved DNA, which may become severely degraded after 36 months.
4.2. ddRAD sequencing for degraded DNA sampleUntil now, only a few researchers have studied the effects of degraded DNA on RAD-seq. Tin et al. used nine animal specimens (three ant species and six Hawaiian Drosophila species) with significantly degraded DNA for RAD-seq and found degraded DNA might be workable for RAD-seq. However, the degree to which degraded DNA affected RAD-seq were not clearly determined (Tin et al., 2014). Similarly, Graham et al. (2015) demonstrated that in lake whitefish (Coregonus clupeaformis) highly degraded DNA affected 3RAD-seq data, whereas moderately degraded DNA did not (Graham et al., 2015). In comparison, our study investigated how degraded DNA extracted from 21 bamboo species affected MiddRAD-seq data. We found no notable differences in data quality for 20 species; however, the quality of data for one individual (I. singulispicula 12162) was clearly poor. This suggests that the MiddRAD-seq approach is robust until total genomic DNA is severely degraded, and DNA degradation to moderate levels might not be a inhibitory for RAD-seq, which is in agree with previous studies (Graham et al., 2015). As ddRAD arguably requires the highest quality genomic DNA of all the RAD methods (Puritz et al., 2014), our conclusions could also be applied to other reduced representation sequencing methods. However, because it is possible to use moderately degraded DNA for RAD sequencing, it is important to note that degraded DNA will not produce adequate data (Yang et al., 2016). Also, duplicate removal is needed because libraries prepared from poor-quality DNA produce thousands of possibly incorrect genotype calls (Tin et al., 2015). Our study is the first research to use plant materials to investigate the effects of degraded DNA on ddRAD-seq, and we believe that it will be very instructive for wider applications of ddRAD-seq and other reduced representation sequencing methods in the plant kingdom.
4.3. SNP discovery and phylogenetic analysisIn this study, we reconstructed the phylogeny of twenty temperate woody bamboos using the maximum likelihood method and fully resolved their relationships with high support (Fig. 9). Two clades were found. The first clade contained five species and the systematic relationships among these species coincided with morphological characters and previous molecular phylogenetic analysis (Wang et al., 2017; Zhang et al., 2012). The second clade contained all members of Phyllostachys members and the relationships among them were clearly resolved (100% MLBS). Remarkably, this is the first time ddRAD-seq data have been used to investigate Phyllostachys phylogeny. We found that Phyllostachys may be a monophyletic group. However, only fifteen species (out of a total of 51 species in Flora of China, 2006) were used in our study. Extending this approach to a broader taxonomic sampling is needed to confirm the monophyly of the genus Phyllostachys. Within this genus, two subclades were produced. The first subclade contained six species of Phyllostachys sect. Phyllostachys, while the second subclade contained nine species. Four species undoubtedly belong to Phyllostachys sect. Heterocladae, whereas the phylogenetic position of the remaining five species remains uncertain. For example, in traditional classifications, P. nigra is placed in sect. Phyllostachys. However, molecular phylogenetic studies suggest that it should be classified in sect. Heterocladae (Friar and Kochert, 1994; Hodkinson et al., 2000). Furthermore, Hodkinson et al. (2000) proposed that P. nigra might be the product of hybridization. Although a broader taxonomic sampling is still required, our study highly supports (100% MLBS) the inclusion of five species (P. aureosulcata, P. bissetii, P. robustiramea, P. varioauriculata and P. nigra) in Phyllostachys sect. Heterocladae, and robustly resolves their relationships.
5. ConclusionsIn this study, we first explored the appropriate extraction and preservation method for DNA materials using six representative woody bamboo species. We found that the modified CTAB approach performed better in extracting high quality DNA than the DNAsecure plant kit, and dry-powdered DNA was better preserved than TE-dissolved DNA, RT-preserved-material and LT-preservedmaterial. We then chose 21 bamboo species for MiddRAD sequencing to investigate the impacts of DNA quality on this technology. We found that DNA degradation to moderate levels had little effect on MiddRAD-seq. The reduced-representation sequencing technology was robust until total genomic DNA was severely degraded. Finally, we reconstructed the phylogeny of 20 bamboo species and found that the Phyllostachys might be a monophyletic group. We also demonstrated systematic positions of some disputed Phyllostachys species. As ddRAD sequencing is becoming increasingly popular for phylogenetic studies, our study provides helpful suggestions for preserving plant molecular material of and the application of ddRAD-seq to reconstructing phylogenies for major plant taxa.
AcknowledgementsThis work was supported by the National Natural Science Foundation of China (Grant No. 31470322 and 31430011). We thank Dr. Li-Na Zhang, Dr. Xian-Zhi Zhang, Dr. Wen-Cai Wang for providing DNA samples of some species and Ms. Jing-Xia Liu for collecting leaf material of I. singulispicula 16001. We are grateful to Prof. Kai-Feng Hu, Prof. Jun-Bo Yang, Ms. Jing Yang and Mr. Ji-Xiong Yang at Kunming Institute of Botany, CAS for providing experimental supports.
Appendix A. Supplementary dataSupplementary data related to this article can be found at https://doi.org/10.1016/j.pld.2018.04.001.
Akinlabi, E. T., Anane-Fenin, K., Akwada, D. R., 2017. Bamboo taxonomy and distribution across the globe. In: Akinlabi, E. T., Anane-Fenin, K., Akwada, D. R. (Eds. ), Bamboo: the Multipurpose Plant. Springer International Publishing, Cham, pp. 1-37.
|
||
Andrews K.R., Good J.M., Miller M.R., Luikart G., Hohenlohe P.A., 2016. Harnessing the power of RADseq for ecological and evolutionary genomics. Nat. Rev. Genet, 17(2), 81-92.
DOI:10.1038/nrg.2015.28 |
||
Andrews, S., 2014. FastQC: a Quality Control Tool for High Throughput Sequence Data. http://www.bioinformatics.babraham.ac.uk/projects/fastqc/.
|
||
Baird N.A., Etter P.D., Atwood T.S., Currey M.C., Shiver A.L., Lewis Z.A., Selker E.U., Cresko W.A., Johnson E.A., 2008. Rapid SNP discovery and genetic mapping using sequenced RAD markers. PLoS One, 3(10).
|
||
Bamboo Phylogeny Group (BPG), 2012. An updated tribal and subtribal classification of the bamboos (Poaceae:Bambusoideae). J. Am. Bamboo Soc, 24(1), 1-10.
|
||
Cariou M., Duret L., Charlat S., 2013. Is RAD-seq suitable for phylogenetic inference? An in silico assessment and optimization. Ecol. Evol, 3(4), 846-852.
DOI:10.1002/ece3.512 |
||
Catchen J., Hohenlohe P.A., Bassham S., Amores A., Cresko W.A., 2013. Stacks:an analysis tool set for population genomics. Mol. Ecol, 22(11), 3124-3140.
DOI:10.1111/mec.12354 |
||
Catchen J.M., Amores A., Hohenlohe P., Cresko W., Postlethwait J.H., 2011. Stacks:building and genotyping loci de novo from short-read sequences. G3 Genes Genomes Genet, 1(3), 171-182.
|
||
Cruaud A., Gautier M., Galan M., Foucaud J., Sauné L., Genson G., Dubois E., Nidelet S., Deuve T., Rasplus J.-Y., 2014. Empirical assessment of RAD sequencing for interspecific phylogeny. Mol. Biol. Evol, 31(5), 1272-1274.
DOI:10.1093/molbev/msu063 |
||
Dillon N., Austin A.D., Bartowsky E., 1996. Comparison of preservation techniques for DNA extraction from hymenopterous insects. Insect Mol. Biol, 5(1), 21-24.
DOI:10.1111/imb.1996.5.issue-1 |
||
Doyle J.J., Doyle J.L., 1987. A rapid DNA isolation procedure for small quantities of fresh leaf tissue. Phytochem. Bull, 19, 11-15.
|
||
Doyle J.J., Dickson E.E., 1987. Preservation of plant-samples for DNA restriction endonuclease analysis.. Taxon, 36(4), 715-722.
DOI:10.2307/1221122 |
||
Friar E., Kochert G., 1994. A study of genetic variation and evolution of Phyllostachys, (Bambusoideae:Poaceae) using nuclear restriction fragment length polymorphisms. Theor. Appl. Genet, 89, 265-270.
|
||
Graham C.F., Glenn T.C., McArthur A.G., Boreham D.R., Kieran T., Lance S., Manzon R.G., Martino J.A., Pierson T., Rogers S.M., 2015. Impacts of degraded DNA on restriction enzyme associated DNA sequencing (RADSeq). Mol. Ecol. Res, 15, 1304-1315.
DOI:10.1111/1755-0998.12404 |
||
Gray M.A., Zoe A.P., Kellogg C.A., 2013. Comparison of DNA preservation methods for environmental bacterial community samples. FEMS Microbiol. Ecol, 83(2), 468-477.
DOI:10.1111/1574-6941.12008 |
||
Hodkinson T.R., Renvoize S.A., Chonghaile G.N., Stapleton C.M., Chase M.W., 2000. A comparison of its nuclear rDNA sequence data and AFLP markers for phylogenetic studies in Phyllostachys (Bambusoideae, Poaceae). J. Plant Res, 113(3), 259-269.
DOI:10.1007/PL00013936 |
||
Langmead B., Salzberg S.L., 2012. Fast gapped-read alignment with Bowtie 2. Nature Methods, 9(4), 357.
DOI:10.1038/nmeth.1923 |
||
Ledoux J.B., Aurelle D., Feral J.P., Garrabou J., 2013. Molecular forensics in the precious Mediterranean red coral, Corallium rubrum:testing DNA extraction and microsatellite genotyping using dried colonies. Conserv. Genet, 5(2), 327-330.
DOI:10.1007/s12686-012-9795-2 |
||
Li D.Z., Wang Z.P., Zhu Z.D., Xia N.H., Jia L.Z., Guo Z.H., Yang G.Y., Stapleton C.M.A., 2006. Flora of China Vol., 22 (Poaceae, Tribe Bambuseae). Science Press, Beijing. |
||
Liang H., Fu M., Yang G., Chen J., Yang X., 2016. Effects of different preservation methods on yield and quality of total genomic DNA of Tamarix chinensis. Genom. Appl. Biol, 35(8), 2168-2172.
|
||
Maxine P.P., Andrea C.T., 2003. Extensive evaluation of faecal preservation and DNA extraction methods in Australian native and introduced species. Aust. J. Zool, 51(4), 341-355.
DOI:10.1071/ZO03012 |
||
Mitchell K.R., Takacs-Vesbach C.D., 2008. A comparison of methods for total community DNA preservation and extraction from various thermal environments. J. Ind. Microbiol. Biotechnol, 35(10), 1139.
DOI:10.1007/s10295-008-0393-y |
||
Peterson B.K., Weber J.N., Kay E.H., Fisher H.S., Hoekstra H.E., 2012. Double digest RADseq:an inexpensive method for de novo SNP discovery and genotyping in model and non-model species. PLoS One, 7(5), e37135.
DOI:10.1371/journal.pone.0037135 |
||
Poland J.A., Brown P.J., Sorrells M.E., Jannink J.-L., 2012. Development of highdensity genetic maps for barley and wheat using a novel two-enzyme genotyping-by-sequencing approach. PLoS One, 7(2), e32253.
DOI:10.1371/journal.pone.0032253 |
||
Prugh L.R., Ritland C.E., Arthur S.M., Krebs C.J., 2005. Monitoring coyote population dynamics by genotyping faeces. Mol. Ecol, 14(5), 1585-1596.
DOI:10.1111/mec.2005.14.issue-5 |
||
Puritz J.B., Matz M.V., Toonen R.J., Weber J.N., Bolnick D.I., Bird C.E., 2014. Demystifying the RAD fad. Mol. Ecol, 23(24), 5937-5942.
DOI:10.1111/mec.12965 |
||
Qin H.T., Yang G.Q., Provan J., Liu J., Gao L.M., 2017. Using MiddRAD-seq data to develop polymorphic microsatellite markers for an endangered yew species. Plant Divers, 39(5), 294-299.
DOI:10.1016/j.pld.2017.05.008 |
||
Rubin B.E.R., Ree R.H., Moreau C.S., 2012. Inferring phylogenies from RAD sequence data. PLoS One, 7(4), e33394.
DOI:10.1371/journal.pone.0033394 |
||
Scandura M., Capitani C., Iacolina L., Marco A., 2006. An empirical approach for reliable microsatellite genotyping of wolf DNA from multiple noninvasive sources. Conserv. Genet, 7(6), 813-823.
DOI:10.1007/s10592-005-9106-5 |
||
Stamatakis A., 2014. RAxML version 8:a tool for phylogenetic analysis and postanalysis of large phylogenies. Bioinformatics, 30(9), 1312-1313.
DOI:10.1093/bioinformatics/btu033 |
||
Suzuki, S., 1978. Index to Japanese Bambusaceae.
|
||
Takahashi T., Nagata N., Sota T., 2014. Application of RAD-based phylogenetics to complex relationships among variously related taxa in a species flock. Mol. Phylogenet. Evol, 80, 137-144.
DOI:10.1016/j.ympev.2014.07.016 |
||
Tin M.M., Economo E.P., Mikheyev A.S., 2014. Sequencing degraded DNA from nondestructively sampled museum specimens for RAD-tagging and low-coverage shotgun phylogenetics. PLoS One, 9(5), e96793.
DOI:10.1371/journal.pone.0096793 |
||
Tin M.M.Y., Rheindt F.E., Cros E., Mikheyev A.S., 2015. Degenerate adaptor sequences for detecting PCR duplicates in reduced representation sequencing data improve genotype calling accuracy. Mol. Ecol. Res, 15(2), 329-336.
DOI:10.1111/1755-0998.12314 |
||
Triplett J.K., Clark L.G., Fisher A.E., Wen J., 2014. Independent allopolyploidization events preceded speciation in the temperate and tropical woody bamboos. New Phytol, 204(1), 66-73.
DOI:10.1111/nph.12988 |
||
Wang X.Q., Ye X.Y., Zhao L., Li D.Z., Guo Z.H., Zhuang H.F., 2017. Genome-wide RAD sequencing data provide unprecedented resolution of the phylogeny of temperate bamboos (Poaceae:Bambusoideae). Sci. Rep, 7.
|
||
Wang X.Q., Zhao L., Eaton D.A.R., Li D.Z., Guo Z.H., 2013. Identification of SNP markers for inferring phylogeny in temperate bamboos (Poaceae:Bambusoideae) using RAD sequencing. Mol. Ecol. Res, 13(5), 938-945.
DOI:10.1111/1755-0998.12136 |
||
Wysocki W.P., Ruiz-Sanchez E., Yin Y., Duvall M.R., 2016. The floral transcriptomes of four bamboo species (Bambusoideae; Poaceae):support for common ancestry among woody bamboos. BMC Genom, 17(1), 384.
DOI:10.1186/s12864-016-2707-1 |
||
Yang G.Q., Chen Y.M., Wang J.P., Guo C., Zhao L., Wang X.Y., Guo Y., Li L., Li D.Z., Guo Z.H., 2016. Development of a universal and simplified ddRAD library preparation approach for SNP discovery and genotyping in angiosperm plants. Plant Meth, 12.
|
||
Zhang X.Z., Zeng C.X., Ma P.F., Haevermans T., Zhang Y.X., Zhang L.N., Guo Z.H., Li D.Z., 2016. Multi-locus plastid phylogenetic biogeography supports the Asian hypothesis of the temperate woody bamboos (Poaceae:Bambusoideae). Mol.Phylogenet. Evol, 96, 118-129.
DOI:10.1016/j.ympev.2015.11.025 |
||
Zhang Y.X., Zeng C.X., Li D.Z., 2012. Complex evolution in Arundinarieae (Poaceae:Bambusoideae):incongruence between plastid and nuclear GBSSI gene phylogenies. Mol. Phylogenet. Evol, 63(3), 777-797.
DOI:10.1016/j.ympev.2012.02.023 |
||
Zhao H.S., Peng Z.H., Fei B.H., Li L.B., Hu T., Gao Z.M., Jiang Z.H., 2014. BambooGDB:a bamboo genome database with functional annotation and an analysis platform. Database J. Biol. Databases Curation, 10.
|


