


b. State Key Laboratory of Vegetation and Environmental Change, Institute of Botany, Chinese Academy of Sciences, Beijing 100093, China
Biological specimens of plants include complete or partial individuals, as well as physical objects or relics related to life activities (He et al., 2021). Biological specimens are critical for research on biodiversity and conservation (Schmidt-Lebuhn et al., 2013; Engemann et al., 2015; Vargas et al., 2022), allowing researchers to characterize species distribution patterns, assess and monitor threatened species, and formulate conservation policies (Meyer et al., 2016; Oliveira et al., 2016; Zizka et al., 2021). Because of the large spatial–temporal scale, high precision, and rich content of information, biological specimen can also be used to record and trace the impacts of environmental changes on biological morphology and behavior (Schmitt et al., 2019). Specifically, a study in the Hengduan Mountains analyzed elevational patterns of Delphinium species richness, functional diversity and trait occurrence using specimen database, indicating that the middle elevation region could be insurance against environmental change (Qian et al., 2022). A database of higher plants in Myanmar derived from herbarium specimens and literature sources was developed, aiming to provide a baseline floristic data of Myanmar and act as a guide for future research efforts (Aung et al., 2023). Zu et al. (2024) used long-term collections of 33 flowering plant species from the Gongga Mountains to investigate how plant flowering phenology changed over the past 70 years in response to climate change. This study found that mean flowering times in the Gongga Mountains were delayed in all vegetation types and elevations over the last 70 years.
However, specimen collection often suffers from taxonomic preference, geographical preference, and time preference (Küper et al., 2006; Hortal et al., 2007; Zizka et al., 2021; Vargas et al., 2024), which often leads to unreliable research results (Hortal et al., 2007; Sánchez-Fernández et al., 2008; Sigler et al., 2021; Vargas et al., 2024). Specimen collection is known to be preferred by several factors, including species traits, geographical and environmental factors, and socio-economic factors (Romo et al., 2006; Yang et al., 2021; Vargas et al., 2022). Species traits include body size or plant height, flowering and fruiting period, biological circadian rhythm, and ecological amplitude (Burton, 2012; Yang et al., 2021; Baker et al., 2022). Specifically, large specimens of herbaceous plants are collected less because botanists prefer to collect plants that happen to fit on one herbarium sheet (Schmidt-Lebuhn et al., 2013). An investigation about angiosperm species in China confirmed a weak positive relationship between specimen number and flowering and fruiting period, suggesting that species with longer flowering and fruiting periods are possible to have more records (Yang et al., 2021). A long-term and locally-based wildlife monitoring program in West African showed that larger, diurnal animals were easier to spot probably due to their high detectability (Burton, 2012). In addition, some studies pointed out that species with narrower environmental niches were more likely to be affected by collection preference, because they may be entirely missed or sparsely sampled (Inman et al., 2021; Baker et al., 2022). Species with wide range size including distribution range and altitudinal range have higher probability of being collected, resulting in a larger number of specimen (Yang et al., 2021). In contrast, it has also been found that rare species are more attractive to collectors than common species, because collectors often try to collect as many new species as possible, which also lead to a staggering number of species with only one specimen (Ter Steege et al., 2011; de Araujo and Ramos, 2021).
Except for species traits, geographical and environmental factors can also affect the biological specimen collection (Yang et al., 2014; Monsarrat et al., 2019; Vargas et al., 2022). Although specimen collectors or researchers prefer higher-altitude areas with larger environmental heterogeneity and richer biodiversity (Parnell et al., 2003; Sánchez-Fernández et al., 2008; Engemann et al., 2015; de Araujo and Ramos, 2021), the difficulty of entering the high-altitude areas can also dampen their enthusiasm (Guo et al., 2013). What's more, serious human disturbances such as farmland expansion or urbanization at lower elevations make here an unsatisfactory place to collect specimens (Guo et al., 2013). A study about written records of mammal occurrence collected in the early historical period in South Africa suggested that collectors preferred regions with lower maximum temperature of the warmest months and higher mean monthly precipitation, because their livestock needed large amount of water and fodder (Monsarrat et al., 2019). But in the Colombian Andes, there were fewer specimens in areas with high precipitation since only few areas (25%) received higher precipitation (Vargas et al., 2022). In addition, socio-economic factors including roads density, local GDP level, and conflict can also lead to the formation of specimen collection preference (Oliveira et al., 2016; de Araujo and Ramos, 2021; Vargas et al., 2022). Considering the convenience of specimen collection, specimen collection sites are often concentrated in areas with good reachability and convenient transportation, which is called “road-map effect” (Yang et al., 2014; Sobral-Souza et al., 2021; Baker et al., 2022). Because of the greater investment in scientific research, specimen number in developed countries and regions will be higher (de Araujo and Ramos, 2021; Bowler et al., 2022). Conflict which makes fieldwork extremely risky can also lead to less biological specimen collection (Vargas et al., 2022).
National Specimen Information Infrastructure (NSⅡ, http://www.nsii.org.cn/) is the largest data sharing platform for biological specimen in China, including plants, animals, fossils, fungi, ice and snow samples, minerals, rocks, sediments, meteorites and other specimen types (Xiao, 2018; Xiao et al., 2018). Till 2022, digitized plant specimen number has exceeded 10 million (http://www.nsii.org.cn/). Carex, Artemisia, Astragalus and Stipa are the dominant and representative genera of grassland in northern China, and their species number accounts for about 9.16% of all vascular plant species here (Zhao et al., 2020). They are widely distributed in forests, grasslands, deserts, mountains and other habitats, and are important parts of Chinese flora (Zhao et al., 2020). So, specimens of them were selected from NSⅡ for the analysis. Carex (Cyperaceae) is widely distributed in the world with a total of about 2000 species; among them, there are about 500 species in China (Wu and Raven, 2013). It is one of the most abundant vascular plants of grasslands in northern China, with a total of 100 species (Zhao et al., 2020). Artemisia (Compositae) with a total of about 300 species and there are 186 species and 44 varieties in China (Wu and Raven, 2013). Artemisia is the second largest genus of vascular plants of grasslands in northern China, with a total of 73 species (Zhao et al., 2020). Astragalus (Leguminosae) is widely spreaded in the world with a total of about 2000 species; in China, there are 278 species, 2 subspecies, 35 varieties and 2 forms (Wu and Raven, 2013). Astragalus is the third largest genus of vascular plants of grasslands in northern China, with a total of 52 species (Zhao et al., 2020). As the constructive species in Chinese grasslands, Stipa (Poaceae) plants constitute 32 Stipa grassland formations (Tu, 2020). Stipa is the 23rd large genus of vascular plants of grasslands in northern China, with a total of 15 species (Zhao et al., 2020).
Due to its vast land area, stable paleoclimate, long history of biological evolution, as well as complex and diverse habitats, China is one of the most biodiverse countries (Ying, 2001). It has also attracted many scholars to study the distribution patterns and specimen collection of various biological groups (Feng, 2008; Feng and Xu, 2009; Zhang et al., 2015; Yang et al., 2021). Many scholars have realized the existence of specimen collection preference, and have described and summarized them well, but there are relatively fewer studies evaluating specimen collection preference at the species level in China (Yang et al., 2014). So based on previous researches, this study aims to test the following three hypotheses: H(1), the plant specimen number of species with taller plant height or longer flowering and fruiting periods is higher; H(2), the plant specimen number of species with wider temperature or precipitation range is higher; H(3), the plant specimen number of species with larger distribution range or altitudinal range is higher.
2. Materials and methods 2.1. Data overview and standardizationThe detailed information of 181,818 plant specimens of Carex, Artemisia, Astragalus and Stipa were obtained from the National Specimen Information Infrastructure (NSⅡ, http://www.nsii.org.cn/), including scientific name, common name, collector, collection time, collection site, habitat and herbarium and so on. The initial data set included 59,778 specimens of Carex, 68,970 specimens of Artemisia, 39,343 specimens of Astragalus and 13,727 specimens of Stipa. The specimen data only comes from NSⅡ because it is the largest data sharing platform for biological specimen in China (Xiao et al., 2018). It has a total of 190 co-construction units in China and is widely distributed nationwide, providing rich and comprehensive specimen data (http://www.nsii.org.cn/).
In order to improve the data quality, a series of cleaning work were performed as follows. First, we standardized the scientific names of specimens and eliminated specimens whose Latin name accuracy rate was below 0.9 on Taxonomic Name Resolution Service website (TNRS, http://tnrs.biendata.org/). Next, we eliminated specimens with missing collection sites or those collected outside of China. We also refined the collection site to the prefecture level and eliminated specimens whose collection sites could not be identified at the prefecture level. We proofread and revised the names of prefecture cities according to the latest administrative divisions in China, and unified the names of prefecture cities. Finally, we queried collection sites in nature reserves on the browser. If the complete nature reserve was in a prefecture city, the collection sites were written as the name of the city. Prefectural data were adopted because provincial data might not accurately reflect the distribution of specimen number. After this data cleaning, 142,321 plant specimens landmarked to the prefecture level were obtained, including 47,217 specimens of Carex, 54,507 specimens of Artemisia, 30,815 specimens of Astragalus and 9782 specimens of Stipa. These data were used to calculate specimen number per year and per prefecture city, which was then used to analyze temporal and spatial distribution patterns of specimen number of each genus.
Carex, Artemisia, Astragalus and Stipa are the dominant and representative genera of grasslands in northern China, however, they are widely distributed throughout the country (Zhao et al., 2020). Especially in Sichuan province and Chongqing City, their specimen number was even higher than those of cities in northern China (Fig. 3). Therefore, considering that studying their distribution patterns only in the grasslands of northern China may lead to stereotypes and biases, collection records were analyzed across the whole of China.

|
| Fig. 1 Temporal distribution patterns of specimen number of Carex (a), Artemisia (b), Astragalus (c) and Stipa (d). The dashed red line is the average annual specimen number in each genus. |

|
| Fig. 2 Species accumulation curve from 1900 to 2020 of Carex, Artemisia, Astragalus and Stipa together. The gray circles show the cumulative number of species over the years. |

|
| Fig. 3 Distribution patterns of specimen number of Carex (a), Artemisia (b), Astragalus (c) and Stipa (d). Small polygons are prefecture-level cities in China. |
To calculate specimen number per species and then analyze potential preference in specimen collection, the Taxonomic Name Resolution Service website (TNRS, http://tnrs.biendata.org/) was used to process the data. First, we combined subspecific taxa to the species level due to the artificiality of the subspecific taxon delimitation criteria (Yang, 2013). All synonyms (former names) were corrected to the accepted Latin names today. We eliminated specimens with no identified species. After the above work, 128,616 plant specimens of 1034 species were obtained, including 42,352 specimens of 476 species of Carex, 50,733 specimens of 194 species of Artemisia, 26,641 specimens of 342 species of Astragalus and 8890 specimens of 22 species of Stipa.
2.2. Explanatory variablesTrait variables were evaluated using two traits: plant height and flowering and fruiting period. For calculations, maximum plant height and the longest flowering and fruiting period were used. Species trait information for Carex, Artemisia, Astragalus and Stipa was obtained from the Chinese Flora (http://www.iplant.cn/).
Geographical variables were determined by examining distribution range and altitudinal range. Distribution of these species at the prefecture-level city was compiled from the Chinese Angiosperm Plant Distribution Database (Lu et al., 2018). The distribution range of each species (dis_range) was calculated by the sum of the area of all the prefecture-level cities where the species were distributed. Altitude data were obtained from the Chinese Flora (http://www.iplant.cn/). The altitudinal range (alt_range) was calculated by the difference between the highest and lowest altitudes of species distribution.
Environmental variables were evaluated by analyzing temperature range and precipitation range of each species. The temperature range of each species distribution (tem_range) was calculated as the difference between the maximum and minimum mean annual temperature in its distribution area. The precipitation range (pre_range) was calculated using the same method. The mean annual temperature and mean annual precipitation were obtained from the WorldClim database (Hijmans et al., 2005).
2.3. Statistical analysisSpecimen number for each year was calculated. Data collected prior to 1900 were excluded as previous studies have shown that during the digitization process collection time for these specimens was incorrectly recorded (Yang, 2013).
A phylogeny for the 1112 species was pruned from mega tree implemented with the option of “tree = GBOTB.Extended.TPL” in V.PhyloMaker2 package, which includes three global plant databases (TPL, LCVP and WP database; Jin and Qian, 2022). It reflects the up-to-date botanical nomenclature (Jin and Qian, 2022). Ordinary least squares model was used to analyze the relationships between specimen number and the explanatory variables. Phylogenetic generalized linear mixed models (PGLMMs) were also used to correct phylogenetic effects, i.e., closely related species tend to share similar traits and distribution range. PGLMMs were implemented using the “pglmm” function in the R package “INLA” and the Variance Co-Variance (VCV) matrix of phylogeny of was added to PGLMMs as random effect (Ives and Helmus, 2011).
Considering the multicollinearity of explanatory variables in multiple regression, Random Forest models were then used to filter and find the most parsimonious multivariate model (Breiman, 2001; Li, 2013). Random Forest models could effectively capture interactions (e.g., the correlation between temperature range and precipitation range of the four genera is equal to or even greater than 0.85) and nonlinear relationships. In addition, the data did not need to follow strict assumptions, e.g., homoscedasticity and normality in errors (Breiman, 2001). For each combination, the Random Forest models were run 1000 times on random splits of the data (50% training data and 50% evaluation data), averaging the Pearson correlation between the predicted and the observed values (specimen number). To check which variables always occurred in the best combinations, the three combinations with highest Pearson correlations were chosen (Liang et al., 2018; Feng et al., 2019).
To achieve the best model fit and to approximate the residuals of the normal distribution, specimen number was log10-transformed. In addition, all explanatory variables were standardized by Z-score in order to reduce the differences between variables and to make variables with different dimensions comparable.
3. Results 3.1. Temporal and spatial preference in specimen collectionCollection of grasslands species in China varied considerably each year from 1900 to 2020 (Fig. 1a–d), with four peak periods: the 1930s, the 1950s–1960s, the 1970s–1980s, and from 2000–present. The highest level of specimen collection for Carex, Artemisia, and Astragalus occurred in the 1950s (Fig. 1a–c). Stipa reached maximum specimen collection during the 1970s (Fig. 1d). Specimen collection of each genus has fluctuated roughly above each mean since the start of the 21st Century.
Although fewer specimens of grasslands species were collected between 1900 and 1940, the rate of species accumulation was relatively rapid (Fig. 2). Between 1940 and 1950, the rate of species accumulation decreased sharply, nearly stagnating. However, from 1950 to 2000, the rate of species accumulation accelerated, with average annual collections reaching maximums for each genus. Over the past 20 years, the rate of species accumulation has begun to decrease.
Specimen number for the four genera of grassland species was higher in northwest China than in southeast China (Fig. 3). The largest number of Carex specimens was collected in Chongqing (2991); followed by Garze Tibetan Autonomous Prefecture in Sichuan Province and Harbin in Heilongjiang Province (Fig. 3a). The largest number of Artemisia specimens was collected in Xilin Gol League in Inner Mongolia Autonomous Region (2813); followed by Garze Tibetan Autonomous Prefecture in Sichuan Province (Fig. 3b). The largest number of Astragalus specimens was collected in Garze Tibetan Autonomous Prefecture in Sichuan Province (1902); followed by Aba Tibetan and Qiang Autonomous Prefecture in Sichuan Province (Fig. 3c). The largest number of Stipa specimens was collected in the Ali region in Tibet Autonomous Region, Xilin Gol League in Inner Mongolia Autonomous Region and Garze Tibetan Autonomous Prefecture in Sichuan Province (Fig. 3d). In many cities of southeastern China, no Stipa specimens have been recorded.
3.2. Trait preference in specimen collectionThe ordinary least squares model and phylogenetic generalized linear mixed models both indicated that specimen number was positively correlated with both plant height and flowering and fruiting period (Fig. 4a and f). The correlations between specimen number and these traits were similar for two genera, i.e., Carex and Artemisia (Fig. 4b, c, g and h). However, Astragalus specimen number was not related to flowering and fruiting period (Fig. 4i). In addition, Stipa specimen number was independent of plant height and flowering and fruiting period (Fig. 4e and j).

|
| Fig. 4 Scatter plots of specimen number and trait variables of Carex (b, g), Artemisia (c, h), Astragalus (d, i), Stipa (e, j) and the four genera (a, f). The black letter is the regression coefficient of the ordinary least squares model (OLS). The red letter is the regression coefficient of phylogenetic generalized linear mixed models (PGLMMs). **, p < 0.01; *, p < 0.05. |
Generally, specimen number of each genus was positively correlated with both temperature range and precipitation range (Fig. 5a and f). However, temperature range was a more important variable for explaining specimen number than precipitation range (Fig. 5a and f), especially for Stipa (Fig. 5e and j).

|
| Fig. 5 Scatter plots of specimen number and environmental range variables of Carex (b, g), Artemisia (c, h), Astragalus (d, i), Stipa (e, j) and the four genera (a, f). The black letter is the regression coefficient of the ordinary least squares model (OLS). The red letter is the regression coefficient of phylogenetic generalized linear mixed models (PGLMMs). Tem_range and pre_range are species' temperature range and precipitation range. **, p < 0.01; *, p < 0.05. |
In addition, specimen number of each genus showed significant positive correlations with distribution range and altitudinal range, although distribution range was more important for explaining specimen number than altitudinal range (Fig. 6a and f). However, the correlation between specimen number and altitudinal range was not statistically significant for Artemisia or Stipa (Fig. 6h and j).

|
| Fig. 6 Scatter plots of specimen number and geographical range variables of Carex (b, g), Artemisia (c, h), Astragalus (d, i), Stipa (e, j) and the four genera (a, f). The black letter is the regression coefficient of the ordinary least squares model (OLS). The red letter is the regression coefficient of phylogenetic generalized linear mixed models (PGLMMs). Dis_range and alt_range are species' distribution range and altitudinal range. **, p < 0.01; *, p < 0.05. |
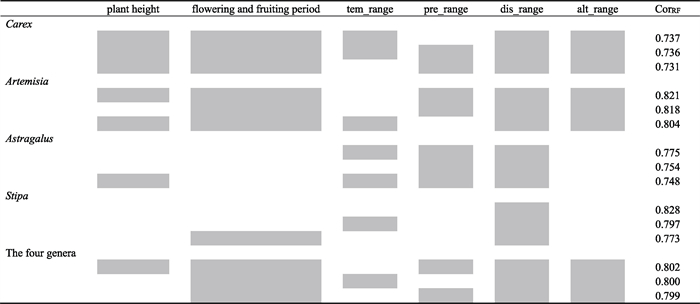
The most important factor in determining whether a grassland specimen was collected was distribution range. Random Forest models showed that the distribution range was always included in the three best combinations of factors, both for each of the genera and for all genera combined (Table 1). The additional factors that were most predictive for whether Carex, Artemisia, and the four genera together were collected were flowering and fruiting period and altitudinal range (Table 1).
|
Our analyses revealed that Astragalus specimen number was not related to flowering and fruiting period (Table 1). In addition, Random Forest models showed that plant height and altitudinal range did not greatly affect whether Stipa specimens were collected (Table 1).
4. DiscussionIn this study, various hypotheses about the formation of specimen collection preference of Carex, Artemisia, Astragalus and Stipa were tested. Environmental range and geographical range of species had significant positive correlations with specimen number. In addition, there were also significant associations between specimen number and species trait factors (i.e., plant height and flowering and fruiting period). Random Forest models indicated that the most important variable that influences specimen collection is distribution range, followed by flowering and fruiting period, and altitudinal range. We, therefore, recommend that future floristic surveys should pay more attention to species with small geographical range, narrow environmental range, as well as short plants and plants with short flowering and fruiting periods.
4.1. Temporal preference in specimen collectionThe study of plant taxonomy has been affected by several factors, including social, technological, political, and economic changes (Chen and Zeng, 1987; Yang, 2013). Accordingly, specimen collection of plant species has varied historically. Here, we found that collection of specimens from four genera of grassland species in China peaked at four points over the past century. These peaks, which are similar to those of angiosperm specimens (Yang, 2013), occurred in the 1930s, 1950s–1960s, 1970s–1980s and the 21st century. In the 1930s specimen collection was spurred by the return of the first group of taxonomists from abroad and increased funding of botanical research from the government, civil society groups, and individuals (Yang, 2013; Jiang et al., 2018). These conditions led to the establishment of plant research institutions and herbariums and made it possible for botanists to collect plant specimens in the field at large scale (Yang, 2013). Specimen number and the accumulation of species sharply decreased in the 1940s–1950s, as the outbreak of the Second Sino-Japanese War (1937–1945) and the Chinese Civil War (1945–1949) made fieldwork dangerous (Yang, 2013). The second peak in the collection of grassland genera was in the 1950s–1960s, when the annual average specimen number of Carex, Artemisia and Astragalus was the largest. This peak corresponds to the liberation of China, a period during which national scientific research gradually resumed (Jiang et al., 2018). For example, from 1958 to 1960 (i.e., the Great Leap Forward) many amateurs were encouraged to participate in plant collections (Yang, 2013). The third peak of grasslands specimen collection—the 1970s–1980s—was driven by state-funded, large-scale scientific research activities (e.g., comprehensive scientific survey of the Qinghai-Tibet Plateau in 1973–1980 and comprehensive investigation in the Hengduan Mountains area in 1980–1985; Yang, 2013). In the 21st century, technological developments, such as advanced herbarium-making equipment, and improved transportation has promoted systematic and accurate collection of specimens in many places that were previously difficult to access (Yao et al., 2022).
Outside China, temporal preference in specimen collection has been driven by similar causes. For example, in New England, specimen collections peaked in the 1900s following the establishment of the New England Botanical Club during the 1890s (Daru et al., 2018). In Australia, South Africa and New England, mass immigration of Europeans after World War Ⅱ brought numerous highly skilled professionals to Australia, which facilitated the collection of plant specimens (Daru et al., 2018). During the South African Apartheid Era (1948–1994), specimen collection efforts decline, mostly due to an economic downturn and concerns for public safety (Daru et al., 2018).
4.2. Trait preference in specimen collectionOur finding that in China specimen number of four grasslands genera is positively correlated with both plant height and flowering and fruiting periods indicates that plant traits influence specimen collection of grasslands species, which supported our hypothesis H(1). An investigation about angiosperm species in China also confirmed this finding, although these correlations were relatively weak (Yang et al., 2021). In addition, collectors have been shown to more frequently collect angiosperm specimens of species with longer flowering and fruiting periods, possibly because these plants are easier to spot than plants without flowers and fruits (Chen et al., 2013). Previous studies have also shown that in the Artic vascular plants are more likely to be collected, possibly due to ease of detectability (Panchen et al., 2019). Trait preference on specimen collection has also been demonstrated in Australia, where botanists have collected fewer large herbaceous plant specimens, potentially because these individuals do not fit nicely onto one herbarium sheet (Schmidt-Lebuhn et al., 2013). Despite these consistent preference in specimen collection based on plant traits, our study indicates that other factors (i.e., environmental and geographical range) exert stronger preference on grassland specimen collection (Fig. 5, Fig. 6). This result may be due to that most Chinese sample collectors are strictly trained and well-organized botanical expeditions, who collected all plants for fully documenting the floras without considering species trait (Yang et al., 2021).
4.3. Environmental and geographical range preference in specimen collectionIn this study, specimen number showed strong positive correlations with both temperature range and precipitation range (Fig. 5), which supported our hypothesis H(2). For example, Artemisia scoparia, which is the Artemisia species with the largest temperature range (-4 ℃–23 ℃), had the largest specimen number. Conversely, Stipa arabica, a species with small temperature and precipitation ranges, is represented by only one specimen. These findings indicate that the wider environmental range of a species, the higher likelihood of it being discovered in different habitats, which makes wide-ranged species have more specimens than those narrow-ranged species (Meineke and Daru, 2021).
There were also significant positive correlations between specimen number and species distribution range and altitudinal range (Fig. 6), which supported our hypothesis H(3). Specifically, species with wider distribution ranges were more frequently collected. That is, despite the appeal of rare species to collectors (de Araujo and Ramos, 2021), specimen number of common species is still higher. This bias against narrow-ranged species has also been demonstrated in animal studies, e.g., in the Brazilian Cerrado, researchers have noted that wide-ranged species of anuran are expected to be recorded earlier than narrow-ranged species (Diniz et al., 2005). Our finding that species with larger altitudinal ranges are more often collected is consistent with previous studies of angiosperms in China (Yang et al., 2021). This altitudinal preference is probably due to the tendency of researchers to study wider altitudinal gradients and higher mountains (Chen et al., 2013). In addition, at high altitudes, the diversity of herbaceous plants is higher, as a result of decreased woody community coverage, increased available light, and reduced human disturbance (Feng et al., 2006; Xu et al., 2008; Luo et al., 2014).
4.4. The three combinations of variables most associated with specimen numberRandom Forest models indicated that the most important factor in explaining specimen collection preference is distribution range. Specifically, our analysis indicates that wide-ranged species are more likely to be collected, which is consistent with previous studies on vascular plants in Switzerland (Chen et al., 2013). However, previous research has suggested that the relationship between specimen number and distribution range may be unimodal, i.e., specimen number of very common species is not very large, which may result from the practice of specimen collectors of avoiding very common species (Yang et al., 2021). In addition, we found that species of Carex and Artemisia with longer flowering and fruiting periods were collected at high numbers, although this was not the case for species of Astragalus and Stipa (Table 1). This discrepancy may be because specimen number was also related to the color or size of flowers and fruits and the flowering or fruiting season (Schmidt-Lebuhn et al., 2013; Yang et al., 2021).
5. ConclusionsIn summary, this study explores the relationships between specimen number of dominant plant species of grasslands in northern China and possible explanatory variables. The results show that species’ trait, environmental range and geographical range all have significant influence on plant specimen collection. Although our study fails to consider social, economic and historical factors that influence specimen collection, our findings provide clear scientific guidance for subsequent specimen collection. We recommend that future studies focus on shorter species, species with shorter flowering and fruiting periods, and narrow-ranged species. The correction of specimen collection preference will also make the results of species distribution models, assessment of threatened species, species evolution and other works based on specimen data more accurate.
AcknowledgementsWe thank the Natural Science Foundation of Inner Mongolia, China (2023JQ01), the National Key R&D Program of China (2019YFA0607103), the Central Government Guides Local Science and Technology Development Fund Projects (2022ZY0224), the Open Project Program of Ministry of Education Key Laboratory of Ecology and Resources Use of the Mongolian Plateau, Hohhot, Inner Mongolia, China (KF2023003), and Major Science and Technology Project of Inner Mongolia Autonomous Region: Monitoring, Assessment and Early Warning Technology Research of Biodiversity in Inner Mongolia (2021ZD0011) for financial support.
CRediT authorship contribution statement
G.F. conceived the research; C.X. collected the data; J.Z., X.D., H.Z., R.D. and G.F. took part in data analysis; J.Z. and X.G. participated in data visualization work; J.Z. wrote initial draft of this manuscript; G.F. and K.M. revised this manuscript; and then, G.F. submitted it finally.
Availability of data and materials
The datasets that support the findings of this study are available on request from the corresponding author, upon reasonable request.
Declaration of competing interest
These authors have no conflict in interest.
Aung, T.S., Hughes, A.C., Khine, P.K., et al., 2023. Patterns of floristic inventory and plant collections in Myanmar. Plant Divers., 45: 302-308. DOI:10.1016/j.pld.2023.01.008 |
Baker, D.J., Maclean, I.M.D., Goodall, M., et al., 2022. Correlations between spatial sampling biases and environmental niches affect species distribution models. Global Ecol. Biogeogr., 31: 1038-1050. DOI:10.1111/geb.13491 |
Bowler, D.E., Callaghan, C.T., Bhandari, N., et al., 2022. Temporal trends in the spatial bias of species occurrence records. Ecography, 2022: e06219. DOI:10.1111/ecog.06219 |
Breiman, L., 2001. Statistical modeling: the two cultures. Stat. Sci., 16: 199-215. DOI:10.1214/ss/1009213726 |
Burton, A.C., 2012. Critical evaluation of a long-term, locally-based wildlife monitoring program in West Africa. Biodivers. Conserv., 21: 3079-3094. DOI:10.1007/s10531-012-0355-6 |
Chen, D.M., Zeng, L.B., 1987. A brief history of botany development in China. J. Cent. South Univ. (Nat. Sci. Ed), 21: 117-127. DOI:10.19603/j.cnki.1000-1190.1987.01.022 |
Chen, G.K., Kery, M., Plattner, M., et al., 2013. Imperfect detection is the rule rather than the exception in plant distribution studies. J. Ecol., 101: 183-191. DOI:10.1111/1365-2745.12021 |
Daru, B.H., Park, D.S., Primack, R.B., et al., 2018. Widespread sampling biases in herbaria revealed from large-scale digitization. New Phytol., 217: 939-955. DOI:10.1111/nph.14855 |
de Araujo, M.L., Ramos, F.N., 2021. Targeting the survey efforts: gaps and biases in epiphyte sampling at a biodiversity hotspot. For. Ecol. Manag., 498: 199544. DOI:10.1016/j.foreco.2021.119544 |
Diniz, J.A.F., Bastos, R.P., Rangel, T., et al., 2005. Macroecological correlates and spatial patterns of anuran description dates in the Brazilian Cerrado. Global Ecol. Biogeogr., 14: 469-477. DOI:10.1111/j.1466-822x.2005.00165.x |
Engemann, K., Enquist, B.J., Sandel, B., et al., 2015. Limited sampling hampers "big data" estimation of species richness in a tropical biodiversity hotspot. Ecol. Evol., 5: 807-820. DOI:10.1002/ece3.1405 |
Feng, G., Yan, H., Yang, X.T., 2019. Climate and food diversity as drivers of mammal diversity in Inner Mongolia. Ecol. Evol., 9: 2142-2148. DOI:10.1002/ece3.4908 |
Feng, J.M., 2008. Spatial patterns of species diversity of seed plants in China and their climatic explanation. Biodivers. Sci., 16: 470-476. DOI:10.3724/SP.J.1003.2008.08027 |
Feng, J.M., Wang, X.P., Xu, C.D., et al., 2006. Altitudinal patterns of plant species diversity and community structure on YuLong Mountains, Yunnan, China. J. Mt. Sci., 43: 39-43. DOI:10.3969/j.issn.1008-2786.2006.01.016 |
Feng, J.M., Xu, C.D., 2009. Large scale distribution pattern of seed plant species richness in China and its relationship with geographical factors. Ecol. Environ. Sci., 18: 249-254. DOI:10.3969/j.issn.1674-5906.2009.01.047 |
Guo, Q.F., Kelt, D.A., Sun, Z.Y., et al., 2013. Global variation in elevational diversity patterns. Sci. Rep., 3: 3007. DOI:10.1038/srep03007 |
He, P., Chen, J., Kong, H.Z., et al., 2021. Important supporting role of biological specimen in biodiversity conservation and research. BCAS, 36: 425-435. DOI:10.16418/j.issn.1000-3045.20210323001 |
Hijmans, Robert, J., Cameron, et al., 2005. Very high resolution interpolated climate surfaces for global land areas. Int. J. Climatol., 25: 1965-1978. DOI:10.1002/joc.1276 |
Hortal, J., Lobo, J.M., Jiménez-Valverde, A., 2007. Limitations of biodiversity databases: case study on seed-plant diversity in Tenerife, Canary Islands. Conserv. Biol., 21: 853-863. DOI:10.1111/j.1523-1739.2007.00686.x |
Inman, R., Franklin, J., Esque, T., et al., 2021. Comparing sample bias correction methods for species distribution modeling using virtual species. Ecosphere, 12: E03422. DOI:10.1002/ecs2.3422 |
Ives, A.R., Helmus, M.R., 2011. Generalized linear mixed models for phylogenetic analyses of community structure. Ecol. Monogr., 81: 511-525. DOI:10.1890/10-1264.1 |
Jiang, C.Y., Yu, W.X., Yang, T., et al., 2018. Geolographical sampling: current status analysis and prediction in China based on Chinese herbaria specimen records. E-Sci. Technolo. Appl., 9: 94-101. DOI:10.11871/j.issn.1674-9480.2018.05.011 |
Jin, Y., Qian, H., 2022. V.PhyloMaker2: an updated and enlarged R package that can generate very large phylogenies for vascular plants. Plant Divers., 44: 335-339. DOI:10.1111/ecog.04434 |
Küper, W., Sommer, J.H., Lovett, J.C., et al., 2006. Deficiency in African plant distribution data-missing pieces of the puzzle. Bot. J. Linn. Soc., 150: 355-368. DOI:10.1111/j.1095-8339.2006.00494.x |
Li, X.H., 2013. Using “random forest” for classification and regression. J. Appl. Entomol., 50: 1190-1197. DOI:10.7679/j.issn.2095-1353.2013.163 |
Liang, C.X., Feng, G., Si, X.F., et al., 2018. Bird species richness is associated with phylogenetic relatedness, plant species richness, and altitudinal range in Inner Mongolia. Ecol. Evol., 8: 53-58. DOI:10.1002/ece3.3606 |
Lu, L.M., Mao, L.F., Yang, T., et al., 2018. Evolutionary history of the angiosperm flora of China. Nature, 554: 234. DOI:10.1038/nature25485 |
Luo, L.M., Miao, Y.J., Wu, J.S., et al., 2014. Variation in the biodiversity of montane shrub grassland communities along an altitudinal gradient in a Lhasa River basin valley. Acat Pratac. Sin., 23: 320-326. DOI:10.11686/cyxb20140638 |
Meineke, E.K., Daru, B.H., 2021. Bias assessments to expand research harnessing biological collections. Trends Ecol. Evol., 36: 1071-1082. DOI:10.1016/j.tree.2021.08.003 |
Meyer, C., Weigelt, P., Kreft, H., 2016. Multidimensional biases, gaps and uncertainties in global plant occurrence information. Ecol. Lett., 19: 992-1006. DOI:10.1111/ele.12624 |
Monsarrat, S., Boshoff, A.F., Kerley, G.I.H., 2019. Accessibility maps as a tool to predict sampling bias in historical biodiversity occurrence records. Ecography, 42: 125-136. DOI:10.1111/ecog.03944 |
Oliveira, U., Paglia, A.P., Brescovit, A.D., et al., 2016. The strong influence of collection bias on biodiversity knowledge shortfalls of Brazilian terrestrial biodiversity. Divers. Distrib., 22: 1232-1244. DOI:10.1111/ddi.12489 |
Panchen, Z.A., Doubt, J., Kharouba, H.M., et al., 2019. Patterns and biases in an Arctic herbarium specimen collection: implications for phenological research. Appl. Plant Sci., 7: e1229. DOI:10.1002/aps3.1229 |
Parnell, J.A.N., Simpson, D.A., Moat, J., et al., 2003. Plant collecting spread and densities: their potential impact on biogeographical studies in Thailand. J. Biogeogr., 30: 193-209. DOI:10.1046/j.1365-2699.2003.00828.x |
Qian, L.S., Shi, H.H., Ou, X.K., et al., 2022. Elevational patterns of functional diversity and trait of Delphinium (ranunculaceae) in hengduan mountains, China. Plant Divers., 44: 20-29. DOI:10.1016/j.pld.2021.11.004 |
Romo, H., Garcia-Barros, E., Lobo, J.M., 2006. Identifying recorder-induced geographic bias in an Iberian butterfly database. Ecography, 29: 873-885. DOI:10.1111/j.2006.0906-7590.04680.x |
Sánchez-Fernández, D., Lobo, J.M., Abellan, P., et al., 2008. Bias in freshwater biodiversity sampling: the case of Iberian water beetles. Divers. Distrib., 14: 754-762. DOI:10.1111/j.1472-4642.2008.00474.x |
Schmidt-Lebuhn, A.N., Knerr, N.J., Kessler, M., 2013. Non-geographic collecting biases in herbarium specimens of Australian daisies (Asteraceae). Biodivers. Conserv., 22: 905-919. DOI:10.1007/s10531-013-0457-9 |
Schmitt, C.J., Cook, J.A., Zamudio, K.R., et al., 2019. Museum specimens of terrestrial vertebrates are sensitive indicators of environmental change in the Anthropocene. Philos. T. R. Soc. B-Biol. Sci., 374: 20170387. DOI:10.1098/rstb.2017.0387 |
Sigler, K., Warren, D., Tracy, B., et al., 2021. Assessing temporal biases across aggregated historical spatial data: a case study of North Carolina's freshwater fishes. Ecosphere, 12: e03878. DOI:10.1002/ecs2.3878 |
Sobral-Souza, T., Stropp, J., Santos, J.P., et al., 2021. Knowledge gaps hamper understanding the relationship between fragmentation and biodiversity loss: the case of Atlantic Forest fruit-feeding butterflies. PeerJ, 9: e11673. DOI:10.7717/peerj.11673 |
Ter Steege, H., Haripersaud, P.P., Banki, O.S., et al., 2011. A model of botanical collectors' behavior in the field: never the same species twice. Am. J. Bot., 98: 31-37. DOI:10.3732/ajb.1000215 |
Tu, Y., 2020. Based on Species Distribution Model Analysis Suitable Distribution Area of Stipa and the Correlation with Climate Factors in China. Beijing Forestry University. https://doi.org/10.26949/d.cnki.gblyu.2020.000921.
|
Vargas, C.A., Bottin, M., Sarkinen, T., et al., 2022. Environmental and geographical biases in plant specimen data from the Colombian Andes. Bot. J. Linn. Soc., 200: 451-464. DOI:10.1093/botlinnean/boac035 |
Vargas, C.A., Bottin, M., Sarkinen, T., et al., 2024. How to fill the biodiversity data gap: is it better to invest in fieldwork or curation?. Plant Divers., 46: 39-48. DOI:10.1016/j.pld.2023.06.003 |
Wu, Z.Y., Raven, P.H. (Eds.), 2013. Flora of China. Science Press, Beijing and Missouri Botanical Garden Press, St. Louis.
|
Xiao, C., 2018. Laying foundation for each basis: preface of the special issue “National Specimen Information Infrastructure and Application”. E-Sci. Technolo. Appl., 9: 3-6. DOI:10.11871/j.issn.1674-9480.2018.05.001 |
Xiao, C., Li, M.Y., Ye, F., et al., 2018. Exploration of the development direction of NSⅡ based on tens of millions of specimen records. E-Sci. Technolo. Appl., 9: 7-26. DOI:10.11871/j.issn.1674-9480.2018.05.002 |
Xu, C.D., Feng, J.M., Wang, X.P., et al., 2008. Vertical distribution patterns of plant species diversity in northern Mt, Gaoligong, Yunnan Province. Chin. J. Ecol., 27: 323-327. |
Yang, W.J., 2013. Geographical Sampling Bias in the Collections of Chinese Plants and its Impacts on the Analysis of Biodiversity Patterns. University of Chinese Academy of Sciences.
|
Yang, W.J., Liu, D.D., You, Q.H., et al., 2021. Taxonomic bias in occurrence information of angiosperm species in China. Sci. China Life Sci., 64: 584-592. DOI:10.1007/s11427-020-1821-x |
Yang, W.J., Ma, K.P., Kreft, H., 2014. Environmental and socio-economic factors shaping the geography of floristic collections in China. Global Ecol. Biogeogr., 23: 1284-1292. DOI:10.1111/geb.12225 |
Yao, T.D., Wang, W.C., An, B.S., et al., 2022. The scientific expedition and research activities on the Tibetan Plateau in 1949–2017. Acta Geograph. Sin., 77: 1586-1602. DOI:10.11821/dlxb202207002 |
Ying, J.S., 2001. Species diversity and distribution pattern of seed plants in China. Biodivers. Sci., 9: 393-398. DOI:10.3321/j.issn:1005-0094.2001.04.011 |
Zhang, Y.B., Du, H.D., Jin, X.H., et al., 2015. Species diversity and geographical distribution of wild orchids in China. Chin. Sci. Bull., 60: 179-188. DOI:10.1360/n972014-00480 |
Zhao, Y.Z., Zhao, L.Q., Cao, R., 2020. Flora Intramongolica. Typis Intramongolicae Popularis, third ed. Inner Mongolia People's Publishing House, Huhhot.
|
Zizka, A., Antonelli, A., Silvestro, D., 2021. Sampbias, a method for quantifying geographic sampling biases in species distribution data. Ecography, 44: 25-32. DOI:10.1111/ecog.05102 |
Zu, K.L., Chen, F.S., Li, Y.Q., et al., 2024. Climate change impacts flowering phenology in Gongga Mountains, Southwest China. Plant Divers. DOI:10.1016/j.pld.2023.07.007 |