b. Guangdong Zhanjiang Mangrove National Nature Reserve Administration, Zhanjiang 524088, PR China
Mangrove plants, being at the land–sea interface, are inevitably associated with and influenced by shallow seawater and tides with salinity. Salinity is among the most critical environmental factors limiting the growth and development of mangroves (Lugo and Snedaker, 1974). In general, mangrove plants grow optimally between the 5–20 ppt salinity range, while the majority of plants can survive under a salinity level of 35 ppt (Patel et al., 2010; Wang et al., 2011; Kodikara et al., 2017). Excessive water salinity can cause stunted growth (Parida et al., 2004), reduced biomass (Ball, 2002; Hoppe-Speer et al., 2011), impaired photosynthesis (Naidoo et al., 2002; Parida et al., 2004), peroxidized cell membrane lipids (Silva et al., 2023), unbalanced reactive oxygen species generation (Barnuevo and Asaeda, 2018), and interferes with water and nutrition uptake by the root system, resulting in very low survival rates (Ball, 2002; Kodikara et al., 2017; Cao et al., 2023). There are significant interspecific differences in salt tolerance of mangroves, which regulate the response and competitive ability of mangrove species to salinity gradients (Costa et al., 2015; Dangremond et al., 2015) and thus influence species distribution and flora composition (Bunt et al., 1982; Ball and Pidsley 1995; Torres-Fernández del Campo et al., 2018).
Water salinity in mangroves varies over time, with fluctuations depending on the climatic and hydrological characteristics of the coastal environment (Lin and Sternberg, 1993; Medina-Gómez et al., 2014). Salinity fluctuation may affect mangrove seedling morphology and physiology as much as annual mean salinity (Bompy et al., 2014; Wang et al., 2020). Exposure to salinity variation requires organisms to implement the necessary and energy-consuming mechanisms to counteract ion and water fluxes (Lin and Sternberg, 1993; Kamer and Fong, 2000; Xu et al., 2020). The mechanisms involve significant functional, morphological, and ultrastructural modifications of specialized osmoregulatory tissues and cells (Tan et al., 2013; Theuerkauff et al., 2018). Besides, salinity fluctuation may also influence species richness and floristic diversity (Chesson, 1990; Ball, 1998). Therefore, taking into account the salinity fluctuations in the field is important for a better understanding of ecosystem productivity and biodiversity in the long term. However, water salinity fluctuation in mangroves has rarely been quantified due to a lack of salinity data from continuous monitoring during an extended time period.
Due to habitat specificity, species richness in mangroves is relatively low compared to other tropical and subtropical forests (Ricklefs and Latham, 1993; Duke et al., 1998). However, floristic diversity has a large influence on ecosystem structural diversity and function in mangroves (Duke et al., 1998; Tomlinson, 2016). Species zonation has been commonly found in intertidal wetlands, which are shaped by the interactions among flooding, salinity and species competition (Duke et al., 1998; Engels et al., 2011). Altering floristic composition along river estuaries have also been found to be related to salinity gradients (Ball and Pidsley, 1995; Costa et al., 2015). Despite these well recognized species distribution patterns, the effects of salinity on mangrove floristic diversity are not fully understood, partly due to the spatial and temporal heterogeneity of salinity. Additionally, studies on the relationship between salinity and floristic diversity have mainly been constrained to river estuaries, which showed that mangrove species abundance was maximal in the intermediate parts of river estuaries with moderate salinities, and minimal in upstream and downstream parts experiencing prolonged exposure to either freshwater or hypersaline conditions (Ball, 1998; Xu et al., 2020). Therefore, conducting studies in geomorphologic settings other than river estuaries and measuring salinity at different temporal and spatial scales are necessary for better understanding the mechanisms of mangrove floristic diversity.
In this study, we monitored water salinity at a 10-min interval through 1 year at three mangrove catchment areas, which are located at the inner part, middle part, and outer part, respectively, of Dongzhai Bay, Hainan, China. The richness of mangrove community types and dominant species of the three catchment areas were also investigated. We aimed to demonstrate the spatial and temporal variation of water salinity in mangroves at a fine scale over an extended time period and to reveal the linkages between salinity pattern and mangrove floristic diversity within a bay.
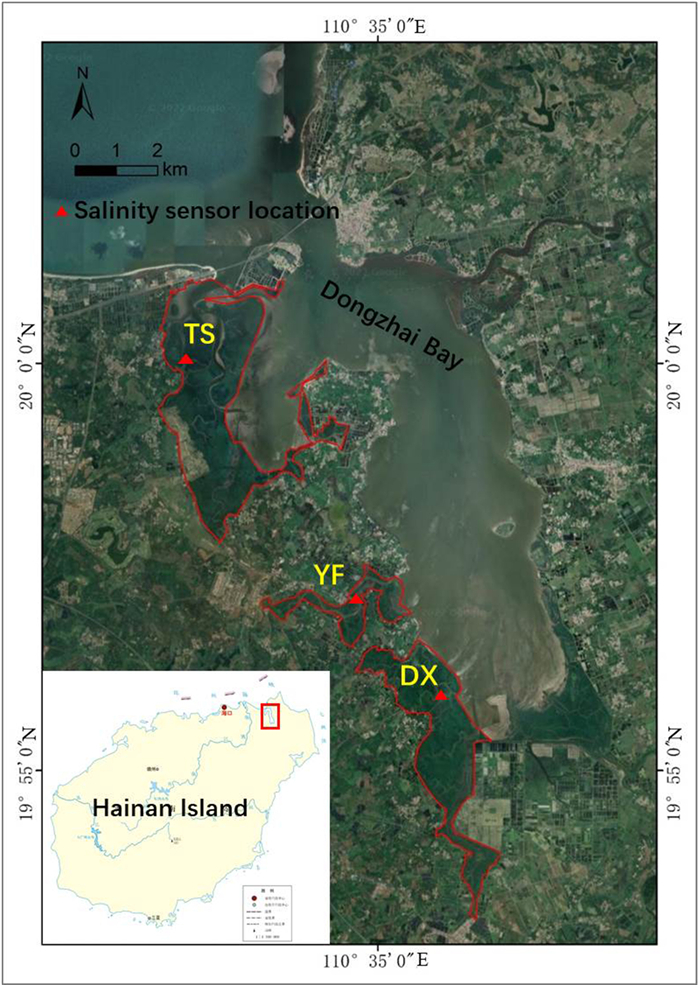
2. Materials and methods 2.1. Study siteThe study was carried out at Dongzhai Harbor National Natural Reserve (19°55′ N, 110°36′ E), Hainan Island, China (Fig. 1). The reserve covers an area of 3337 ha, and has one of the most extensive mangrove areas and most mangrove species (25 in total including nine introduced species) in China. Mangrove forests in the reserve comprise mainly naturally occurring mono-species stands of Ceriops tagal, Bruguiera sexangula, Rhizophora stylosa, Avicennia marina and Kandelia obovata, and mixed-species communities. The mean annual air temperature is 23.5 ℃, with a maximum monthly mean of 28.4 ℃ in July and a minimum monthly mean of 17.1 ℃ in January. The mean annual rainfall is 1676 mm, with a rainy season between May and October. The tides are irregularly semi-diurnal, with an average range of about 0.89 m.
|
Fig. 1 Three mangrove catchment areas at the west side of Dongzhai Bay, where water salinity and mangrove community types and dominant species were investigated.  |
Three mangrove catchment areas on the west side of Dongzhai Bay were selected for this study. These areas represent the outer part (TS site), middle part (YF site), and inner part (DX site) of the bay, respectively (Fig. 1).
2.2. Water salinity measurementThree salinity data loggers (HOBO U24-002-C, USA) were placed in three mangrove forests within the three selected catchment areas to measure and record water salinity at an interval of 10 min. The loggers were bound on mangrove tree stems vertically with the salinity sensors being located right upon the soil surface. The loggers were placed in the field from 2017 to 2018 for a whole year to cover different seasons. Data were downloaded every one or two months. However, data loggers, which stop working and/or get damaged at high temperatures (> 36 ℃), were retrieved from the field if they were found to stop working, and returned to the field in October. Therefore, salinity data in the hottest months (July, August and September) are generally lacking.
Because the loggers were placed on the soil surface of mangrove forests, the salinity data measured during tidal water inundation of soil surface were extracted for analysis, and the salinity data recorded before tides came in or after tides went out of mangrove forests were discarded. The timing of tides coming in or leaving mangrove forests was recognized from a sharp increase of salinity from near zero or a sharp decrease of salinity to near zero.
To catch the full range of diurnal water salinity variation in open water adjacent to mangroves, in November 2019 one salinity data logger was tagged to a floater and placed in open water adjacent to mangroves at the YF site with the salinity sensor inundated for the whole period.
2.3. Determination of the richness of mangrove community types and dominant speciesIn 2014, the three mangrove catchment areas on the west side of Dongzhai Bay were investigated for the richness of community types and dominant species by field survey assisted with SPOT-5 remote sensing imagery with a resolution of 5 m. Boundaries of different community types were recognized from SPOT-5 remote sensing imagery by visual interpretation, then verified or corrected by field inspection, and the species composition of each community type was determined by field survey. In mixed-species communities, species dominance was visually determined according to the Braun-Blanquet cover-abundance approach with modifications (Braun-Blanquet, 1932). Briefly, representative plots of 10m × 10 m were selected in each community, and species having more than 5 shoots in each plot and covering (shoot-area projection) more than 10% of plot area were recognized as dominant species. The community type was named after dominant species by the order of dominance. For extensive surveys, this method is time-efficient and provides sufficiently accurate baseline data to graphically elucidate species-environment relationships (Wikum and Shanholtzer, 1978). The diversity of community types in each catchment was indicated by the Shannon–Wiener Index (H′) and calculated as:

|
where Pi indicates the area percentage of community i in total mangrove area in that catchment, and N indicates the number of community types in that catchment.
2.4. Data collection of tide height and rainfallData of hourly tide height was extracted from the tide table of Puqian Harbor which is located at the outlet of Dongzhai Bay. Note that the data of hourly tide height extracted from tide tables are predicted data only, based on astronomic effects on tide activities; therefore, the predicted tide height may deviate slightly from the actual tide height. Data of monthly rainfall during the study period were obtained from a local meteorological station, located around 3 km from the YF site.
2.5. Statistical analysisIntra-month salinity fluctuation and annual salinity fluctuation were determined as the standard deviation of salinity in a month or in a year. The differences of salinity and salinity fluctuation among different sites were determined by one-way analysis of variance (ANOVA). The differences of salinity among different months and seasons were also determined by one-way ANOVA. The relationship between hourly tide height and hourly mean salinity in open water was determined by linear correlation. All statistical analyses were conducted using R statistical software at a significance level of 0.05 (R Core Team, 2014).
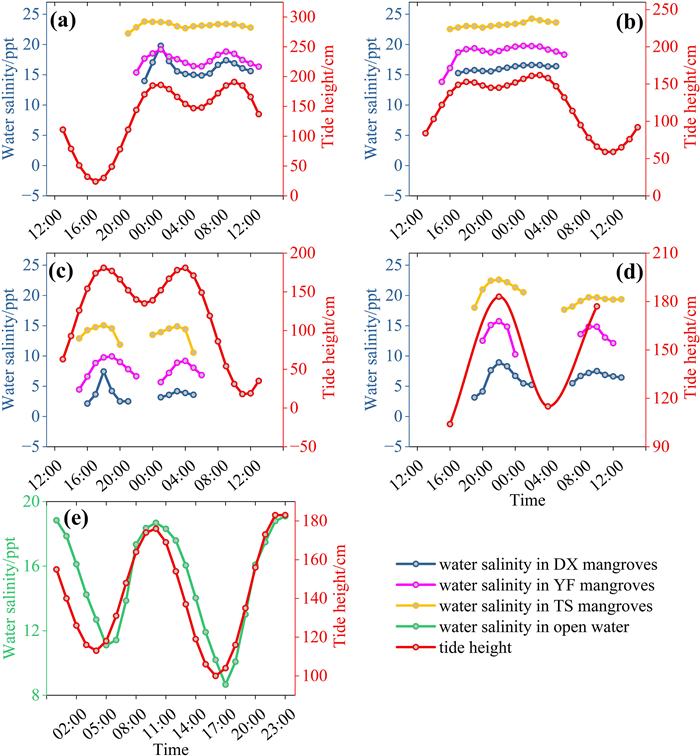
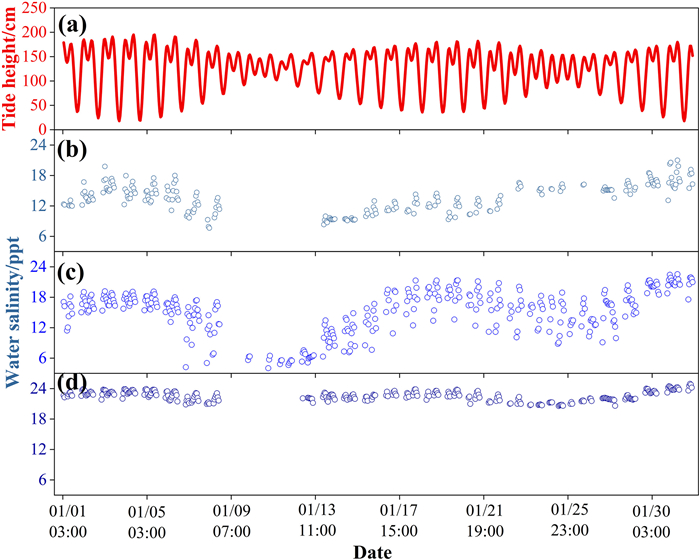
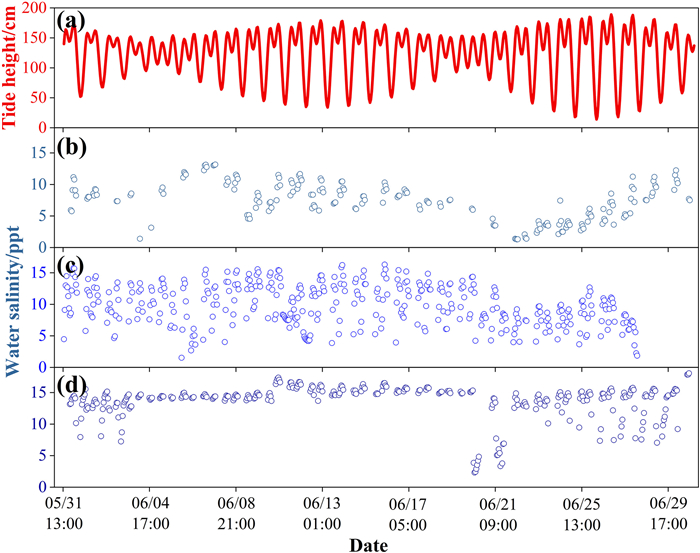
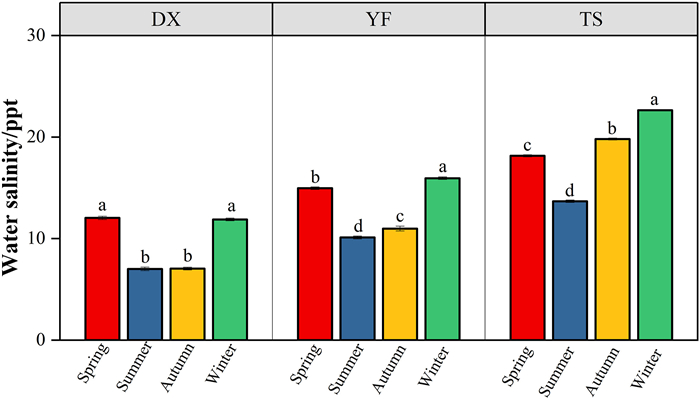
3. Results 3.1. The temporal and spatial patterns of water salinity in mangrovesAt the diurnal scale, water salinity in mangroves changed synchronously with tide height at all three sites, with the maximum salinity occurring at peak tide (Fig. 2a–d). Such a diurnal salinity-tide synchronous pattern was more obviously observed from a salinity data logger placed in adjacent open water with full-time water inundation, in which the correlation between water salinity and tide height was significant and high (p < 0.001, R = 0.875; Fig. 2e). Therefore, the water salinity that mangroves experienced (when tides were higher than mean sea level, the threshold for mangrove growth) was higher than the daily mean of water salinity measured in adjacent open water (Fig. 2e). At the intra-month scale, water salinity variation generally followed tidal cycles in the dry season, with higher salinity occurring during spring tides and lower salinity during neap tides (Fig. 3). However, such a pattern was not obvious in the wet season (Fig. 4). At the inter-month and seasonal scales, water salinity was higher in winter (from December to February) and spring (from March to May) than in summer (from Jun to August) and autumn (from September to November) (p < 0.05; Figs. 5 and S1). The monthly and seasonal variation of water salinity showed an opposite trend with rainfall, which was higher in summer and autumn and lower in winter and spring (Fig. S2).
|
| Fig. 2 Diurnal variation of water salinity and tide height within three mangrove catchment areas in the inner (DX), middle (YF), and outer (TS) parts of Dongzhai Bay during four typical months (a–d) and in adjacent water (e). January (a), April (b), June (c) and October (d) represent typical months in winter, spring, summer and autumn, respectively. In panel a–d, water salinity was not recorded after tides went out of mangroves, while in panel e, complete salinity data were recorded with a data logger inundated in water for the entire day. |
|
| Fig. 3 Intra-month variation of tide height (a) and water salinity in the inner (DX) (b), middle (YF) (c) and outer (TS) (d) parts of Dongzhai Bay in a typical month (January) of the dry season. Date on the horizontal coordinate is expressed as month/day/hour. |
|
| Fig. 4 Intra-month variation of tide height (a) and water salinity in the inner (DX) (b), middle (YF) (c) and outer (TS) (d) parts of Dongzhai Bay in a typical month (June) of the wet season. Date on the horizontal coordinate is expressed as month/day/hour. |
|
| Fig. 5 Seasonal variation in water salinity (mean ± SE) within three mangrove catchment areas in the inner (DX), middle (YF), and outer (TS) parts of Dongzhai Bay. Different lowercase letters above columns denote significant differences in water salinity among different seasons at p < 0.05 level. |
The annual average of intra-month salinity fluctuation was highest at the YF site, which is located at the middle part of the bay, and lowest at the TS site, which is located at the outer part of the bay (p < 0.05; Table 1). There was no significant difference in intra-month salinity fluctuation among months (p > 0.05). The annual salinity fluctuation showed a similar spatial pattern as the monthly mean of intra-month salinity fluctuation. At different time scales (diurnal, monthly, seasonal and annual), the mean and maximum salinity showed the same spatial pattern, i.e., highest at the TS site, which is located at the outer part of Dongzhai Bay, intermediate at the YF site, and lowest at the DX site, which is located at the inner part of the bay (p < 0.05; Figs. Figs. 2 and 5 and S1; Table 1).
| Period | Mean water salinity ± SE (ppt) | Salinity fluctuation indicated as standard deviation | Minimum water salinity (ppt) | Maximum water salinity (ppt) | |||||||||||
| DX | YF | TS | DX | YF | TS | DX | YF | TS | DX | YF | TS | ||||
| January | 13.82 ± 0.08c | 15.46 ± 0.10b | 22.65 ± 0.02a | 2.75 | 4.24 | 0.98 | 7.43 | 3.23 | 9.90 | 21.83 | 22.62 | 24.86 | |||
| February | 15.44 ± 0.06c | 19.25 ± 0.10b | 23.49 ± 0.03a | 1.98 | 2.71 | 1.09 | 10.29 | 4.30 | 21.14 | 19.91 | 22.49 | 25.32 | |||
| March | 14.87 ± 0.06c | 17.69 ± 0.04b | 19.51 ± 0.06a | 2.49 | 1.73 | 2.41 | 7.47 | 1.94 | 9.49 | 21.50 | 22.17 | 24.94 | |||
| April | 14.06 ± 0.12c | 16.94 ± 0.08b | 20.19 ± 0.09a | 4.34 | 3.78 | 3.63 | 2.32 | 1.28 | 5.13 | 21.00 | 21.06 | 25.57 | |||
| May | 6.41 ± 0.12c | 10.44 ± 0.11b | 14.34 ± 0.05a | 4.05 | 5.03 | 1.88 | 0.67 | 0.81 | 5.27 | 16.41 | 18.81 | 20.23 | |||
| June | 7.54 ± 0.10c | 10.11 ± 0.07b | 13.70 ± 0.07a | 3.02 | 3.28 | 2.87 | 0.83 | 1.19 | 2.07 | 13.39 | 16.55 | 18.16 | |||
| July | 5.11 ± 0.14 | 13.62 ± 0.13 | 2.19 | 3.59 | 1.03 | 0.95 | 9.90 | 18.16 | |||||||
| October | 5.49 ± 0.11c | 9.50 ± 0.19b | 18.35 ± 0.10a | 2.12 | 5.03 | 3.39 | 1.13 | 0.49 | 7.62 | 9.11 | 16.70 | 25.05 | |||
| November | 7.31 ± 0.08c | 11.93 ± 0.15b | 20.54 ± 0.05a | 3.79 | 5.03 | 2.68 | 1.19 | 0.89 | 10.55 | 17.02 | 18.03 | 25.01 | |||
| December | 8.98 ± 0.09c | 14.98 ± 0.10b | 22.17 ± 0.05a | 4.30 | 4.11 | 2.50 | 1.05 | 2.83 | 12.31 | 18.51 | 21.84 | 26.47 | |||
| Annual mean | 10.36 ± 0.05c | 14.03 ± 0.04b | 19.32 ± 0.03a | 3.10 ± 0.30 ab | 3.87 ± 0.38a | 2.50 ± 0.30b | |||||||||
| Annual | 5.01 | 5.10 | 4.22 | ||||||||||||
| Note: Different lowercase letters in each row denote significant differences in water salinity between catchment areas at p < 0.05 level. | |||||||||||||||
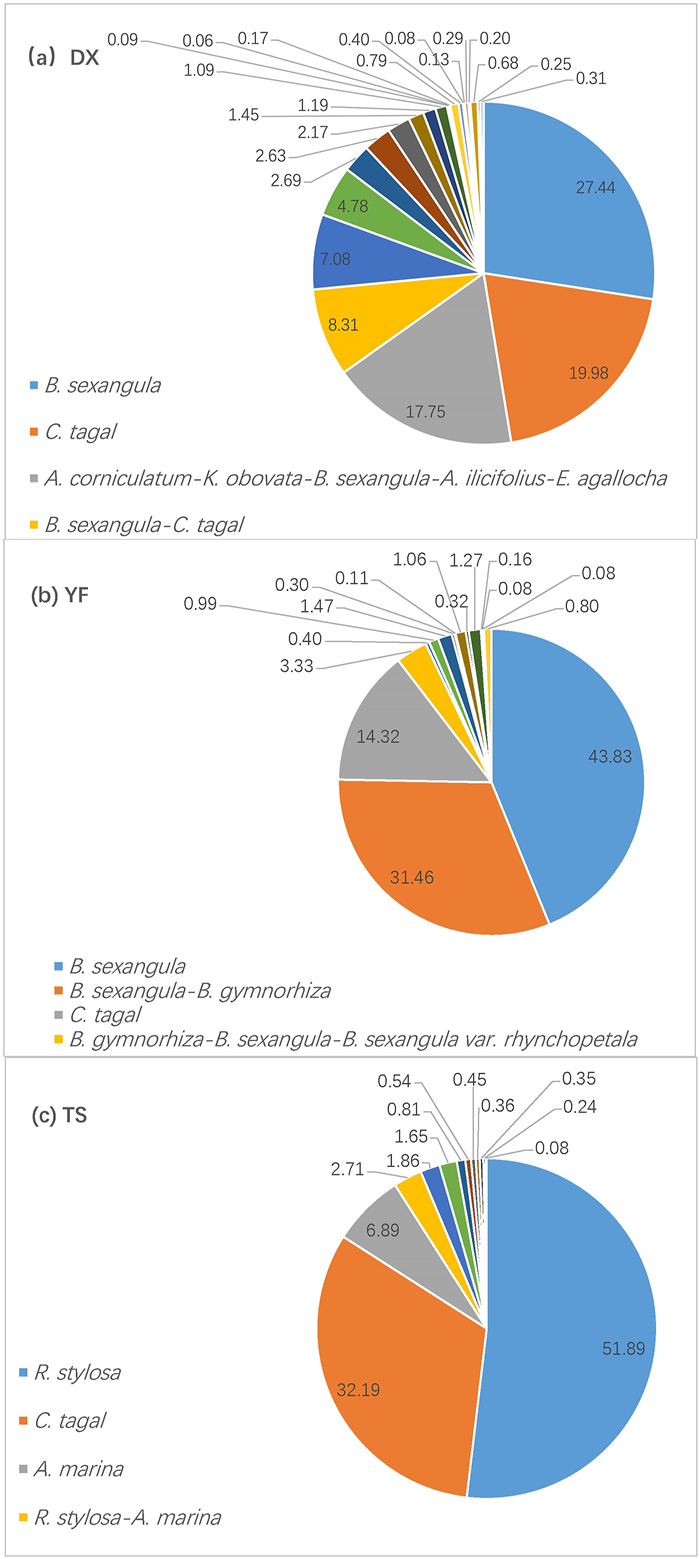
The numbers of mangrove community types and dominant species were lowest in the TS catchment, where water salinity level was highest and salinity fluctuation was lowest, and the numbers were highest in the DX catchment, where water salinity level was lowest and salinity fluctuation was intermediate (Tables 1–3). Moreover, the area distribution of community types was most even in the DX catchment, intermediate in the YF catchment and least even in the TS catchment (Fig. 6). The area of the two largest community types accounted for 47%, 75% and 84% of the total mangrove area in the DX, YF and TS catchments, respectively (Fig. 6). The Shannon–Wiener diversity Index (H′) based on the area distribution of different community types showed that H′ was highest at DX (1.95), intermediate at YF (1.45), and lowest at TS (1.29).
| No. | DX | YF | TS |
| 1 | Bruguiera sexangula | Bruguiera sexangula | Bruguiera sexangula |
| 2 | Kandelia obovata | Kandelia obovata | Kandelia obovata |
| 3 | Ceriops tagal | Ceriops tagal | Ceriops tagal |
| 4 | Aegiceras corniculatum | Aegiceras corniculatum | Aegiceras corniculatum |
| 5 | Rhizophora stylosa | Rhizophora stylosa | Rhizophora stylosa |
| 6 | Sonneratia caseolaris | Sonneratia caseolaris | Bruguiera sexangula var. rhynchopetala |
| 7 | Acanthus ilicifolius | Bruguiera gymnorhiza | Bruguiera gymnorhiza |
| 8 | Pongamia pinnata | Sonneratia apetala | Avicennia marina |
| 9 | Sonneratia apetala | Nypa fruticans | Hibiscus tiliaceus |
| 10 | Avicennia marina | Excoecaria agallocha | |
| 11 | Lumnitzera racemosa | Bruguiera sexangula var. rhynchopetala | |
| 12 | Excoecaria agallocha | ||
| 13 | Hibiscus tiliaceus | ||
| 14 | Thespesia populnea | ||
| 15 | Acrostichum aureum |
| No. | DX | YF | TS |
| 1 | B. sexangula | B. sexangula | B. sexangula |
| 2 | C. tagal | C. tagal | C. tagal |
| 3 | A. corniculatum | A. corniculatum | R. stylosa |
| 4 | R. stylosa | K. obovata | A. marina |
| 5 | A. marina | R. stylosa | B. sexangula-B. gymnorhiza |
| 6 | L. racemosa | S. caseolaris | B. sexangula-B. sexangula var. rhynchopetala |
| 7 | K. obovata | N. fruticans | R. stylosa-A. marina |
| 8 | E. agallocha | B. sexangula-B. gymnorhiza | R. stylosa-B. sexangula-B. sexangula var. rhynchopetala-K. obovata |
| 9 | S. apetala | B. sexangula-K. obovata-A. corniculatum | R. stylosa-C. tagal-A. marina |
| 10 | B. sexangula-K. obovata-A. corniculatum | B. sexangula-S. apetala-A. corniculatum | R. stylosa-C. tagal-A. marina-K. obovata |
| 11 | B. sexangula-S. apetala-A. corniculatum | R. stylosa-A. corniculatum | H. tiliaceus-K. obovata-R. stylosa-A. marina |
| 12 | B. sexangula-C. tagal | K. obovata-A. corniculatum | B. gymnorhiza-B. sexangula-B. sexangula var. rhynchopetala |
| 13 | S. caseolaris-S. apetala | E. agallocha-N. fruticans-A. corniculatum | A. corniculatum-B. sexangula-B. sexangula var. rhynchopetala-B. gymnorhiza |
| 14 | B. sexangula-K. obovata | S. caseolaris-K. obovata | |
| 15 | B. sexangula-L. racemosa | B. sexangula-B. sexangula var. rhynchopetala | |
| 16 | A. corniculatum-K. obovata-B. sexangula-A. ilicifolius-E. agallocha | B. gymnorhiza-B. sexangula-B. sexangula var. rhynchopetala | |
| 17 | C. tagal-L. racemosa | ||
| 18 | L. racemosa-A. corniculatum-S. apetala-K. obovata | ||
| 19 | L. racemosa-A. corniculatum-E. agallocha | ||
| 20 | L. racemosa-A. corniculatum | ||
| 21 | P. pinnata-S. caseolaris-S. apetala-H. tiliaceus | ||
| 22 | P. pinnata-T. populnea-S. caseolaris-S. apetala-A. corniculatum-A. aureum | ||
| 23 | A. corniculatum-A. aureum-C. tagal | ||
| 24 | S. apetala-B. sexangula-A. corniculatum-H. tiliaceus-L. racemosa |
|
| Fig. 6 Area distribution (%) of different mangrove communities in three catchment areas in the inner (DX), middle (YF), and outer (TS) parts of Dongzhai Bay. In each panel, only the four community types with the largest area distribution are listed. |
Our study monitored variation in water salinity within mangroves at a resolution as fine as 10-min intervals over one year, which covered different time scales from diurnal to intra-month to seasonal. We found that the temporal variation in water salinity in mangroves was driven by different factors at different time scales. At the diurnal scale, water salinity in mangroves was regulated predominantly by tidal cycles with water salinity varying synchronously with tide height (Fig. 2). Such a tidal-driven diurnal pattern of salinity has also been found in other studies (Hoguane et al., 1999; Xu et al., 2020; Atekwana et al., 2022), but there has been hardly any study demonstrating salinity variation at the intra-month scale. We showed that water salinity variation within a month was driven mainly by tidal cycles in the dry season, with higher water salinity occurring during spring tides and lower salinity occurring during neap tides (Fig. 3). However, such an intra-month pattern was not observed in the wet season, possibly due to the interference of increased rainfall (Fig. 4). The effect of rainfall on water salinity was more pronounced at the monthly and seasonal scales, at which the temporal pattern of water salinity showed an opposite trend to monthly rainfall, with lower salinity occurring in the wet season from June to November (summer and autumn) and higher salinity in the dry season (Figs. 5, S1 and S2). Therefore, to get a complete picture of the saline environment that mangroves experience, it is necessary to measure salinity at different time scales.
Water salinity in open water adjacent to mangroves has commonly been measured as a proxy of water salinity in mangroves (Hoguane et al., 1999; Xu et al., 2020). However, our study showed that the water salinity that mangroves experience is higher than the daily mean of salinity in adjacent open water. We found water salinity was higher when tide height was above mean sea level (when mangroves ground being inundated) and salinity was lower when tide height was below mean sea level (when mangroves ground being exposed) (Fig. 2e). Therefore, to better reflect the saline environment that mangroves experience, water salinity should be measured in mangrove forests rather than in adjacent open water.
Salinity fluctuation in coastal areas has been commonly recognized (Lin and Sternberg, 1993; Wang et al., 2020; Bompy et al., 2014), but it has rarely been quantified. By quantifying salinity fluctuation as the standard deviation of water salinity within each month and within a year, our study showed that salinity fluctuation was lowest at the outer part of the bay (TS site), where the salinity level was highest, and salinity fluctuation was highest at the middle part of the bay (YF site), where the salinity level was intermediate (Table 1). Such a spatial pattern of salinity fluctuation may result from different intensities of interaction between seawater and freshwater, with the strongest interaction in the middle part of the bay inducing the highest fluctuation of water salinity.
Water salinity gradient within the bay showed a different spatial pattern from salinity fluctuation. Specifically, the salinity level was highest at the outer part and lowest at the inner part of the bay (Table 1). Salinity gradients are one of the defining features of estuaries, and are associated with the relative proportions of freshwater and seawater along the transition from river to ocean (Cloern et al., 2017). A decreasing salinity gradient from the mouth of estuary to the upstream part of the river is typical for estuaries (Ball, 1998; Duke et al., 1998; Cloern et al., 2017). A bay is usually composed of several estuaries. When tides come in from the outlet of the bay, freshwater from rivers might be retained within the bay and distributed mostly at the inner part of the bay, resulting in the lowest salinity at the inner part of the bay. A similar spatial pattern of decreasing water salinity from the outlet to the inner part of a lagoon has also been observed in Sri Lanka (Chandrasekara et al., 2016), however, it remains unclear whether the salinity gradient within a bay is affected by the location of estuaries.
In river estuaries, salinity gradient has been recognized as the most important factor affecting mangrove species distribution and species richness (Duke et al., 1998). Studies have found that species abundance is maximal in areas with moderate salinities and minimal in areas experiencing prolonged exposure to either freshwater or hypersaline conditions (Ball, 1998; Xu et al., 2020). The optimal salinity range for the growth of most mangrove species has been reported to be between 5 and 20 ppt, and within this range, most species grow best in relatively low salinity (Duke et al., 1998; Wang et al., 2011). In the present study, the annual means of water salinity observed at three study sites fall within this optimal salinity range. Consistently, the numbers of dominant species and community types were highest in the catchment area with lowest salinity and lowest in the catchment area with highest salinity (Tables 1–3). Therefore, salinity gradient may also play a dominant role in species distribution and floristic diversity within a bay, similar to river estuaries.
Salinity fluctuation is characteristic of mangrove habitats. However, the effects of salinity fluctuation on mangrove plant growth and distribution have not been commonly investigated and results are inconsistent. Some studies suggest that salinity fluctuation may be more difficult to cope with than high salinity due to the high energetic cost of acclimation investments (Hogarth, 2007; Krauss et al., 2008). Accordingly, studies have shown that fluctuating salinity negatively affects mangrove photosynthesis and growth rate (e.g. Lin and Sternberg, 1993). Other studies have shown that daily salinity fluctuation does not significantly affect plant growth or the outcome of intraspecific interactions (Ma et al., 2022). Some authors have inferred that under fluctuating salinity, plants growing under saline or hypersaline water can use times when salinity is low to take up water and thus facilitate growth (Orcutt and Nilsen, 2000; Kathiresan and Bingham, 2001; Bompy et al., 2014; Wang et al., 2020). Based on the supposedly positive relationship between salinity fluctuation and plant growth, studies suggest that seasonal fluctuations in salinity may facilitate the staggered use of resources by different true mangrove species, thus contributing to the maintenance of richness and diversity (Ball, 1998). Chesson (1990) also suggested that if environmental fluctuations allow different species to have a relative competitive advantage over others at different times of the year, temporal variation in salinity can contribute to species’ maintenance of diversity and richness. In our study, salinity level appears to play a greater role than salinity fluctuation in affecting mangrove species richness. For instance, the inner part of the bay had an intermediate salinity fluctuation but the highest species richness, corresponding to the lowest salinity level in that catchment.
We recognize that this study has limitations and that our conclusions require careful consideration. Firstly, despite the high intensity in water salinity sampling, our conclusions are based on a single year of observations. Multi-year measurements are needed in future studies to cover the inter-year variation in water salinity. Secondly, salinity sensors were placed on the soil surface of mangroves. This placement limited our ability to monitor salinity in mangrove rhizospheres and resulted in a loss of data during the hottest months as high air temperature impaired the data loggers. Improvements in measurement are needed in the future to capture salinity fluctuation both in aboveground tides but also within the rhizosphere of mangroves to better understanding the effects of salinity fluctuation on mangroves.
5. ConclusionBy monitoring water salinity at an interval of 10-min over one year in three mangrove catchment areas within Dongzhai Bay, we showed temporal and spatial patterns of water salinity at different scales and its relationship to mangrove species richness. Our research shows that the diurnal variation and dry-season intra-month variation of water salinity in mangroves are driven mainly by tidal cycles, while the seasonal variation of water salinity is mainly driven by rainfall. Spatially, an increasing water salinity gradient was found from the inner part to the outer part of the bay, which was associated with the varying proportions of freshwater versus seawater. Therefore, it is necessary to measure water salinity within mangrove forests at different time scales and different locations to get a complete picture of the saline environment that mangroves experience. Higher mangrove species richness was linked to lower salinity level along with higher salinity fluctuation. However, salinity level may play a greater role than salinity fluctuation in affecting mangrove species richness.
Atekwana, E.A., Ramatlapeng, G.J., Ali, H.N., et al., 2022. Tide-salinity patterns reveal seawater-freshwater mixing behavior at a river mouth and tidal creeks in a tropical mangrove estuary. J. Afr. Earth Sci., 196: 104684. DOI:10.1016/j.jafrearsci.2022.104684 |
Ball, M.C., Pidsley, S.M., 1995. Growth responses to salinity in relation to distribution of two mangrove species, Sonneratia alba and S. lanceolata, in northern Australia. Funct. Ecol., 9: 77-85. DOI:10.2307/2390093 |
Ball, M.C., 1998. Mangrove species richness in relation to salinity and waterlogging: a case study along the Adelaide River floodplain, northern Australia. Global Ecol. Biogeogr., 7: 73-82. DOI:10.2307/2997699 |
Ball, M.C., 2002. Interactive effects of salinity and irradiance on growth: implications for mangrove forest structure along salinity gradients. Trees, 16: 126-139. DOI:10.1007/s00468-002-0169-3 |
Barnuevo, A., Asaeda, T., 2018. Integrating the ecophysiology and biochemical stress indicators into the paradigm of mangrove ecology and a rehabilitation blueprint. PLoS One, 13: e0202227. DOI:10.1371/journal.pone.0202227 |
Bompy, F., Lequeue, G., Imbert, D., et al., 2014. Increasing fluctuations of soil salinity affect seedling growth performances and physiology in three Neotropical mangrove species. Plant Soil, 380: 399-413. DOI:10.1007/s11104-014-2100-2 |
Braun-Blanquet, J., 1932. Plant Sociology: The Study of Plant Communities (English translation by Fuller G.D. and Conrad H.S.). McGraw-Hill, New York.
|
Bunt, J.S., Williams, W.T., Clay, H.J., 1982. River water salinity and the distribution of mangrove species along several rivers in North Queensland. Aust. J. Bot., 30: 401-412. DOI:10.1071/BT9820401 |
Cao, J.J., Chen, J., Yang, Q.P., et al., 2023. Leaf hydraulics coordinated with leaf economics and leaf size in mangrove species along a salinity gradient. Plant Divers., 45: 309-314. DOI:10.1016/j.pld.2022.01.002 |
Chandrasekara, K., Weerasinghe, N., Pathirana, S., 2016. Mangrove diversity across salinity gradient in Negombo estuary–Sri Lanka. In: Environmental Geography of South Asia. Springer, Japan, pp. 287–304.
|
Chesson, P.L., 1990. Geometry, heterogeneity and competition in variable environments. Philos. T. R. Soc. B-Biol. Sci., 330: 165-173. DOI:10.1098/rstb.1990.0190 |
Cloern, J.E., Jassby, A.D., Schraga, T.S., et al., 2017. Ecosystem variability along the estuarine salinity gradient: examples from long-term study of San Francisco Bay. Limnol. Oceanogr., 62: S272-S291. DOI:10.1002/lno.10393 |
Costa, P., Dorea, A., Mariano-Neto, E., et al., 2015. Are there general spatial patterns of mangrove structure and composition along estuarine salinity gradients in Todos os Santos Bay?. Estuar. Coast Shelf Sci., 166: 83-91. DOI:10.1016/j.ecss.2015.08.014 |
Dangremond, E.M., Feller, I.C., Sousa, W.P., 2015. Environmental tolerances of rare and common mangroves along light and salinity gradients. Oecologia, 179: 1187-1198. DOI:10.1007/s00442-015-3408-1 |
Duke, N.C., Ball, M.C., Ellison, J.C., 1998. Factors influencing biodiversity and distributional gradients in mangroves. Global Ecol. Biogeogr., 7: 27-47. DOI:10.2307/2997695 |
Engels, J.G., Rink, F., Jensen, K., 2011. Stress tolerance and biotic interactions determine plant zonation patterns in estuarine marshes during seedling emergence and early establishment. J. Ecol., 99: 277-287. DOI:10.1111/j.1365-2745.2010.01745.x |
Hogarth, P.J., 2007. The Biology of Mangroves and Seagrasses. New York: Oxford University Press.
|
Hoguane, A.M., Hill, A.E., Simpson, J.H., et al., 1999. Diurnal and tidal variation of temperature and salinity in the Ponta Rasa mangrove swamp, Mozambique. Estuar. Coast Shelf Sci., 49: 251-264. DOI:10.1006/ecss.1999.0499 |
Hoppe-Speer, S.C.L., Adams, J.B., Rajkaran, A., et al., 2011. The response of the red mangrove Rhizophora mucronata Lam. to salinity and inundation in South Africa. Aquat. Bot., 95: 71-76. DOI:10.1016/j.aquabot.2011.03.006 |
Kamer, K., Fong, P., 2000. A fluctuating salinity regime mitigates the negative effects of reduced salinity on the estuarine macroalga, Enteromorpha intestinalis (L.) Link. J. Exp. Mar. Biol. Ecol., 254: 53-69. DOI:10.1016/S0022-0981(00)00262-8 |
Kathiresan, K., Bingham, B.L., 2001. Biology of mangroves and mangrove ecosystems. Adv. Mar. Biol., 40: 81-251. |
Kodikara, K.A.S., Jayatissa, L.P., Huxham, M., et al., 2017. The effects of salinity on growth and survival of mangrove seedlings changes with age. Acta Bot. Bras., 32: 37-46. DOI:10.1590/0102-33062017abb0100 |
Krauss, K.W., Lovelock, C.E., Mckee, K.L., et al., 2008. Environmental drivers in mangrove establishment and early development: a review. Aquat. Bot., 89: 105-127. |
Lin, G.H., Sternberg, L., 1993. Effects of salinity fluctuation on photosynthetic gas-exchange and plant-growth of the red mangrove (Rhizophora mangle L.). J. Exp. Bot., 44: 9-16. DOI:10.1093/jxb/44.1.9 |
Lugo, A.E., Snedaker, S.C., 1974. The ecology of mangroves. Annu. Rev. Ecol. Syst., 5: 39-64. DOI:10.1146/annurev.es.05.110174.000351 |
Ma, H., Cui, L.J., Li, W., et al., 2022. Effect of daily salinity fluctuation on the intraspecific interactions of a euhalophyte (Suaeda salsa) along a salinity gradient. J. Plant Ecol., 15: 208-221. DOI:10.1093/jpe/rtac002 |
Medina-Gómez, I., Kjerfve, B., Mariño, I., et al., 2014. Sources of salinity variation in a coastal lagoon in a karst landscape. Estuar. Coast, 37: 1329-1342. DOI:10.1007/s12237-014-9774-9 |
Naidoo, G., Tuffers, A.V., Willert, D.J., 2002. Changes in gas exchange and chlorophyll fluorescence characteristics of two mangroves and a mangrove associate in response to salinity in the natural environment. Trees Struct. Funct., 16: 140-146. DOI:10.1007/s00468-001-0134-6 |
Orcutt, D.M., Nilsen, E.T., 2000. The physiology of plants under stress—soil and biotic factors. Ann. Bot., 87: 853. |
Parida, A.K., Das, A.B., Mittra, B., 2004. Effects of salt on growth, ion accumulation photosynthesis and leaf anatomy of the mangrove, Bruguiera parviflora. Trees, 18: 167-174. DOI:10.1007/s00468-003-0293-8 |
Patel, N.T., Gupta, A., Pandey, A.N., 2010. Strong positive growth responses to salinity by Ceriops tagal, a commonly occurring mangrove of the Gujarat coast of India. AoB Plants, 2010: plq011. |
R Core Team, 2014. R: A Language and Environment for Statistical Computing. R Foundation for Statistical Computing. http://www.R-project.org/.
|
Ricklefs, R.E., Latham, R.E., 1993. In: Ricklefs, R.E., Schulter, D. (Eds.), Global Patterns of Diversity in Mangrove Floras, Species Diversity in Ecological Communities: Historical and Geographical Perspectives. University of Chicago Press, Chicago, pp. 215–229.
|
Silva, B.P., Saballo, H.M., Lobo, A.K.M., et al., 2023. The plasticity of the photosynthetic apparatus and antioxidant responses are critical for the dispersion of Rhizophora mangle along a salinity gradient. Aquat. Bot., 185: 103609. |
Tan, W.K., Lin, Q., Lim, T.M., et al., 2013. Dynamic secretion changes in the salt glands of the mangrove tree species Avicennia officinalis in response to a changing saline environment. Plant Cell Environ., 36: 1410-1422. DOI:10.1111/pce.12068 |
Theuerkauff, D., Rivera-Ingraham, G.A., Roques, J.A.C., et al., 2018. Salinity variation in a mangrove ecosystem: a physiological investigation to assess potential consequences of salinity disturbances on mangrove crabs. Zool. Stud., 57: 36. |
Tomlinson, P.B., 2016. The Botany of Mangroves. Second ed. Cambridge University Press.
|
Torres-Fernández del Campo, J., Olvera-Vargas, M., Figueroa-Rangel, B.L., et al., 2018. Patterns of spatial diversity and structure of mangrove vegetation in Pacific West-Central Mexico. Wetlands, 38: 919-931. DOI:10.1007/s13157-018-1041-6 |
Wang, W., Xu, L., You, S., et al., 2020. Daily salinity fluctuation alleviates salt stress on seedlings of the mangrove Bruguiera gymnorhiza. Hydrol. Process., 34: 2466-2476. |
Wang, W., Yan, Z., You, S., et al., 2011. Mangroves: obligate or facultative halophytes? A review. Trees Struct. Funct., 25: 953-963. DOI:10.1007/s00468-011-0570-x |
Wikum, D.A., Shanholtzer, G.F., 1978. Application of the Braun-Blanquet cover-abundance scale for vegetation analysis in land development studies. Environ. Manag., 2: 323-329. |
Xu, L., Wang, M., Xin, C.P., et al., 2020. Mangrove distribution in relation to seasonal water salinity and ion compartmentation: a field study along a freshwater-dominated river. Hydrobiologia, 847: 549-561. DOI:10.1007/s10750-019-04119-7 |


