


b. School of Life & Environmental Sciences, Guilin University of Electronic Technology, Guilin 541004, Guangxi, China;
c. Guangxi Key Laboratory of Landscape Resources Conservation and Sustainable Utilization in Lijiang River Basin, Guilin 541004, Guangxi, China;
d. Key Laboratory of Vegetation Restoration and Management of South China Botanical Garden of Degraded Ecosystems, Chinese Academy of Sciences, Guangzhou 510650, Guangdong, China;
e. Center of Plant Ecology, Core Botanical Gardens, Chinese Academy of Sciences, Guangzhou 510650, Guangdong, China
Forest dynamics have been extensively studied in recent decades (Tang and Fang, 2006; Wang et al., 2011; Shen et al., 2018; Bugmann and Seidl, 2022), with several researchers emphasizing the importance of long-term repeated studies on natural forest communities (Balvanera et al., 2006; Wiegand et al., 2017; Jimenez et al., 2020). These studies have shown that subtropical forests are not composed of stable and unchanging communities, as previously thought; instead, the community structure of these forests changes dynamically over time and space (Condit et al., 1999; Neumann et al., 2012; Chisholm et al., 2014; Wiegand et al., 2017; Hedl and Chudomelova, 2020). Over long time-scales, dramatic changes in forest composition associated with climatic shifts are conspicuous (Piperno and Becker, 1996; Condit et al., 2017; Lobel et al., 2018; Zhou et al., 2022). However, climatic shifts have also been well documented at much shorter time-scales (Condit et al., 1999). Extreme changes in climate such as freezing disasters and strong typhoons are known to have affected the natural succession of subtropical forest communities (Wang et al., 2019; Wu et al., 2019). By observing changes in forest census plots, the physiological and ecological mechanisms underlying these changes may be documented, as can rates at which forests change can be verified to ultimately develop predictions of longer-term and larger-scale shifts in subtropical forests.
One of the most important factors that influences forest dynamics is tree mortality (Lewis et al., 2004). In fact, mortality and renewal of common tree species are critical in predicting future forest change, as both processes generally dominate the direction of vegetation succession. For communities in the middle of succession, individual deaths are mostly concentrated among the small-diameter trees due to the density restriction (Condit et al., 1999). However, when a major disturbance occurs, the resulting loss of individuals will not be limited to small diameter individuals, but also results in the death of individuals with larger diameters (Yang et al., 2008). Other factors may differentially affect forest communities. For example, the dynamics of common species appear to be predominantly driven by environmental factors, whereas the dynamics of rare species appear to be driven predominantly by demographic variables (Chisholm et al., 2014). In tropical forests, despite the observed variability in mortality and recruitment, local tree abundance and species richness seem to stabilize at typical values (Wiegand et al., 2017). It remains unclear whether this stability is shared by other forest types, for instance, subtropical forests, which are located in the transition zone between temperate and tropical regions. Consequently, research is needed to characterize the dynamics of subtropical forest communities and identify the factors that underlie these dynamics.
Previous studies have shown that species diversity can be used to help understand community composition, change and development. Generally, species diversity changes during succession (Zhou et al., 1999) and is greatly affected by factors such as forest gaps (Hammond et al., 2020). Several studies have examined species diversity and dynamics in evergreen broad-leaved forest communities (Buttery-Gomes et al., 2017; Wiegand et al., 2017; Turkish and Elms, 2018). However, approaches that fail to consider the context of local spatial heterogeneity (e.g., variation trends of tree cover) do not fully capture forest dynamics (Li et al., 2021). Thus, long-term monitoring data and effective statistical models are required to reveal the spatial and temporal distribution dynamics of species diversity (Wiegand et al., 2017; Greig et al., 2018). One promising approach to improving our understanding of species-rich plant community dynamics is consistent monitoring of replicated plots (Wiegand et al., 2017).
In this study, we characterized forest community dynamics of a 400-year-old subtropical evergreen broad-leaved forest in South China and determined how extreme climates have impacted forest structure. For this purpose, we quantified spatial and temporal changes in community structure (e.g., individual death and renewal, and variation of species diversity) using data collected from broad-leaved forests along the same latitude over a 15-year period, during which two extreme weather events occurred (i.e., large-scale freezing and a typhoon).
2. Methods 2.1. Site descriptionThis study was conducted in a 20-ha South subtropical forest plot in the Dinghushan Nature Reserve, Guangdong Province, China (23°09′21″–23°11′30″N, 112°30′39″-112°33′41″E). The zonal vegetation of the Reserve is characteristic of a low subtropical evergreen broad-leaved forest more than 400 years old. The elevation of the plot ranges from 230 to 470 m a.s.l. (Li et al., 2009). The site has a subtropical monsoon climate with a mean annual temperature of 20.9 ℃, mean relative humidity of 85%, and mean annual precipitation of 1927 mm, most of which occurs between April and September (Bin et al., 2011).
2.2. Field samplingA census plot in the subtropical evergreen broad-leaved forest in the Dinghushan was established following standard field protocols of the Forest Dynamic Plots of the Center of Tropical Forest Science (CTFS) (Condit et al., 2013). The 20-ha (400 m × 500 m) plot was established within the 1155-ha reserve from 2004 to 2005 (Ye et al., 2008), and was re-censused every five years (2010, 2015, 2020). All stems ≥ 1 cm DBH were surveyed, mapped and tagged.
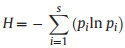
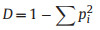
2.3. Tree species diversityTree species diversity in the quadrats was determined using three diversity indices: species richness (S), the Shannon–Wiener index (H), and the Simpson index (D). These three indices were used because they measure different facets of diversity and account for relative species abundances differently. S is simply a count of species richness and does not include relative abundance. Shannon's index accounts for both abundance and evenness of the species present. Simpson's index focuses on dominant species. The Shannon–Wiener index (H) and Simpson index (D) were calculated with the following equations:
|
(1) |
|
(2) |
where pi is the relative abundance of each species i, and S is the total number of species in the sample plot.
2.4. Species-area relationship and species-individual relationshipTwenty rectangles with different areas (the length-width ratio was 5/4) were set, and plots were randomly sampled from each rectangle 20 times. The calculated average number of species and average number of individuals after sampling the rectangles with each area were used as the Y axis, and the corresponding area scale was used as the X axis to make the species-area diagram and individual-area diagram.
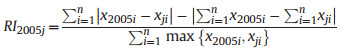
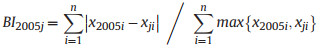
2.5. Structural diversity indexLong-term changes in diversity may be caused by species replacement or richness differences (Legendre 2014). To determine which component is responsible for changes in species diversity over time, Podani and Schmera (2011) suggested a method for exploring patterns of beta diversity, which involves calculating three complementary indices: similarity (SI), relative species replacement (RI), and β diversity index (BI). These indices were calculated as follows (Fekete et al., 2017):

|
(3) |
|
(4) |
|
(5) |
where xji represents the number of individuals of the ith species in year j (j = 2010, 2015, and 2020), and n represents the total number of species.
2.6. Statistical analysesAverage mortality and recruitment rates were measured for 31 common species with abundances > 500 over the monitoring period. The rate at which common population size changed was represented by the difference between recruitment and mortality rates (Condit et al., 1999).
To calculate the distribution of individual deaths in common species (abundances > 500) in different diameter classes, we followed the protocols of a previous study of the community (Li et al., 2008). Specifically, we divided the deaths for individuals into small diameter (DBH ≤ 3 cm), medium diameter (3 < DBH ≤ 10 cm) and large diameter (DBH > 10 cm).
At the 20 m × 20 m-quadrat scale we calculated the coefficient of variation (CV) of species diversity, and quantified shifts in the number of individuals, species richness, Shannon–Wiener index, and the Simpson index mean values. Additionally, the dynamic changes of the four indices were plotted at the 20 m × 20 m quadrat scale. All analyses were conducted in R3.6 platform, which is available from R Foundation for Statistical Computing, located in Vienna, Austria (ISBN 3-900051-07-0, http://www.R-project.org).
3. Results 3.1. Dynamic changes of species and individualsSpecies numbers in the Dinghushan Nature Reserve forest plot fluctuated each survey year (Table 1). Although the total number of species declined from 2005 to 2015, total abundance fluctuated around an average of about 73,000. The number of common species with an abundance greater than 500 decreased after 5 and 15 years. Both the number of rare species with an abundance less than 20 and single species declined from 2005 to 2015, then increased from 2015 to 2020. Mean diameter at breast height (DBH) increased from 2005 to 2010, and then decreased to 4.98 cm by the year 2015, with the increase in total individuals, indicating that a large number of young trees were recruited between 2010 and 2015. The change in average basic area at breast height was the same as that of average DBH.
| Survey year | Total species | Number of common species | Number of rare species | Number of single species | Total abundance | Average DBH (cm) | Average basic area at breast height (cm2) |
| 2005 | 195 | 31 | 98 | 24 | 71,333 | 6.04 | 78.80 |
| 2010 | 179 | 26 | 94 | 22 | 61,024 | 6.44 | 88.75 |
| 2015 | 177 | 28 | 85 | 21 | 80,937 | 4.98 | 62.47 |
| 2020 | 183 | 25 | 92 | 28 | 79,611 | 5.28 | 64.81 |
In each monitoring year, species richness (species number) increased with increasing sampling area. The species richness was the highest in 2005, however, it decreased significantly in 2010, before increasing again. The number of individuals showed a fluctuating upward trend with each survey year, with the lowest number of individuals in 2010 and the largest in 2015 (Fig. 1).

|
| Fig. 1 Species-area and individual-area trends for each survey year. |
Community structure changed in each five-year period and community composition structure changed overall (Fig. 2). The community similarity index (SI) decreased significantly, from 0.784 after 5 years to 0.55 after 10 years and then to 0.508 after 15 years. The relative species replacement index (RI) of species in the community increased over time, from 0.076 after 5 years to 0.353 after 10 years, and finally to 0.41 after 15 years. The β diversity index (BI) also increased gradually, from 0.216 after 5 years to 0.45 after 10 years, and then to 0.492 after 15 years.

|
| Fig. 2 A, Community similarity index (SI); B, individual number replacement index (RI); C, β diversity index (BI). |
At each monitoring stage, mortality rate and complement rate differed significantly. This difference is reflected by the deviation from zero in the rate of annual change in the common population size, which was more biased towards negative fluctuations (Fig. 3). The average rate of annual change in comprehensive mortality and staffing rate indicates that mortality of most common species was significantly higher than that of the staffing rate, and that the size of common population groups decreased. Between 2005 and 2010, the average rate of annual change was only positive for three populations (Aidia canthioides, Carallia brachiata and Ilex ficoidea). Between 2005 and 2015, the average rate of annual change was positive, with the highest changes occurring in common species. Ten species had a higher recruitment rate than mortality. Between 2005 and 2020, the average rate of annual change was only positive in 9 populations, whereas it was negative in 24 populations.

|
| Fig. 3 Average rate of annual change in common population sizes during different monitoring periods. |
The dynamics of death and regeneration of common species are shown in Fig. 4. Overall, the number of deaths and renewal of individuals increased with monitoring time, with recruitment increasing faster. Both the average annual mortality and recruitment rates of common species after 10 years (2005–2015) were the highest, followed by that of 15 years (2005–2020) and 5 years (2005–2010). The number of individual deaths for common species were concentrated in the small and mid-diameter level. Between 2005 and 2010, the number of deaths of small diameter individuals was 8072, that of medium diameter individuals was 4899, and that of large diameter individuals was 1588. Overall, deaths were mainly distributed in the small and middle diameter classes for all three monitoring periods. Specifically, 89.1% of deaths were concentrated in the middle and small diameter classes with DBHs less than 10 cm from 2005 to 2010, 85.5% from 2005 to 2015, and 85.6% from 2005 to 2020 (Fig. 5).

|
| Fig. 4 Individuals of dead and newly recruited common species during different monitoring periods. |

|
| Fig. 5 Deaths per diameter class for individuals from common species during three time periods. |
The spatial distribution of deaths for large-diameter plants of common species were mainly concentrated on ridges (Fig. 6), which provide space for the regeneration of species. Recruitment of individuals was also more concentrated on ridges than in valleys; In addition, the distribution of recruited individuals was lower at low elevation areas of the plot (Fig. S1).

|
| Fig. 6 Spatial distribution of deaths for large-diameter common species (DBH > 10 cm) individuals in each monitoring period. |
In the Dinghushan evergreen broad-leaved forest, variances in the distribution of number of individuals among quadrats were lowest in 2010, highest in 2015 and decreased in 2020. Variances in distribution of species richness decreased overall. In contrast, variances in Shannon-wiener and Simpson diversity index of species among quadrats both increased overall (Table 2). Across monitoring years, the number of individuals shifted greatly, while species richness shifted slightly. Shannon–Wiener and Simpson indices both decreased slightly (Fig. S2).
| Survey year | CV of individual | CV of species richness | CV of Shannon-Wiener | CV of Simpson index |
| 2005 | 0.402 | 0.255 | 0.113 | 0.055 |
| 2010 | 0.397 | 0.243 | 0.108 | 0.055 |
| 2015 | 0.419 | 0.243 | 0.143 | 0.097 |
| 2020 | 0.405 | 0.241 | 0.155 | 0.111 |
Over the monitoring period, the spatial distribution of species diversity varied (Fig. S3). Specifically, species richness was uniformly distributed, while species abundance was aggregated, with increased total abundance, although the spatial distribution was more horizontally uneven in the community. The Shannon index, which considers the contribution of rare species, was more aggregated, indicating that the distribution of rare species was more aggregated. The Simpson index, which captures the contribution of dominant species, was more dispersed, indicating that the distribution of dominant species in horizontal space was also more aggregated.
4. Discussion 4.1. Succession of evergreen broad-leaved forest in southern subtropicsThe functions of forest ecosystems in climate regulation, water conservation, carbon fixation and biodiversity conservation are strongly affected by community structure. The Dinghushan evergreen broad-leaved forest is a zonal vegetation area in the southern subtropical region of China. It exhibits a vegetation type developed under a humid monsoon climate typical of the southern subtropical zone. It is a well-preserved area of zonal vegetation near the northern regression line. Furthermore, the dynamics and community structure of the forest directly affect the quality of ecosystem services that the forest can provide. The forest reflects the transition from tropical to subtropical climates, and its community structure is relatively complex with abundant composition types. It was previously believed that the subtropical evergreen broad-leaved forest in the Dinghushan represented the top stage of community succession and was in a relatively stable stage. Previous research noted that the community of the evergreen broad-leaved forest was relatively stable within five years of the same succession stage (Huang, 2013). However, this study found that the community composition structure has changed over a 15-year period between 2005 and 2015 (Fig. 2).
Forest dynamics and community structure is influenced by unusual and rare disturbances caused by extreme climates, e.g., the impact of freezing disasters or typhoons. Freezing disasters in southern China in 2008 had a profound impact on the community structure of subtropical evergreen broad-leaved forests, resulting in a large number of plant deaths in a 20-ha plot, where some species even disappeared from the monitoring sample plot (Wang et al., 2019; Yang, 2008). In 2018, Typhoon Mangkhut damaged old-growth forest more than twice as much as secondary forest. The vulnerability of forests to powerful typhoons was greatly determined by forest structure and composition (Ni et al., 2021). Here, we found that in 2010 the number of dead individuals of common species was greater than the number of new individuals (Fig. 4), which created an opportunity for the renewal of other less common species. The favorable photo-thermal conditions of the southern subtropical zone promote rapid individual recruitment of the whole community, showing a drastic increase in the number of individuals, while the average DBH decreased (Table 1). From 2005 to 2015, the number of individuals in the community increased by 9604, and the average DBH decreased by 1.06 cm. From the year 2015–2020, although the total number of species increased, the total number of individuals decreased and the average DBH increased due to the competition of many new small trees.
4.2. Growth and mortality of community speciesGrowth and mortality are the most important factors that influence plant community dynamics and species composition (Nadja et al., 2011; Shen et al., 2013). Previous studies have shown that renewal dynamics of major tree species in forests play an important role in stabilizing or changing community structure and function (Condit et al., 1998). Recent studies have also found that species asynchrony and large trees jointly drive community stability in a montane subtropical forest (Zhou et al., 2022). In temperate forests, an important explanation of the function of forest ecosystems (e.g. biomass carbon accumulation function) is the number of large trees (Yuan et al., 2021).
Demographic rates have previously indicated that the Dinghushan forest community is more dynamic than temperate and tropical forest communities in other regions (i.e., Changbaishan in China, Barro Colorado Island in Panama, and Pasoh in Malaysia) (Shen et al., 2013). Studies have also found that in Dinghushan evergreen broad-leaved forest the average number of annual deaths and the number of woody plant death were increasing, with deaths of small diameter trees most common (Zhang et al., 2006). However, death rates are not high for large trees. Thus, previous findings indicated that the function of the southern subtropical forest community in Dinghushan is relatively stable.
In this study, we found that the evergreen broad-leaved forest in the Dinghushan exhibited a high percentage of deaths and high percentage of regeneration over the past 15 years. Specifically, 38,179 deaths and 46,393 new individuals were recorded over the past 15 years. The percentage of deaths and regeneration after 15 years reached 53.43% and 64.92%, respectively. Among them, 32,717 individuals died and 40,183 were regenerated from the common species of more than 500 individuals. In general, the mortality and regeneration rates were high, which led to great changes in species composition and community structure (Fig. 2). The regenerated individuals of common species in the community were mainly concentrated among a small number of species. The two species with the largest difference in the number of new and dead individuals are Aidia canthioides and Cryptocarya concinna, with a net increase of 17,446 and 5131 individuals, respectively. Thus, several species with high mortality rate and regeneration rate had increased overall mortality and regeneration rate. The mortality rate and regeneration rate of the constructive species are not so high. For example, the mortality rate and regeneration rate of Engelhardtia roxburghiana are 2.83% and 1.49%, respectively. Therefore, the community succession in Dinghushan still belongs to the stage of mature forest community.
Both the average annual mortality and recruitment rates of common species after 10 years (2005–2015) were the highest, followed by 15 years (2005–2020) and 5 years (2005–2010). Due to the freezing disaster in 2008, the number of dead plants of common species during 2005–2010 was greater than the number of regenerated individuals (Fig. 4). A large number of dead plants provided nutrition and space for subsequent regeneration. During the 2015 survey, a large number of new plants were observed, and the total number of common species increased by 8186 plants, accounting for 85.2% of the total net increase in the community. Survey updates continued to increase in 2020, but at a slower pace than in 2015.
Under normal succession, the majority of individual deaths occur among the small-diameter class. Here, it was observed that during the monitoring period, individual deaths were mainly distributed within the small- and middle-diameter classes, with the deaths were most concentrated among the small-diameter class (Fig. 5). This finding suggests that the death of these individuals was mainly due to significant interference, including extreme weather disturbances such as freezing disasters and typhoons (Yuan et al., 2021; Zhou et al., 2022). In addition, previous studies also found that any competition inducing tree death occurred more frequently in intraspecific rather than interspecific associations, and that most individual deaths were caused by intraspecific competition and exclusion (Shen et al., 2013). By further comparing the spatial distribution of deaths for large-diameter individuals with that of all the regenerated individuals, it was found that the spatial distribution of the renewed individuals exhibited obvious spatial overlap with that of the large-diameter dead individuals (Figs. 6 and S1).
4.3. Spatio-temporal patterns of species diversitySpecies diversity indices (Shannon–Wiener, Simpson and Pielou indices) of the evergreen broad-leaved forest community in the Dinghushan showed strong regional distribution characteristics in space, where regional characteristics have been previously related to sampling scale (Ye et al., 2008). In this study, the spatial pattern and dynamics of species diversity in the Dinghushan over the past 15 years were studied. It was found that the spatial distribution of the number of individuals, species richness and diversity indices (Shannon–Wiener and Simpson indices) fluctuated across surveys (Fig. S2). The distribution of total number of individuals varied among quadrats. Variance in the distribution of species richness among quadrats decreased, and variance in Shannon-wiener and Simpson diversity indices of species among quadrats both increased over the past 15 years (Table 2).
The coefficients of the four species diversity indices varied least in 2010. Therefore, it was preliminarily judged that the occurrence of freezing disasters may have reduced the dominance of dominant species in the sample plot, and also weakened the difference in the spatial distribution of species diversity of the community. However, it also strengthened the level of species evenness and weakened the dominance of some dominant species to a certain extent. Subsequent variations in the spatial distribution of diversity increased in 2015 and 2020, mainly due to the uneven spatial distribution of renewed individual species (Figs. S1 and S3).
In summary, the community structure of the evergreen broad-leaved forest in the Dinghushan has changed over the past 15 years. The number of regenerated individuals and deaths of common species was large. The renewal of individuals was mainly concentrated within a few populations, especially in the populations of Aidia canthioides and Cryptocarya concinna. The recruited individuals of common species were concentrated in areas where deaths of large-diameter individuals occurred. The spatial distribution of community species diversity fluctuated in each monitoring period, showing a more dispersed diversity after 15 years, and the coefficient of variation among quadrats increased. In 2010, the death and renewal of the community and the spatial variation of species diversity were different from other survey years. It is necessary to strengthen the monitoring and management of the forest community to further clarify whether the dynamic fluctuation of community structure and species diversity is mainly caused by strong climate disturbances or by periodic fluctuations in the normal succession process, and to further understand the influence of community structure change on ecosystem service function.
AcknowledgmentsWe appreciate Dr. Wanhui Ye, Dr. Zhongliang Huang, Dr. Honglin Cao and Dr. Juyu Lian for their valuable help in collecting community data. Our sincere appreciation goes to Dr. Shannon Elliot and Dr. Nana Lin for their expert help in English language and grammatical editing. We would like to express our gratitude to Dr. Du for his invaluable support. We also thank numerous individuals who contributed to the field survey of the DHS plot. We thank all of the reviewers and editors for their hard work and dedication. This plot is part of the Center for Tropical Forest Science, a global network of large-scale demographic tree plots. This study was funded by the Guangxi Natural Science Foundation Program (2022GXNSFAA035583 and 2020GXNSFAA159108), National Natural Science Foundation of China (32060305), Foundation of Key Laboratory of Ecology of Rare and Endangered Species and Environmental Protection (Guangxi Normal University), Ministry of Education, China (ERESEP 2021Z06) and Chinese Forest Biodiversity Monitoring Network.
Author contributions
SGW: Software, Formal analysis, Validation, Review and Editing. LL: Writing Original draft preparation. JGZ and QL: Investigation. KDB and ZFW: Editing.
Declaration of competing interest
The authors declare that they have no known competing financial interests or personal relationships that could have appeared to influence the work reported in this paper
Appendix A. Supplementary data
Supplementary data to this article can be found online at https://doi.org/10.1016/j.pld.2023.07.005.
Balvanera, P., Pfisterer, A.B., Buchmann, N., et al., 2006. Quantifying the evidence for biodiversity effects on ecosystem functioning and services. Ecol. Lett., 9: 1146-1156. DOI:10.1111/j.1461-0248.2006.00963.x |
Bin, Y., Lian, J., Wang, Z., et al., 2011. Tree mortality and recruitment in a subtropical broadleaved monsoon forest in South China. J. Trop. For. Sci., 23: 57-66. |
Bugmann, H., Seidl, R., 2022. The evolution, complexity and diversity of models of long-term forest dynamics. J. Ecol., 110: 2288-2307. DOI:10.1111/1365-2745.13989 |
Butturi-Gomes, Petrere, M., Giacomini, H.C., et al., 2017. Statistical performance of a multicomparison method for generalized species diversity indices under realistic empirical scenarios. Ecol. Indicat., 72: 545-552. DOI:10.1016/j.ecolind.2016.08.054 |
Chisholm, R.A., Condit, R., Rahman, K.A., et al., 2014. Temporal variability of forest communities: empirical estimates of population change in 4000 tree species. Ecol. Lett., 17: 855-865. DOI:10.1111/ele.12296 |
Condit, R., Ashton, P.S., Manokaran, N., et al., 1999. Dynamics of the forest communities at Pasoh and Barro Colorado: comparing two 50-ha plots. Philos. Trans. R. Soc. B-Biol. Sci., 354: 1739-1748. DOI:10.1098/rstb.1999.0517 |
Condit, R., J, B.M., Engelbrecht, et al., 2013. Species distributions in response to individual soil nutrients and seasonal drought across a community of tropical trees. Proc. Natl. Acad. Sci. U.S.A., 110: 5064-5068. DOI:10.1073/pnas.1218042110 |
Condit, R., Perez, R., Lao, S., et al., 2017. Demographic trends and climate over 35 years in the Barro Colorado 50 ha plot. For. Ecosyst., 4: 4-17. DOI:10.1186/s40663-017-0091-1 |
Condit, R., Sukumar, R., Hubbell, S., et al., 1998. Predicting population trends from size distributions: a direct test in a tropical tree community. Am. Nat., 152: 495-509. DOI:10.1086/286186 |
Fekete, I., Lajtha, K., Kotroczó, Z., et al., 2017. Long-term effects of climate change on carbon storage and tree species composition in a dry deciduous forest. Global. Change. Biol., 23: 3154-3168. DOI:10.1111/gcb.13669 |
Greig, C., Robertson, C., Lacerda, A., 2018. Spectral-temporal modelling of bamboo-dominated forest succession in the Atlantic Forest of Southern Brazil. Ecol. Model., 384: 316-332. DOI:10.1016/j.ecolmodel.2018.06.028 |
Hammond, M.E., Pokorn, R., Dobrovoln, L., et al., 2020. Effect of gap size on tree species diversity of natural regeneration -case study from Masaryk Training Forest Enterprise Ktiny. J. For. Sci., 66: 407-419. DOI:10.17221/78/2020-jfs |
Hedl, R., Chudomelova, M., 2020. Understanding the dynamics of forest understorey: combination of monitoring and legacy data reveals patterns across temporal scales. J. Veg. Sci., 31: 733-743. DOI:10.1111/jvs.12882 |
Huang, M.C., 2013. Dynamics of Lower Subtropical Evergreen Broadleaved Forest during 5 Years in Dinghushan. Dissertation. University of Chinese Academy of Sciences, Beijing (In Chinese).
|
Jimenez, E.M., Penuela-Mora, M.C., Moreno, F., et al., 2020. Spatial and temporal variation of forest net primary productivity components on contrasting soils in northwestern Amazon. Ecosphere, 11: e03233. DOI:10.1002/ecs2.3233 |
Legendre, P., 2014. Interpreting the replacement and richness difference components of beta diversity. Global Ecol. Biogeogr., 22: 1324-1334. DOI:10.1111/geb.12207 |
Lewis, S.L., Phillips, O.L., Sheil, D., et al., 2004. Tropical forest tree mortality, recruitment and turnover rates: calculation, interpretation and comparison when census intervals vary. J. Ecol., 92: 929-944. DOI:10.1111/j.0022-0477.2004.00923.x |
Li, L., Huang, Z.L., Ye, W.H., et al., 2009. Spatial distributions of tree species in a subtropical forest of China. Oikos, 118: 495-502. DOI:10.1111/j.1600-0706.2009.16753.x |
Li, L., Wei, S.G., Huang, Z.L., et al., 2008. Spatial patterns and interspecific associations of three canopy species at different life stages in a subtropical forest, China. J. Integr. Plant Biol., 50: 1140-1150. DOI:10.1111/j.1744-7909.2008.00690.x |
Li, W., Guo, W., Qin, Y., et al., 2021. Mapping spatio-temporal patterns in global tree cover heterogeneity: links with forest degradation and recovery. Int. J. Appl. Earth. Obs., 104: 1-14. |
Lobel, S., Mair, L., Lonnell, N., et al., 2018. Biological traits explain bryophyte species distributions and responses to forest fragmentation and climatic variation. J. Ecol., 106: 1700-1713. DOI:10.1111/1365-2745.12930 |
Nadja, Rüger, Andreas, et al., 2011. Determinants of mortality across a tropical lowland rainforest community. Oikos, 120: 1047-1056. DOI:10.1111/j.1600-0706.2010.19021.x |
Neumann, M., Saatchi, S.S., Clark, D.B., 2012. Quantifying spatial and temporal dynamics of tropical forest structure using high resolution airborne lidar. In: Geoscience & Remote Sensing Symposium. IEEE.
|
Ni, Y., Wang, T., Cao, H., et al., 2021. An old-growth subtropical evergreen broadleaved forest suffered more damage from Typhoon Mangkhut than an adjacent secondary forest. For. Ecol. Manag., 496: 119433. DOI:10.1016/j.foreco.2021.119433 |
Piperno, D.R., Becker, P., 1996. Vegetational history of a site in the central Amazon basin derived from phytolith and charcoal records from natural soils. Quat. Res. (Tokyo), 45: 202-209. DOI:10.1006/qres.1996.0020 |
Podani, J., Schmera, D., 2011. A new conceptual and methodological framework for exploring and explaining pattern in presence – absence data. Oikos, 120: 1625-1638. DOI:10.1111/j.1600-0706.2011.19451.x |
Shen, G., Tan, S., Yang, Q., et al., 2018. The prevalence of species-habitat association is not adequate for justifying the niche differentiation hypothesis. Community Ecol., 19: 45-52. DOI:10.1556/168.2018.19.1.5 |
Shen, Y., Santiago, L.S., Ma, L., et al., 2013. Forest dynamics of a subtropical monsoon forest in Dinghushan, China: recruitment, mortality and the pace of community change. J. Trop. Ecol., 29: 131-145. DOI:10.1017/S0266467413000059 |
Tang, Z., Fang, J., 2006. Temperature variation along the northern and southern slopes of Mt. Taibai, China. Agric. For. Meteorol., 139: 200-207. DOI:10.1016/j.agrformet.2006.07.001 |
Turkis, S., Elmas, E., 2018. Effect of environmental factors on species diversity of the Yenice Hot Spot forests in Turkey. J. For. Res., 29: 1719-1730. DOI:10.1007/s11676-018-0595-8 |
Wang, X., Wiegand, T., Wolf, A., et al., 2011. Spatial patterns of tree species richness in two temperate forests. J. Ecol., 99: 1382-1393. DOI:10.1111/j.1365-2745.2011.01857.x |
Wang, X., Yang, F., Gao, X., et al., 2019. Evaluation of forest damaged area and severity caused by ice-snow frozen disasters over southern China with remote sensing. Chin. Geogr. Sci., 29: 45-56. |
Wiegand, T., May, F., Kazmierczak, M., et al., 2017. What drives the spatial distribution and dynamics of local species richness in tropical forest?. Proc. R. Soc. B-Biol. Sci., 284: 20171503. DOI:10.1098/rspb.2017.1503 |
Wu, L., Kato, T., Sato, H., et al., 2019. Sensitivity analysis of the typhoon disturbance effect on forest dynamics and carbon balance in the future in a cool-temperate forest in northern Japan by using SEIB-DGVM. For. Ecol. Manag., 451: 117529. DOI:10.1016/j.foreco.2019.117529 |
Yang, F., Lu, S., Wang, B., 2008. Value estimation of service function of forest ecosystem damaged by frozen rain and snow in the South China. Sci. Silvae Sin., 44: 101-110. |
Ye, W.H., Cao, H.L., Huang, Z.L., et al., 2008. Community structure of a 20 hm2 lower subtropical evergreen broadleaved forest plot in Dinghushan, China. Chin. J. Plant Ecol., 32: 274-286. |
Yuan, Z., Ali, A., Sanaei, A., et al., 2021. Few large trees, rather than plant diversity and composition, drive the above-ground biomass stock and dynamics of temperate forests in northeast China. For. Ecol. Manag., 481: 118698. DOI:10.1016/j.foreco.2020.118698 |
Zhang, C., Huang, Z.L., Shi, J.H., et al., 2006. Dynamics and causes of woody plant death in the monsoon evergreen broad-leaved forest in Dinghushan Nature Reserve. Acta Ecol. Sin., 26: 2457-2462. DOI:10.1021/ic051420y |
Zhou, T., Zhang, J., Qin, Y., et al., 2022. Species asynchrony and large trees jointly drive community stability in a montane subtropical forest. Ecosystems. DOI:10.1007/s10021-022-00790-5 |
Zhou, X.Y., Wang, B.S., Li, M.G., et al., 1999. The community dynamics of the forest secondary succession in Heishiding Natural Reserve of Guangdong Province. Acta Bot. Sin., 41: 877-886. |