


b. Department of Ecology, College of Urban and Environmental Sciences, and Key Laboratory for Earth Surface Processes of the Ministry of Education, Peking University, Beijing 100871, China
Beta-diversity reflects changes in species composition among sites (McFadden et al., 2019; Zhong et al., 2021; Jaeger et al., 2022). Theories to explain the beta-diversity fall into two classes: neutral theory and niche theory (Lu et al., 2021; Godsoe et al., 2022). The neutral theory proposes that the species composition of a community is affected by dispersal, and thus the similarity of species composition decreases with geographic distance (Hubbell, 2001; Niu et al., 2009). Niche theory posits that species composition is affected by both environmental factors and species interactions, and that species composition changes with environmental gradients (e.g., climatic distance, elevational distance) (Keddy, 1992; Chase and Leibold, 2003; Godsoe et al., 2022). However, environmental conditions change with geography, entangling the effects of dispersal limitation and niche processes on species composition (Lu, 2021). Thus, to better understand how species composition is regulated, the relative importance of dispersal limitation and niche processes must be disentangled (Legendre et al., 2005; Chen et al., 2010; Wang et al., 2018).
Total beta-diversity has been used to measure changes in community species composition (Soininen et al., 2018; Lu, 2021; Godsoe et al., 2022). Previous studies more focused on total beta-diversity while few studies have examined processes (e.g., species turnover or replacement, species loss or increase) that shape changes in species composition between communities (Si et al., 2017; Soininen et al., 2018). Baselga (2010, 2012) has proposed dividing beta-diversity into two components: the species turnover component and the nestedness-resultant component. The species turnover component represents the replacement of species among different communities, partly due to spatially structured environmental changes and historical processes (Lennon et al., 2001; Qian et al., 2005; Baselga, 2010). The nestedness-resultant component represents the communities with low richness treating as a subset of those with higher richness, partly due to non-random loss or increase of species (Gaston and Blackburn, 2000; Ulrich and Gotelli, 2007; Baselga, 2010; Wang et al., 2010).
Previous studies have demonstrated that beta-diversity of different plant communities are not consistent (Morlon et al., 2008; Chen et al., 2010; Tang et al., 2012a, 2012b). Furthermore, many studies on beta-diversity of forests have neglected coniferous forests, which are important vegetations for maintaining the environment and species diversity of mountains (Wang et al., 2018; Yao et al., 2020; Jaeger et al., 2022).
Larch (Larix Mill.) forests are widely distributed in the mountainous and plateau areas in North and Southwest China. These forests are critical for maintaining the environment and species diversity in these areas. Larch plantations in China are also common as larches are important timber trees. Research on the diversity of larch forests have focused on α-diversity (Wang et al., 2009; Fang et al., 2019, 2022), whereas few studies have explored spatial changes in species composition in these forests. Studies of beta-diversity have helped us understand the mechanisms of community assembly (i.e., mechanisms of forming and sustaining biodiversity) and develop the diversity protection policy (Niu et al., 2009; Rao et al., 2013; Chai and Yue, 2016; Socolar et al., 2016). In this study, we determined the beta-diversity of larch forests based on 483 plots across their whole distribution area in China. Specifically, we asked three questions: (1) how do beta-diversity components of larch forests vary in China? (2) do beta-diversity patterns of larch forests change with life forms (i.e., tree, shrub, and herb)? and (3) what factors regulate the beta-diversity patterns of larch forests?
2. Material and methods 2.1. Field investigationWe defined the larch forest as a plot with at least three larch trees that occupy at least 25% of the relative basal area (Wang et al., 2020; Fang et al., 2022). We investigated 483 larch forest plots, which covered almost all distribution areas of larch forests in China, ranging from 85.14 to 130.84°E longitude and 27.1–52.86°N latitude, and from elevations between 125 and 4399 m (Fig. 1). These plots belong to 13 larch forest types, namely, Larix gmelinii, L. gmelinii var. principis-rupprechtii, L. griffithii, L. himalaica, L. kaempferi, L. kongboensis, L. mastersiana, L. olgensis, L. potaninii, L. potaninii var. australis, L. potaninii var. chinensis, L. sibirica, and L. speciosa forests (Guo et al., 2020; Fang et al., 2022). Except for the L. kaempferi forest plots, all plots were natural forests without apparent human disturbance. Our analysis also included some near-natural L. kaempferi -forest plots without apparent forest management, as L. kaempferi is planted extensively in China.

|
| Fig. 1 Distribution of larch forest plots. |
The plot size varied in the tree layer (600 m2, 20 m × 30 m), shrub layer (2 × 100 m2) and herb layer (6 × 1 m2); in addition, whole forests plot size was 600 m2 (Fang et al., 2009). For each plot, geographic information was recorded; for the tree layer, all individuals (DBH ≥ 3 cm) were measured and recorded; for shrub and herb layers, along with the investigation of shrubs and herbs for little cases (2 × 100 m2 and 6 × 1 m2), all shrub and herb species of the whole plot (600 m2) were recorded (Fang et al., 2009). To avoid the influence of different plot size, in the following analysis we used the 0/1 data of species that belong to the same plot size for trees, shrubs and herbs (600 m2). For more details on the methods employed in our field investigation, please refer to Fang et al. (2009) and Wang et al. (2020).
2.2. Climate dataWe extracted the monthly mean temperature and precipitation (MMT and MMP) for the longitude and latitude of plots from the World Climate Database with a spatial resolution of 30 arc seconds (v.2.1, http://www.worldclim.org). The annual potential evapotranspiration (APE, mm) was extracted from the Global Potential Evapo-Transpiration Climate Database with a spatial resolution of 30 arc seconds (http://www.csi.cgiar.org). Based on MMT and MMP, we calculated the mean annual temperature (MAT, ℃), mean temperature of the coldest quarter (MTCQ, ℃), mean temperature of the warmest quarter (MTWQ, ℃), annual precipitation (AP, mm), precipitation of the wettest quarter (PWQ, mm) and precipitation of the driest quarter (PDQ, mm). We used MAT, MTCQ, MTWQ, AP, PWQ, PDQ, and APE to indicate contemporary climatic conditions. The extraction of climatic data was performed in R (v.4.0.0, R Development Core Team, 2020) using the raster package (Hijmans, 2020).
Paleoclimatic conditions were reflected by the anomaly of MAT from the Last Glacial Maximum (about 22, 000 years ago, LGM) to the present (Anomaly.MAT) and the anomaly of AP from LGM to the present (Anomaly.AP) (Araújo et al., 2008). Based on the longitude and latitude of plots, we extracted MAT and AP of LGM under the MPI-ESM-P scenario (Watanabe et al., 2011) from the World Climate Database with a spatial resolution of 2.5 arc minutes (http://www.worldclim.com/paleo-climate1). We calculated Anomaly.MAT and Anomaly.AP by subtracting LGM annual values from contemporary annual values (Araújo et al., 2008).
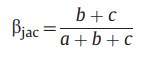
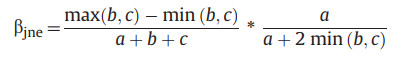
2.3. Calculation of beta-diversityThe calculation of beta-diversity for larch forests was based on the 0/1 data of species. For each life form (i.e., tree, shrub, and herb), we used the beta.pair function of the betapart package (Baselga, 2012; Baselga et al., 2021) to calculate different components of the beta-diversity: the total beta-diversity (Jaccard dissimilarity index, βjac, Eq. (1)), the species turnover component (βjtu, Eq. (2)), and the nestedness-resultant component (βjne, Eq. (3)).
|
(1) |

|
(2) |
|
(3) |
where a indicates species numbers common to the two communities, while b and c indicated species numbers specific to each of the two communities, respectively.
2.4. Statistical analysesTo assess the redundancy of environmental factors (i.e., Elevation, MAT, MTCQ, MTWQ, AP, PWQ, PDQ, APE, Anomaly.MAT, and Anomaly.AP) and remove factors with higher correlation (Spearman's ρ2 > 0.5) (Fig. S1), we used the varclus function (in the Hmisc package) (Wang et al., 2017; Harrell and Dupont, 2020). For reserved environmental factors, we calculated the total environmental distance and the distances of different environmental factors using the vegdist function of the vegan package, respectively (Fig. S1c) (Oksanen et al., 2019). The current climatic and paleoclimatic distances (see Fig. S1c) were calculated using the vegdist function (Oksanen et al., 2019). Based on the longitude and latitude of plots, we calculated geographic distance using the distm function of the geosphere package (Hijmans, 2019). To disentangle geographic and environmental influences on the beta-diversity of larch forests, we used the partial Mantel test with 999 permutations in the vegan package (Oksanen et al., 2019).
To determine the relative importance of geographic and environmental factors in the beta-diversity of larch forests, we conducted multiple regression analysis with the multiple regression on distance matrices (MRM) approach using the MRM function of the ecodist package (Goslee and Urban, 2007). Before MRM analysis, we standardized geographic and environmental factors using the stdize function included in the MuMIn package (Bartoń, 2020). We conducted permutational multivariate analysis of variance (PERMANOVA) to assess the influence of larch forest types on the beta-diversity using the adonis function of the vegan package (Oksanen et al., 2019).
Geographic, elevational, current climatic, and paleoclimatic distances were transformed to ln(x+1). The Mantel test was used to perform correlation analysis between the matrix of beta-diversity and different distance matrices (ln(x+1) form) of geographic, elevational, current climatic, and paleoclimatic factors by the mantel function, which can be found in the vegan package (Oksanen et al., 2019). To determine the relationships between different components of beta-diversity and geographic, elevational, current climatic, and paleoclimatic distances, respectively, we used the sma function of the smatr package for standard major axis regression (SMA) (Warton et al., 2012; Talbot et al., 2014). All statistical analyses were performed in R (v.4.0.0, R Development Core Team, 2020).
3. Results 3.1. Geographical and climatic patterns of beta-diversity componentsFor shrubs and herbs, the main component of beta-diversity across all latitudes and elevations within the geographical ranges of the study was species turnover (Fig. 2). Species turnover was also a main component of tree beta-diversity, but only at latitudes between 25 and 50°N and elevations less than 4000 m (Fig. 2). At higher latitudes (50–55°N) and elevations (4000–4500 m), the main component of tree beta-diversity was nestedness-resultant (Fig. 2).

|
| Fig. 2 Total beta-diversity, species turnover component (gray-blue), and nestedness-resultant component (light blue) of larch forests for different (a-c) latitudinal and (d-f) elevational ranges in China. |
Species turnover was also the main component of beta-diversity in all climatic conditions for different life forms; for shrubs and herbs, the nestedness-resultant component was negligible (Fig. 3). Even under severe climatic conditions (MAT < 0 ℃, AP < 500 mm), the nestedness-resultant component was less than 1/5 of total beta-diversity of trees (Fig. 3).

|
| Fig. 3 Total beta-diversity, species turnover component (gray-blue), and nestedness-resultant component (light blue) for climatic ranges. (a-c) mean annual temperature (MAT); (d-f) annual precipitation (AP). |
Mantel tests indicated that the beta-diversity matrix was significantly correlated with the geographic, elevational, and climatic distance matrices (Table S1). SMA indicated that total beta-diversity in different life forms increased with increasing geographic, elevational, current climatic, and paleoclimatic distances (Fig. 4). The rate at which total beta-diversity changed with geographic, elevational, current climatic, and paleoclimatic distances was largest for the tree, followed by the shrub and herb (Fig. 4 and Table S2). These analyses also indicated that total beta-diversity was largest for trees, followed by shrubs and herbs (see intercepts of Fig. 4 and Table S2).

|
| Fig. 4 Relationships between total beta-diversity in different life forms of larch forests and (a) geographic (Geo.dist), (b) elevational (Elev.dist), (c) current climatic (Clim.c.dist), and (d) paleoclimatic (Clim.p.dist) distances, respectively. |
For different life forms, the species turnover component increased whereas the nestedness-resultant component decreased with increasing geographic, elevational, current climatic and paleoclimatic distances (Fig. 5). The rate at which beta-diversity components changed with geographic, elevational, current climatic, and paleoclimatic distances was also the largest for the trees, followed by shrubs and herbs (Fig. 5 and Table S2).

|
| Fig. 5 Relationships between two beta-diversity components and (a-c) geographic (Geo.dist), (d-f) elevational (Elev.dist), (g-i) current climatic (Clim.c.dist) and (j-l) paleoclimatic (Clim.p.dist) distances for different life forms of larch forests. The beta.jtu, and beta.jne denote species turnover component, and nestedness-resultant component, respectively. |
Our analysis indicates that for all life forms total beta-diversity and two of its components were influenced more by geographic distance than by environmental distance (Tables 1 and S3). MRM analysis indicated that the geographic and environmental factors explained 25% of variance in total beta-diversity of trees, 27% of the species turnover component, and 16% of the nestedness-resultant component (Table 1). For shrubs, these factors explained 20%, 18%, and 8% of the variances (Table 1). For herbs, these factors explained 23%, 18%, and 4% of the variances (Table 1). The factor with the best partial regression coefficient of MRM was the geographic distance for total beta-diversity and the two components. Furthermore, partial regression coefficients of current climatic factors were generally larger than those of paleoclimatic factors (Table 1). Correlations between measures of diversity (i.e., total beta-diversity, species turnover, and nestedness-resultant) in different life forms (i.e., trees, shrubs, and herbs) and different larch forest types were significantly different from those between these components and overall larch forests, except for total beta-diversity of trees (Fig. 6 and Table S4). PERMANOVA indicated that larch forest types significantly affected the total beta-diversity and species turnover component of trees (R2: 0.45 and 0.67), shrubs (R2: 0.18 and 0.23), and herbs (R2: 0.15 and 0.19) (Table 2).
| Form | Diversity | Geo. | Elev. | MAT | AP | PDQ | Anomaly.MAT | Anomaly.AP |
| Tree | βjac (R2 = 0.25, P < 0.001) | 0.041 | 0.011 | 0.017 | 0.012 | −0.001 (NS) | 0.005 | 0.009 |
| βjtu (R2 = 0.27, P < 0.001) | 0.076 | 0.021 | 0.029 | 0.023 | −0.002 (NS) | 0.009 | 0.015 | |
| βjne (R2 = 0.16, P < 0.001) | −0.036 | −0.010 | −0.012 | −0.010 | 0.000 (NS) | −0.004 | −0.006 | |
| Shrub | βjac (R2 = 0.20, P < 0.001) | 0.013 | 0.008 | 0.010 | 0.003 | 0.001 | 0.004 | 0.003 |
| βjtu (R2 = 0.18, P < 0.001) | 0.020 | 0.011 | 0.013 | 0.004 | 0.001 (NS) | 0.006 | 0.005 | |
| βjne (R2 = 0.08, P < 0.001) | −0.007 | −0.002 | −0.004 | −0.001 | 0.000 (NS) | −0.002 | −0.001 | |
| Herb | βjac (R2 = 0.23, P < 0.001) | 0.012 | 0.006 | 0.006 | 0.001 | 0.001 | 0.002 | 0.003 |
| βjtu (R2 = 0.18, P < 0.001) | 0.020 | 0.007 | 0.007 | 0.002 | 0.000 (NS) | 0.003 | 0.004 | |
| βjne (R2 = 0.04, P < 0.001) | −0.008 | −0.001 (NS) | −0.002 | 0.000 (NS) | 0.000 (NS) | −0.001 | −0.001 | |
| R2 indicates the variation of beta-diversity that is explained by the remaining variables. Abbreviations: βjac, total beta-diversity; βjtu, species turnover component; βjne, nestedness-resultant component; Geo., geographic distance; Elev., elevational distance; MAT, mean annual temperature; AP, annual precipitation; PDQ, precipitation of the driest quarter; Anomaly. MAT, anomaly of mean annual temperature from the Last Glacial Maximum to the present; Anomaly. AP, anomaly of annual precipitation from the Last Glacial Maximum to the present; NS, not significant. |
||||||||

|
| Fig. 6 Multiple regression on distance matrices (MRM) analysis of tree, shrub, and herb beta-diversity for different larch forest types. (a) Total beta-diversity (beta.jac), (b) species turnover component (beta.jtu) and (c) nestedness-resultant component (beta.jne). LG, L. gmelinii forest; LGP, L. gmelinii var. principis-rupprechtii forest; LK, L. kaempferi forest; LO, L. olgensis forest; LS, L. sibirica forest; LGR, L. griffithii forest; LH, L. himalaica forest; LKO, L. kongboensis forest; LM, L. mastersiana forest; LP, L. potaninii forest; LPA, L. potaninii var. australis forest; LPC, L. potaninii var. chinensis forest; LSP, L. speciosa forest; Overall, all larch forests. Sign. and Non-Sign. means significant and non-significant R2 (criterion: p < 0.05) of MRM analysis for different larch forest types. |
| Form | Diversity | Factor | Df | SS | MS | F-value | R2 | P-value |
| Tree | βjac | Forest type | 12 | 100.06 | 8.34 | 31.43 | 0.45 | 0.00 |
| Residuals | 470 | 124.69 | 0.27 | 0.55 | ||||
| Total | 482 | 224.76 | 1.00 | |||||
| βjtu | Forest type | 12 | 144.95 | 12.08 | 79.41 | 0.67 | 0.00 | |
| Residuals | 470 | 71.49 | 0.15 | 0.33 | ||||
| Total | 482 | 216.44 | 1.00 | |||||
| βjne | Forest type | 12 | −32.58 | −2.72 | −34.18 | −6.85 | 1.00 | |
| Residuals | 470 | 37.33 | 0.08 | 7.85 | ||||
| Total | 482 | 4.75 | 1.00 | |||||
| Shrub | βjac | Forest type | 12 | 39.91 | 3.33 | 8.21 | 0.18 | 0.00 |
| Residuals | 442 | 179.15 | 0.41 | 0.82 | ||||
| Total | 454 | 219.06 | 1.00 | |||||
| βjtu | Forest type | 12 | 49.38 | 4.11 | 10.93 | 0.23 | 0.00 | |
| Residuals | 442 | 166.46 | 0.38 | 0.77 | ||||
| Total | 454 | 215.84 | 1.00 | |||||
| βjne | Forest type | 12 | −2.07 | −0.17 | −31.03 | −5.35 | 1.00 | |
| Residuals | 442 | 2.45 | 0.01 | 6.35 | ||||
| Total | 454 | 0.39 | 1.00 | |||||
| Herb | βjac | Forest type | 12 | 33.16 | 2.76 | 6.57 | 0.15 | 0.00 |
| Residuals | 449 | 188.92 | 0.42 | 0.85 | ||||
| Total | 461 | 222.08 | 1.00 | |||||
| βjtu | Forest type | 12 | 41.98 | 3.50 | 8.91 | 0.19 | 0.00 | |
| Residuals | 449 | 176.36 | 0.39 | 0.81 | ||||
| Total | 461 | 218.34 | 1.00 | |||||
| βjne | Forest type | 12 | −1.35 | −0.11 | −26.68 | −2.49 | 1.00 | |
| Residuals | 449 | 1.90 | 0.00 | 3.49 | ||||
| Total | 461 | 0.54 | 1.00 | |||||
| Df, SS, MS, F-value, and R2 are the degree of freedom, sums of squares, mean of squares, F statistical value, and explanatory power, respectively. βjac, total beta-diversity; βjtu, species turnover component; βjne, nestedness-resultant component. | ||||||||
For trees, total beta-diversity and two of its components were significantly affected by the distances of geography, elevation, MAT, AP, Anomaly.MAT, and Anomaly.AP (Table 1). The absolute value of the partial regression coefficient of MRM indicated that the most important factors was geographic distance (partial regression coefficient: 0.041, 0.076, and −0.036) for the tree beta-diversity of larch forests, followed by the distance of MAT (0.017, 0.029, and −0.012) (Table 1).
For the shrubs, the factors that significantly affected the total beta-diversity and two components were also the geographical distance and differences in elevation, MAT, AP, Anomaly.MAT, and Anomaly.AP (Table 1). The distance of PDQ also significantly affected the total beta-diversity, but its partial regression coefficient was very small (0.001) (Table 1). Also, the dominant factors for shrub beta-diversity in larch forests was geographic distance (0.013, 0.02, and −0.007), followed by the distance of MAT (0.01, 0.013, and −0.004) (Table 1).
For the herbs, all factors significantly affected the total beta-diversity and species turnover component except that PDQ was not significant for the species turnover component (Table 1). The distances of geography, MAT, Anomaly.MAT, and Anomaly.AP were significantly affected by the nestedness-resultant component (Table 1). The distances of geography and MAT were important for the total beta-diversity and two components of the herb beta-diversity in larch forests; elevational distance was also important for the herb species turnover component (Table 1).
4. Discussion 4.1. Changes in beta-diversity with geographic and climatic distancesWang et al. (2018) revealed that species replacement (i.e., species turnover) is the predominant component of spatial community dissimilarity for the temperate forests in Northern China and Northern USA. Similarly, we found that species turnover was the major component of beta-diversity for larch forests in China (Figs. 2 and 3). This result is consistent with that found for the global lake aquatic macrophytes (Alahuhta et al., 2017) and that of recent studies on bird beta-diversity (Zeng et al., 2022).
Several studies have found that the total beta-diversity of different plant communities significantly increases with increasing geographic and environmental distances (Li et al., 2016; Wang et al., 2018; He et al., 2022). Similarly, our results showed that the total beta-diversity and the species turnover component of larch forests significantly increased with geographic and climatic distances; however, the nestedness-resultant component significantly decreased across these distances (Figs. 4 and 5). These findings are reasonable given that species turnover is the major component of beta-diversity in China's larch forests (Figs. 2 and 3). Furthermore, the nestedness-resultant component has also been shown to decease along geographic and climatic distances in large-scale angiosperm assemblages (Qian et al., 2020), amphibian communities (Wang et al., 2022) and stream bacteria communities (Li et al., 2020).
Beta-diversity decreases in communities with high dispersal ability (Nekola and White, 1999; Qian, 2009; Chen et al., 2010). Thus, beta-diversity changes faster in communities composed of species with low dispersal ability than in communities composed of species with high dispersal ability (Nekola and White, 1999; Qian, 2009; Chen et al., 2010). In larch forests, we found that beta-diversity of trees changes faster than that of shrubs and herbs in response to geographic distance (Fig. 4). This finding indicates that dispersal ability at lower levels in trees than in shrubs and herbs. Similarly, beta-diversity changes faster in trees than in shrubs and herbs in response to climatic factors (Fig. 4). This finding suggests that the water-energy range is smaller in trees than in shrubs and herbs (Qian et al., 2005, 2009; Liu et al., 2015). Larch forests are typical cold temperate coniferous forests. The tree layer of larch forests largely consists of coniferous species with less species richness. The understory species of these forests are relatively abundant because the transmittance of larch forests is relatively high and provides favorable light conditions for understory plants (Fang et al., 2019, 2020). We found beta-diversity was lower in trees than in shrubs and herbs growing at similar geographic or climatic distances (Fig. 4). This finding is consistent with the differences in species richness between the life forms of larch forests (Fang et al., 2019, 2022).
4.2. Effects of dispersal limitation and niche differentiation on beta-diversityPrevious studies found that geographical distance and environmental divergence significantly affect the beta-diversity of plant communities (Liu et al., 2015; Tang et al., 2021b; He et al., 2022). Furthermore, the explanatory strength of geographic and environmental distances on beta-diversity have been shown to reflect the roles of dispersal limitation and niche differentiation on community composition (Qian, 2005, 2009; Chen et al., 2010). Many studies have shown that the relative strengths of dispersal limitation and niche differentiation depend largely on taxonomic groups (Tang et al., 2012b; Rao et al., 2013; Liu et al., 2015; Li et al., 2016; Viana et al., 2016; He et al., 2022). In this study, partial Mantel tests showed that beta-diversity of larch forests depends most on geographic distance (Table S3). This finding indicates that dispersal limitation best explains the beta-diversity of larch forests compared with niche differentiation. However, the total explanatory strengths of geographic and environmental distances were less than 30 % (Table 1), indicating there are other important factors responsible for beta-diversity in larch forests (Wang et al., 2018; Yao et al., 2020; Jaeger et al., 2022).
Previous studies have indicated that other factors influence the beta-diversity of forests, including assembly processes, spatial structure, and the intensity of regeneration treatments (Wang et al., 2018; Yao et al., 2020; Jaeger et al., 2022). We found that the R2 of MRM analysis on total beta-diversity and two components of different larch forest types were significantly different from that of overall larch forests, except for the total beta-diversity of the trees (Fig. 6 and Table S4). In this analysis, in addition to environmental distance, larch forest type (identified by dominant larch species in the forest) also reflected the results of species niche differentiation since the distribution of different larch forest types in China has distinct zonality formed by a lengthy historical process (Liu et al., 2002; Sundaram et al., 2019, 2021; Fang et al., 2020, 2022). Our results showed that larch forest types significantly affect total beta-diversity and the species turnover component of larch forests (Table 2). In other words, niche differentiation also greatly explains the total beta-diversity and species turnover component of larch forests.
MRM analysis has been applied extensively to study the explanatory strength of independent factors in beta-diversity studies (Li et al., 2016; Wang et al., 2017). Here, MRM analysis showed that current climatic factors (especially MAT) were more important than paleoclimatic factors for the beta-diversity of larch forests (Table 1). This finding is consistent with that of research on species richness of larch forests (Fang et al., 2022) and with a study of beta-diversity of plant communities in the Americas (McFadden et al., 2019). Tang et al. (2012a) found that MAT was the most important climatic factor for tree beta-diversity in the mountain forests of China, whereas the annual actual evapotranspiration and AP were the main climatic predictors for shrub beta-diversity. These findings are partly consistent with our finding that MAT is the most important climatic factor for the beta-diversity of trees and shrubs.
5. ConclusionsHere, we used 483 larch forest plots to determine beta-diversity of larch forests in China. Our results showed that the main component of beta-diversity for larch forests is the species turnover component. The change of species turnover component with the geographic and environmental distances was consistent with the total beta-diversity, but the change of nestedness-resultant component was the opposite. These geographic and environmental distance patterns of beta-diversity differed with different life forms of larch forests. Although the influences of geographic distance were bigger than those of environmental distance, larch forest types also influenced beta-diversity. The beta-diversity of larch forests was affected by both of niche differentiation and dispersal limitation.
AcknowledgementsThis study was supported by the Major Program for Basic Research Project of Yunnan Province (No. 202101BC070002), the National Natural Science Foundation of China (No. 32201426, No. 31988102), and the National Science and Technology Basic Project of China (No. 2015FY210200). Thanks for the work of Chunyun Liu and many others in the field investigation, and the assistance of the local forestry bureau.
Author contributions
Jiangling Zhu: Project administration. Chengjun Ji: Investigation. Qiong Cai: Investigation. Wenjing Fang: Writing – original draft, Writing – review & editing. Jingyun Fang: Conceptualization, Funding acquisition. Zhiyao Tang: Conceptualization, Writing – review & editing
Data statement
Data is available from the corresponding author on reasonable request.
Declaration of competing interest
The authors declare that they have no known competing financial interests or personal relationships that could have appeared to influence the work reported in this paper.
Appendix A. Supplementary data
Supplementary data to this article can be found online at https://doi.org/10.1016/j.pld.2023.10.003.
Alahuhta, J., Kosten, S., Akasaka, M., et al., 2017. Global variation in the beta diversity of lake macrophytes is driven by environmental heterogeneity rather than latitude. J. Biogeogr., 44: 1758-1769. DOI:10.1111/jbi.12978 |
Araújo, M.B., Nogués-Bravo, D., Diniz-Filho, J.A.F., et al., 2008. Quaternary climate changes explain diversity among reptiles and amphibians. Ecography, 31: 8-15. DOI:10.1111/j.2007.0906-7590.05318.x |
Bartoń, K., 2020. MuMIn: multi-model inference. R package version 1.43.17. https://CRAN.R-project.org/package=MuMIn.
|
Baselga, A., 2010. Partitioning the turnover and nestedness components of beta diversity. Global Ecol. Biogeogr., 19: 134-143. DOI:10.1111/j.1466-8238.2009.00490.x |
Baselga, A., 2012. The relationship between species replacement, dissimilarity derived from nestedness, and nestedness. Global Ecol. Biogeogr., 21: 134-143. DOI:10.1111/j.1466-8238.2011.00673.x |
Baselga, A., Orme, D., Villeger, S., et al., 2021. Betapart: partitioning beta diversity into turnover and nestedness components. R package version 1.5.4. https://CRAN.R-project.org/package=betapart.
|
Chai, Y., Yue, M., 2016. Research advances in plant community assembly mechanisms. Acta Ecol. Sin., 36: 4557-4572. |
Chase, J.M., Leibold, M.A. (Eds.), 2003. Ecological niches: linking classical and contemporary approaches. University of Chicago Press.
|
Chen, S., Ouyang, Z., Xu, W., et al., 2010. A review of beta diversity studies. Biodivers. Sci., 18: 323-335. DOI:10.3724/SP.J.1003.2010.323 |
Fang, J., Wang, X., Shen, Z., et al., 2009. Methods and protocols for plant community inventory. Biodivers. Sci., 17: 533-548. DOI:10.1007/978-3-642-02682-9_81 |
Fang, W., Cai, Q., Zhu, J., et al., 2019. Distribution, community structures and species diversity of larch forests in North China. Chin. J. Plant Ecol., 43: 742-752. DOI:10.17521/cjpe.2018.0244 |
Fang, W., Zhao, Q., Cai, Q., et al., 2020. The relationships among structure variables of larch forests in China. For. Ecosyst., 7: 61. DOI:10.1186/s40663-020-00273-w |
Fang, W., Cai, Q., Zhao, Q., et al., 2022. Species richness patterns and the determinants of larch forests in China. Plant Divers., 44: 436-444. DOI:10.1016/j.pld.2022.05.002 |
Gaston, K.J., Blackburn, T.M. (Eds.), 2000. Pattern and Process in Macroecology. Blackwell Science, Oxford.
|
Godsoe, W., Bellingham, P.J., Moltchanova, E., 2022. Disentangling niche theory and beta diversity change. Am. Nat., 199: 510-522. DOI:10.1086/718592 |
Goslee, S.C., Urban, D.L., 2007. The ecodist package for dissimilarity-based analysis of ecological data. J. Stat. Software, 22: 1-19. |
Guo, K., Fang, J., Wang, G., et al., 2020. A revised scheme of vegetation classification system of China. Chin. J. Plant Ecol., 44: 111-127. DOI:10.17521/cjpe.2019.0271 |
Harrell Jr., F.E., Dupont, C., 2020. Hmisc: Harrell Miscellaneous. R package version 4.4-0. https://CRAN.R-project.org/package=Hmisc.
|
He, Y., Liang, S., Liu, R., et al., 2022. Beta diversity patterns unlock the community assembly of woody plant communities in the riparian zone. Forests, 13: 673. DOI:10.3390/f13050673 |
Hijmans, R.J., 2019. Geosphere: spherical trigonometry. R package version 1.5-10. https://CRAN.R-project.org/package=geosphere.
|
Hijmans, R.J., 2020. Raster: geographic data analysis and modeling. R package version 3.1-5. https://CRAN.R-project.org/package=raster.
|
Hubbell, S.P. (Ed.), 2001. The Unified Neutral Theory of Biodiversity and Biogeography. Princeton University Press, Princeton.
|
Jaeger, R., Delagrange, S., Aubin, I., et al., 2022. Increasing the intensity of regeneration treatments decreased beta diversity of temperate hardwood forest understory 20 years after disturbance. Ann. For. Sci., 79: 39. DOI:10.1186/s13595-022-01152-w |
Keddy, P.A., 1992. Assembly and response rules: two goals for predictive community ecology. J. Veg. Sci., 3: 157-164. DOI:10.2307/3235676 |
Legendre, P., Borcard, D., Peres-Neto, P., 2005. Analyzing beta diversity: partitioning the spatial variation of community composition data. Ecol. Monogr., 75: 435-450. DOI:10.1890/05-0549 |
Lennon, J.J., Koleff, P., Greenwood, J., et al., 2001. The geographical structure of British bird distributions: diversity, spatial turnover and scale. J. Anim. Ecol., 70: 966-979. DOI:10.1046/j.0021-8790.2001.00563.x |
Li, X., Liu, Y., Liu, Y., et al., 2016. Impacts of geographical distances and environmental differences on the beta diversity of plant communities in the dry-hot valley of the Yuanjiang River. Biodivers. Sci., 24: 399-406. DOI:10.17520/biods.2015245 |
Li, M., Wu, K., Meng, F., et al., 2020. Beta diversity of stream bacteria in Hengduan Mountains: the effects of climatic and environmental variables. Biodivers. Sci., 28: 1570-1580. DOI:10.17520/biods.2019390 |
Liu, Z., Fang, J., Piao, S., 2002. Geographical distribution of species genera Abies, Picea and Larix in China. Acta Geol. Sin., 57: 577-586. |
Liu, Y., Tang, Z., Fang, J., 2015. Contribution of environmental filtering and dispersal limitation to species turnover of temperate deciduous broad-leaved forests in China. Appl. Veg. Sci., 18: 34-42. DOI:10.1111/avsc.12101 |
Lu, M., 2021. Complex relationships between beta diversity and dispersal in meta-community models. Ecography, 44: 1769-1780. DOI:10.1111/ecog.05937 |
McFadden, I.R., Sandel, B., Tsirogiannis, C., et al., 2019. Temperature shapes opposing latitudinal gradients of plant taxonomic and phylogenetic beta diversity. Ecol. Lett., 22: 1126-1135. DOI:10.1111/ele.13269 |
Morlon, H., Chuyong, G., Condit, R., et al., 2008. A general framework for the distance-decay of similarity in ecological communities. Ecol. Lett., 11: 904-917. DOI:10.1111/j.1461-0248.2008.01202.x |
Nekola, J.C., White, P.S., 1999. The distance decay of similarity in biogeography and ecology. J. Biogeogr., 26: 867-878. |
Niu, K., Liu, Y., Shen, Z., et al., 2009. Community assembly: the relative importance of neutral theory and niche theory. Biodivers. Sci., 17: 579-593. DOI:10.3724/SP.J.1003.2009.09142 |
Oksanen, J., Blanchet, F.G., Friendly, M., 2019. Vegan: community ecology package. R package version 2.5-6. https://CRAN.R-project.org/package=vegan.
|
Qian, H., 2009. Beta diversity in relation to dispersal ability for vascular plants in North America. Global Ecol. Biogeogr., 18: 327-332. DOI:10.1111/j.1466-8238.2009.00450.x |
Qian, H., Ricklefs, R.E., White, P.S., 2005. Beta diversity of angiosperms in temperate floras of eastern Asia and eastern North America. Ecol. Lett., 8: 15-22. DOI:10.1111/j.1461-0248.2004.00682.x |
Qian, H., Jin, Y., Leprieur, F., et al., 2020. Geographic patterns and environmental correlates of taxonomic and phylogenetic beta diversity for large-scale angiosperm assemblages in China. Ecography, 43: 1706-1716. DOI:10.1111/ecog.05190 |
Rao, M., Mi, X., Zhang, J., et al., 2013. Effects of environmental filtering and dispersal limitation on species and phylogenetic beta diversity in Gutianshan National Nature Reserve. Chin. Sci. Bull., 58: 1204-1212. DOI:10.1360/972012-1582 |
Si, X., Zhao, Y., Chen, C., et al., 2017. Beta-diversity partitioning: methods, applications and perspectives. Biodivers. Sci., 25: 464-480. DOI:10.17520/biods.2017024 |
Socolar, J.B., Gilroy, J.J., Kunin, W.E., et al., 2016. How should beta-diversity inform biodiversity conservation?. Trends Ecol. Evol., 31: 67-80. |
Soininen, J., Heino, J., Wang, J., 2018. A meta-analysis of nestedness and turnover components of beta diversity across organisms and ecosystems. Global Ecol. Biogeogr., 27: 96-109. DOI:10.1111/geb.12660 |
Sundaram, M., Leslie, A.B., 2021. The influence of climate and palaeoclimate on distributions of global conifer clades depends on geographical range size. J. Biogeogr., 48: 2286-2297. DOI:10.1111/jbi.14152 |
Sundaram, M., Donoghue, M.J., Farjon, A., et al., 2019. Accumulation over evolutionary time as a major cause of biodiversity hotspots in conifers. Proc. Roy. Soci. B-Biol. Sci., 286: 20191887. DOI:10.1098/rspb.2019.1887 |
Talbot, J.M., Bruns, T.D., Taylor, J.W., et al., 2014. Endemism and functional convergence across the North American soil mycobiome. Proc. Natl. Acad. Sci. U.S.A., 111: 6341-6346. DOI:10.1073/pnas.1402584111 |
Tang, Z., Fang, J., Chi, X., et al., 2012a. Patterns of plant beta-diversity along elevational and latitudinal gradients in mountain forests of China. Ecography, 35: 1083-1091. DOI:10.1111/j.1600-0587.2012.06882.x |
Tang, Z., Fang, J., Chi, X., et al., 2012b. Geography, environment, and spatial turnover of species in China's grasslands. Ecography, 35: 1103-1109. DOI:10.1111/j.1600-0587.2012.07713.x |
Ulrich, W., Gotelli, N.J., 2007. Null model analysis of species nestedness patterns. Ecology, 88: 1824-1831. DOI:10.1890/06-1208.1 |
Viana, D.S., Figuerola, J., Schwenk, K., et al., 2016. Assembly mechanisms determining high species turnover in aquatic communities over regional and continental scales. Ecography, 39: 281-288. DOI:10.1111/ecog.01231 |
Wang, X., Fang, J., Sanders, N.J., et al., 2009. Relative importance of climate vs local factors in shaping the regional patterns of forest plant richness across northeast China. Ecography, 32: 133-142. DOI:10.1111/j.1600-0587.2008.05507.x |
Wang, Y., Bao, Y., Yu, M., et al., 2010. Nestedness for different reasons: the distributions of birds, lizards and small mammals on islands of an inundated lake. Divers. Distrib., 16: 862-873. DOI:10.1111/j.1472-4642.2010.00682.x |
Wang, X., Lu, X., Yao, J., et al., 2017. Habitat-specific patterns and drivers of bacterial β-diversity in China's drylands. ISME J., 11: 1345-1358. DOI:10.1038/ismej.2017.11 |
Wang, X., Wiegand, T., J. Anderson-Teixeira, K., et al., 2018. Ecological drivers of spatial community dissimilarity, species replacement and species nestedness across temperate forests. Global Ecol. Biogeogr., 27: 581-592. DOI:10.1111/geb.12719 |
Wang, G.H., Fang, J.Y., Guo, K., et al., 2020. Contents and protocols for the classification and description of vegetation formations, alliances and associations of vegetation of China. Chin. J. Plant Ecol., 44: 128. |
Wang, X., Zhong, M., Yang, S., et al., 2022. Multiple β-diversity patterns and the underlying mechanisms across amphibian communities along a subtropical elevational gradient. Divers Distrib., 28: 2489-2502. DOI:10.1111/ddi.13618 |
Warton, D., Duursma, R., Falster, D., et al., 2012. Smatr 3 - an R package for estimation and inference about allometric lines. Methods Ecol. Evol., 3: 257-259. |
Watanabe, S., Hajima, T., Sudo, K., et al., 2011. MIROC-ESM 2010: model description and basic results of CMIP5-20c3m experiments. Geosci. Model Dev., 4: 845-872. DOI:10.5194/gmd-4-845-2011 |
Yao, Z., Wen, H., Deng, Y., et al., 2020. Driving forces underlying the beta diversity of tree species in subtropical mid-mountain moist evergreen broad-leaved forests in Ailao Mountains. Biodivers. Sci., 28: 445-454. DOI:10.17520/biods.2019356 |
Zeng, C., Li, W., Ding, P., et al., 2022. A landscape-level analysis of bird taxonomic, functional and phylogenetic β-diversity in habitat island systems. J. Biogeogr., 49: 1162-1175. DOI:10.1111/jbi.14384 |
Zhong, Y., Chu, C., Myers, J.A., et al., 2021. Arbuscular mycorrhizal trees influence the latitudinal beta-diversity gradient of tree communities in forests worldwide. Nat. Commun., 12: 3137. |