


b. University of Chinese Academy of Sciences, Beijing 100049, China;
c. College of Traditional Chinese Medicine, Yunnan University of Chinese Medicine, Kunming, Yunnan 650500, China;
d. School of Biological and Chemical Sciences, Puer University, Puer, Yunnan 665000, China;
e. State Key Laboratory for Conservation and Utilization of Subtropical Agro-bioresources, Guangxi Key Laboratory of Forest Ecology and Conservation, Guangxi University, Daxuedong Road 100, Nanning, Guangxi 530004, China
The emergence of flowers is of unparalleled significance for the evolution of angiosperms and is a critical factor in their prosperity and diversity (Soltis and Soltis, 2014). The primary function of flowers is to facilitate pollination and reproduction (Primack, 1985). The expression of floral traits influences plant–pollinator interactions, such that plants with large and showy flowers achieve higher pollination success than plants with small and inconspicuous flowers (Galen, 1989, 1999). Although pollinator selection has been considered the main factor that has influenced flower evolution (Fenster et al., 2004; Alcantara and Lohmann, 2010; Van der Niet and Johnson, 2012), recent studies have shown that floral traits are also shaped by environmental factors (Teixido and Valladares, 2019; Rering et al., 2020). Therefore, investigating how environmental factors (e.g., habitat types) affect floral traits is vital to understanding plant species diversity and evolution. However, a systematic framework has not been developed to explore associations among floral traits and habitat.
Flowers differ in shape, anatomy and morphology; however, floral traits vary together across species (Roddy et al., 2019). To identify axes of floral trait covariation, Roddy et al. (2021) have proposed a novel flower economics spectrum (FES). Similar to the leaf economics spectrum (Wright et al., 2004), the FES describes a strategic spectrum of resource trade-offs at the level of floral organs as expressed through the range of variation of traits and their quantitative relationships (Roddy et al., 2021; E-Vojtkó et al., 2022). Roddy et al. (2021) suggest that as a first step to constructing the FES, standardized measurements of flower size, longevity, mass per area and carbon cost should be made. These traits can be measured universally in flowers and correlated with the primary function of the flower, allowing for the detection of universal patterns. Among FES traits, floral longevity has been considered to be one of the key FES traits because it balances floral pollination success and maintenance costs (Ashman and Schoen, 1994). A previous study showed that floral longevity is strongly correlated with flower hydraulic traits, suggesting that extending floral longevity may increase water costs (Zhang et al., 2017). In addition, flower mass per area has been shown to be positively correlated with floral longevity in Paphiopedilum (Zhang et al., 2017). To date, the evidence in support of the linkages among FES traits across diverse plant species remains rather sparse. Therefore, a comparative study of floral traits among different taxa is necessary for the construction of FES.
Flowers require water to maintain their functions and reproductive success (Ashman and Schoen, 1994; Galen, 2005; Lambrecht et al., 2011). For instance, the maximum sap flow rate of flowers can reach 50% of that of leaves, suggesting that water demand for some species may be high during blooming (Roddy and Dawson, 2012). For cash crops, drought at the reproductive stage is a pivotal limiting factor of their yield, and water deficit affects pistil function more than pollen function (Fang et al., 2010). Roddy et al. (2016) found that in magnoliids flower hydraulic conductance was coordinated with water supply (as indicated by vein length per area) and loss (minimum epidermal conductance); however, such correlations between flower hydraulic traits are weak in monocots and eudicots. Few studies have focused on the coordination or trade-offs between FES and flower hydraulic traits. Flower hydraulic conductance may indirectly constrain flower size because it is difficult to maintain the high-water demand of large flowers in dry habitats (Galen et al., 1999; Lambrecht, 2013). In addition, the cost of maintaining water supplies restricts the size of corollas of plants in water-scarce regions (e.g., the Mediterranean), which favors small-flowered individuals (Teixido and Valladares, 2015). These results suggest that it is likely that flower hydraulic traits are tightly linked with the FES. However, correlations between hydraulic traits and flower structure or the physiological function of flowers remains under studied (Gleason, 2018; Roddy et al., 2018; Bourbia et al., 2020).
Environmental factors and resources (e.g., water) are crucial for floral function (Chapotin et al., 2003; Lambrecht and Dawson, 2007; Roddy et al., 2021). The resources required to grow and maintain flowers and their distribution may differ significantly between habitats (Herrera, 2005). For example, additional resources are typically provided to the carpels in dry and hot habitats, i.e., through increasing reproduction in response to stressful conditions (Teixido and Valladares, 2019). In these drier and hotter habitats, the number of flowers decreases (Herrera, 2005). In addition, flower size varies at different resource levels (Ashman and Schoen, 1997). Flowers represent a large sink for water, carbon, and nutrients, and their fitness for different habitats reflects differences in resource allocation (Gleason, 2018). However, floral trait variation in different habitats has received little attention. Previous studies have shown that leaf mass per area and leaf carbon content are lower in aquatic plants than in terrestrial plants (Mommer et al., 2007; Poorter et al., 2009; Pierce et al., 2012). Although both the total number of plastids per unit leaf area and the surface area of chloroplasts per unit leaf area is smaller in aquatic than in terrestrial plants, the functional relationships between leaf traits are identical both types of plants (Ronzhina and P'yankov, 2001). The leaves of aquatic and terrestrial plants differ in economics trade-offs: aquatic plants exhibit more rapid growth strategies in carbon- and nutrient economy than terrestrial plants (Zhang et al., 2017). Aquatic plants are more flexible than terrestrial plants in curvature to adapt to the water flow (Usherwood et al., 1997). However, it has not been well-documented whether the flowers of aquatic plants also develop unique structural characteristics to target for adaptation to aquatic habitats like their vegetative organs.
Previous studies have shown that economics spectrum rules of plant organs, such as leaf, wood and seed, are stable and universal and do not depend on environmental changes (Wright et al., 2004; Chave et al., 2009; Saatkamp et al., 2019). In this study, we tested whether aquatic and terrestrial plants follow a similar pattern along the flower economics spectrum. For these purposes, we measured a total of 27 flower economics and hydraulic traits of six aquatic and six terrestrial herbaceous species in a common garden in SW China. We also tested whether the flowers of aquatic plants possess some unique characteristics related to high water loss rate for adaptation to aquatic habitats compared to terrestrial plants.
2. Materials and methods 2.1. Study site and plant materialThis study was conducted at Xishuangbanna Tropical Botanical Garden (XTBG; 21°55′N, 101°15′E, elevation 570 m a.s.l.), Chinese Academy of Sciences, Yunnan Province, China. XTBG has a mean annual temperature of 22.7 ℃. Due to the influence of the southwestern monsoon and the Tibetan Plateau, XTBG experiences distinct dry (November–April) and rainy (May–October) seasons. Fog is common throughout the year in the region, with an average of 186.4 fog days per year. The mean annual precipitation is 1413 mm, with the rainy and dry seasons accounting for about 87% and 13% of the annual precipitation.
We selected six aquatic and six terrestrial species at XTBG (Fig. 1). The selected species were in close proximity to each other, with the maximum distance between two species being approximately 500 m. We chose these species for three reasons. First, they were a set of species with phylogenetic diversity (including ANA grade, monocots, and eudicots) from nine families. Second, these species have well-known phylogenetic positions, allowing us to take phylogeny into consideration in our analyses. Third, these species are widely distributed in southern Yunnan. Therefore, these species are easily sampled and represent aquatic and terrestrial floras in the study region. Because most aquatic plants are herbaceous, we also chose herbaceous terrestrial species to avoid differences derived from growth forms. From February–May 2022, we measured 27 floral traits associated with water- and carbon economy in the 12 species (Table 1). All target species were well-hydrated during floral trait measurements, and recently-opened flowers were collected.

|
| Fig. 1 Phylogenetic relationships of six aquatic and six terrestrial plant species studied. |
| Category | Trait | Abbreviation | Unit |
| Economics traits | Floral longevity | FL | days |
| Floral area | FA | cm2 | |
| Flower mass per area | FMA | g m−2 | |
| Flower dry matter content | FDMC | g g−1 | |
| Carbon concentration per mass of flowers | Cflower | g kg−1 | |
| Nitrogen concentration per mass of flowers | Nflower | g kg−1 | |
| C/N ratio of flowers | C/Nflower | ||
| Construction cost of flowers | CCflower | g kg−1 | |
| Hydraulic traits | Petal thickness | PT | μm |
| Petal density | PD | kg m−3 | |
| Petal stomatal density | SDpetal | no. mm−2 | |
| Petal stomatal size | SSpetal | μm2 | |
| Petal guard cell length | GCLpetal | μm | |
| Petal epidermal cell size | ECSpetal | μm2 | |
| Petal adaxial epidermis thickness | Adapetal | μm | |
| Petal abaxial epidermis thickness | Abapetal | μm | |
| Petal vein density | Dvein, petal | mm mm−2 | |
| Time required for drying of saturated flowers to 70% relative water content | T70, flower | h | |
| Flower water potential at the turgor loss point | ψtlp, flower | MPa | |
| Flower relative water content | RWCflower | % | |
| Pedicel vessel density | VDpedicel | no. mm−2 | |
| Pedicel vessel lumen fraction | VLFpedicel | % | |
| Pedicel hydraulic diameter | Dh, pedicel | μm | |
| Pedicel mean vessel diameter | MVDpedicel | μm | |
| Pedicel maximum vessel diameter | Dmax, pedicel | μm | |
| Pedicel minimum vessel diameter | Dmin, pedicel | μm | |
| Pedicel theoretical hydraulic conductivity | Kt, pedicel | 10−4 kg m−1 s−1 MPa−1 |
Floral longevity (FL; days) indicates how long a flower remains open and functional. It is a vital reproductive trait that affects plant reproduction and plays a crucial role in the reproductive evolutionary ecology (Primack, 1985; Ashman and Schoen, 1994). We marked 10–20 flower buds at random for each species. Floral longevity was recorded from the instant flowers opened until the corolla fell off or wilted and discolored (Roddy et al., 2021). The flowers of Nymphaeaceae are unique in that they usually open in the morning and close in the afternoon; therefore, we recorded its floral longevity, starting when they opened for the first time and ending when they closed and never opened again.
We excised three to six recently opened flowers of each species in the morning and measured their fresh weight (FWflower; g). These flowers were soaked in water for several hours before being weighed; the saturated weight (SWflower; g) was recorded once the weight no longer changed. The floral area (FA; cm2) of all organs in the flower (i.e., calyx, petals, stamens, and pistils) was determined using the Epson flatbed scanner (Epson Perfection V850 Pro). Flowers were dried at 70 ℃ for 48 h to obtain their constant dry weight (DWflower; g). Flower mass per area (FMA; g m−2) was calculated as DWflower/FA. Flower dry matter content (FMDC; g g−1) was calculated as DWflower/SWflower. Flower relative water content (RWCflower; %) was calculated as (FWflower ‒ DWflower)/(SWflower ‒ DWflower).
To determine carbon and nitrogen content, healthy and fresh flowers were first oven-dried at 70 ℃ for at least 48 h, ground into powder, and passed through a 60-mesh sieve. The flower carbon (Cflower; g kg−1) and nitrogen (Nflower; g kg−1) concentrations per mass were determined by a C–N elemental analyzer (Vario MAX CN, Elementar Analysensysteme GmbH, Hanau, Germany). The C/N ratio of flowers (C/Nflower) was then calculated. Flower construction cost (CCflower; g kg−1) was estimated as (5.39Cflower ‒ 1191)/1000 (Vertregt and Penning De Vries, 1987).
2.3. Pedicel xylem anatomy and hydraulic efficiencyFor examination of xylem anatomy and hydraulic efficiency, we collected three to six pedicels from different individuals for each species. Pedicels were collected early in the morning, placed in a bubble chamber, and returned to the laboratory immediately. The middle part of the pedicels was preserved in FAA solution (formalin: acetic acid: 70% alcohol = 5: 5: 90). Cross-sections of pedicels were made using the paraffin embedding method. Pedicels soaked in FAA solution were placed in tissue embedding boxes for dehydration and wax immersion, followed by embedding of the samples. The embedded samples were cut into 14–25 μm cross-sections using a rotary slicer (Leica RM2245, Leica Microsystems, China). Sections were deparaffinized with limonene and stained with 1:1 mixtures of 0.5% Astral Blue and 1% Safranin-O. We then took photographs of each part of the section with a light microscope (Leica Microsystems Ltd., Leica DM2500, Wetzlar, Germany). The cross-section area of the pedicel, the total number of vessels (n), and the long and short axes of vessel lumens were measured with ImageJ (National Institutes of Health, Bethesda, MD, USA). The diameter of each pedicel vessel (Di, pedicel; μm) was calculated as follows:

|
where a and b represent the radii of the major and minor axes of each vessel lumen, respectively.
The pedicel hydraulically weighted vessel diameter (Dh, pedicel; μm) was calculated as follows (Poorter et al., 2010):
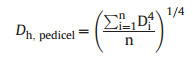
|
where n is the total number of vessels in the cross-section.
Mean diameters of the largest and smallest ten vessels for each pedicel were defined as the maximum (Dmax, pedicel; μm) and minimum (Dmin, pedicel; μm) vessel diameter, respectively. Pedicel vessel density (VDpedicel; no. mm−2) was calculated as the number of vessels per unit pedicel cross-section area. Pedicel vessel lumen fraction (VLFpedicel; %) was calculated as the total vessel lumen area divided by the total cross-sectional area of the pedicel. The theoretical specific hydraulic conductivity (Kt, pedicel, 10−4 kg m−1 s−1 MPa−1) of each pedicel was calculated according to the Hagen–Poiseuille equation (Tyree and Ewers, 1991; Bourbia et al., 2020):
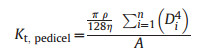
|
where π is the circumference (taken as 3.14), ρ is the fluid density (taken as 1000 kg m−3), and η is the viscosity of water (1.002 × 10⁻⁹ MPa s−1 at 20 ℃) and A is the downstream projected flower area (m2).
2.4. Petal anatomical traitsPetal anatomical traits were analyzed in three to six flowers from different individuals for each species. After collection, flowers were stored in FAA solution (formalin: acetic acid: 70% alcohol = 5: 5: 90). The outermost whorl of petals was measured for all petal anatomical traits for each species. The cross-sections of petals were made using the paraffin embedding method for further measurements of the petal (PT; μm), adaxial epidermis (Adapetal; μm), and abaxial epidermis thickness (Abapetal; μm). Cross-sections of petals were treated in the same way as the cross-sections of pedicels. Moreover, samples were taken from the ca. 100 mm2 area between the midrib and margin of 3–6 petals of each species to measure vein density (Dvein, petal; mm mm−2), stomatal density (SDpetal; no. mm−2), stomatal size (SSpetal; μm2), and epidermal cell size (ECSpetal; μm2). The entire petal was sampled when the petal size was less than about 100 mm2. We put samples in bleach to remove all pigments, and washed the bleach thoroughly with water. Veins were colored by staining with mixtures of 1% Safranin-O and 0.5% Astral Blue for 30 s. The petal vein length was scanned at 3200 dpi using the Epson flatbed scanner (Epson Perfection V850 Pro). Pictures of petal stomata and cross-sections of 3–6 individuals of each species were then collected with a light microscope (Leica Microsystems Ltd., Leica DM2500, Wetzlar, Germany); 5–10 fields of view were taken for each section.
We used the ImageJ software (National Institutes of Health, Bethesda, MD, USA) to measure the petal thickness (PT), adaxial epidermis thickness (Adapetal), abaxial epidermis thickness (Abapetal), vein density (Dvein, petal) as the total vein length per surface area, and stomatal density (SDpetal) as the total number of stomata per surface area. We calculated stomatal size (SSpetal) as the average area of all stomata in 5–10 fields of view (the combined area of a pair of guard cells; Zhang et al., 2018). We calculated epidermal cell size (ECSpetal) as the field of view area divided by the number of epidermal cells on that field of view (the field of view without stomata was selected).
2.5. Flower water loss curveFlower water loss was determined for freshly opened flowers that were collected in the early morning and immediately transported to the laboratory. Flowers were cut from the point of the stalk joining the branch, and FWflower was recorded using an electronic balance with an accuracy of 0.0001 g. The flowers were next soaked in water for several hours (the soaking time was reduced for thinner flowers to prevent petal breakage) and weighed twice until the weight no longer changed and the SWflower was recorded. Flowers were then placed in a constant temperature incubator at 25 ℃ and 65% ambient relative humidity to ensure that all data were measured under the same conditions. Flowers were weighed at half-hour intervals and the next day at 1-h intervals until the weight no longer changed. Flowers were finally oven-dried at 70 ℃ for 48 h to determine the DWflower. The time required to dry the flowers to 70% relative water content (T70, flower; h), a threshold for physiological damage, was calculated by regressing the relative water content against the time interval of each measurement (Lawlor and Cornic, 2002; Hao et al., 2010; Zhang et al., 2015).
2.6. Water potential at petal turgor loss pointPrevious study showed that the relationship between water potential at the turgor loss point (ψtlp) and osmotic potential at full turgor (ψsft) is the same for flowers and leaves, suggesting that the methods for rapidly assessing turgor loss point in leaves from osmometer measurements (Bartlett et al., 2012) can also be applied to flowers (Roddy et al., 2019; Li et al., 2022). Therefore, we measured flower osmotic potential using the VAPOR pressure osmometer model 5600 (ELITechGroup Inc, Logan, USA). We collected fresh flowers together with branches in the early morning, transported these flowers to the laboratory and then immersed them in water. Samples were taken from one outermost, fresh petal of each flower at the center of the midrib and margin, using an 8 mm diameter punch. All discs were wrapped in aluminum foil to prevent evaporation prior to processing and condensation after freezing. The foil-wrapped discs were submerged in liquid nitrogen for approximately 1 min. The discs were pierced 10–15 times with pointed forceps to promote evaporation through the cuticle and reduce equilibration time after each treatment. The discs were immediately put into the osmometer chamber, and the osmolality was measured using the automatic repeated measurement mode until equilibrium (difference between two measurements < 3 mmol kg−1; Bartlett et al., 2012). We recorded the equilibrated osmolality (mmol kg−1), then converted it to osmotic potential (MPa) by multiplying the osmolality by −0.002437 m3 MPa mol−1 following the Van't Hoff relation (Laughlin et al., 2020). The flower water potential at the turgor loss point (ψtlp, flower; MPa) was calculated using the following equation (Bartlett et al., 2012):

|
where ψosm, flower is the flower osmotic potential.
2.7. Statistical analysisWe first calculated the average values for all traits for each species. Because five species had flowers without stomata, a constant (here the means of each stomatal trait) was added to all primary values of each stomatal parameter (i.e., SDpetal, SSpetal and GCLpetal) before data transformation. We then performed log10-transformations for all data to improve the normality and homoscedasticity. Differences in floral traits between aquatic and terrestrial plant groups were analyzed by independent samples t-test, using the t.test function in the "stats" package. Pearson's correlation was used to quantify the relationships among traits in two habitats and the bivariate correlation between each floral trait and the first and second principal component axes, which were calculated by the rcorr function in the "Hmisc" package. To determine whether common regressions between floral traits were applied across the two habitats, we performed the standardized major axis analysis (SMA) using the sma function of the "smatr" package (Warton et al., 2012). We also performed principal component analysis (PCA) using the prcomp function in the "stats" package to determine how aquatic and terrestrial flowers were positioned in the multivariate trait space. The phylogenetic tree (Fig. 1) was reconstructed using the phylo.maker function in the "V.PhyloMaker2" package (Jin and Qian, 2022). All analyses were performed in R v.4.2.1 (R Core Team, 2020).
3. Results 3.1. Differences in floral traits between aquatic and terrestrial plantsAfter comparing 27 floral traits between six terrestrial and six aquatic species, we found that 23 in 27 floral traits were not significantly different between plants in the two habitats (Fig. 2 and Table S1). Petal thickness in terrestrial plants (581.02 ± 124.36 μm) was significantly higher than that in aquatic plants (304.56 ± 56.89 μm, P = 0.049). Petal epidermal cell size in terrestrial plants (4849.76 ± 923.75 μm2) was three times greater than that in aquatic plants (1573.67 ± 269.82 μm2, P = 0.002). Similarly, the mean adaxial and abaxial epidermis thicknesses in terrestrial plants (36.50 ± 2.07 μm and 26.48 ± 1.07 μm, respectively) were significantly higher than that in aquatic plants (19.89 ± 2.16 μm and 16.43 ± 1.50 μm, respectively, P < 0.001).

|
| Fig. 2 Micrographs showing the pedicel cross-section (A, F) and vessels (B, G), the petal cross-section (C, H), stomata and epidermal cells (D, I), and vein density (E, J) for a representative aquatic (Nymphaea Mmexicana; A–E) and a terrestrial flower (Paphiopedilum hirsutissimum; F–J). No stomata were found in Paphiopedilum hirsutissimum (I). |
Floral longevity (FL; R2 = 0.43, P < 0.05), flower dry matter content (FDMC; R2 = 0.51, P < 0.01), petal stomatal density (SDpetal; R2 = 0.38, P < 0.05) and time required for drying of saturated flowers to 70% RWC (T70, flower; R2 = 0.42, P < 0.05) increased with flower mass per area (FMA) across aquatic and terrestrial species (Fig. 3 and Table S2). Aquatic plants showed higher value of intercept for the regressions of FMA against FDMC (Table S3).

|
| Fig. 3 Log–log bivariate relationships of flower mass per area (FMA) with (a) floral longevity (FL), (b) flower dry matter content (FDMC), (c) petal stomatal density (SDpetal), and (d) time required for drying of saturated flowers to 70% relative water content (T70, flower) across aquatic (blue) and terrestrial plants (pink). Because SDpetal of five species were zero, a constant of 2.11 (here the means of stomatal density for all species) was added to all primary values of SDpetal before data transformation. Regression lines, R2 and significant levels are shown. *, P < 0.05; **, P < 0.01. |
Floral longevity was positively associated with T70, flower (R2 = 0.82, P < 0.001; Fig. 4a) and flower relative water content (RWCflower; R2 = 0.43, P < 0.05; Fig. 4b) across aquatic and terrestrial species. Floral area was positively correlated with pedicel maximum vessel diameter (Dmax, pedicel; R2 = 0.40, P < 0.05; Fig. 4c) and negatively correlated with pedicel vessel density (VDpedicel; R2 = 0.45, P < 0.05; Fig. 4d) across aquatic and terrestrial species.

|
| Fig. 4 Log–log bivariate relationships of floral longevity (FL) with (a) time required for drying of saturated flowers to 70% relative water content (T70, flower) and (b) flower relative water content (RWCflower), and floral area (FA) with (c) pedicel maximum vessel diameter (Dmax, pedicel) and (d) pedicel vessel density (VDpedicel) across aquatic (blue) and terrestrial plants (pink). The significance of regressions are indicated by *, P < 0.05; ***, P < 0.001. |
Pedicel theoretical hydraulic conductivity (Kt, pedicel) was negatively linked with construction cost of flowers (CCflower; R2 = 0.44, P < 0.05; Fig. 5a) and positively correlated with pedicel hydraulic diameter (Dh, pedicel; R2 = 0.45, P < 0.05; Fig. 5b) with common regression equations across aquatic and terrestrial species (Table S3). Flower water potential at the turgor loss points (ψtlp, flower) was significantly and negatively related to FDMC (R2 = 0.40, P < 0.05; Fig. 5c) and was significantly and positively related to pedicel vessel lumen fraction (VLFpedicel; R2 = 0.32, P < 0.05; Fig. 5d) across aquatic and terrestrial species.

|
| Fig. 5 Log–log bivariate relationships of pedicel theoretical hydraulic conductivity (Kt, pedicel) with (a) construction cost of flowers (CCflower) and (b) pedicel hydraulic diameter (Dh, pedicel) and the relationships of flower water potential at the turgor loss point (ψtlp, flower) with (c) flower dry matter content (FDMC) and pedicel vessel lumen fraction (VLFpedicel) across aquatic (blue) and terrestrial plants (pink). Regression lines, R2 and significant levels are shown. *, P < 0.05. |
The results of the principal component (PC) analysis showed that the first two PC axes explained 32.4% and 21.1% of the variation in 27 traits across the six aquatic and six terrestrial species, respectively (Fig. 6). The first axis (PC1) was represented by a trade-off between traits representing higher construction cost (e.g., higher Dvein, petal, CCflower) and traits representing higher hydraulic conductivity (e.g., Kt, pedicel, Dmax, pedicel) (Fig. 6 and Table S4). The second axis (PC2) was mainly represented by a trade-off between petal epidermal cell size (ECSpetal) and FDMC (Fig. 6 and Table S4).

|
| Fig. 6 Principal component (PC) analysis using log10-transformed mean values for 27 traits of six aquatic (blue circle) and six terrestrial (pink circle) species. See Table 1 for trait abbreviations. The unit of ψtlp, flower is -MPa. |
This is the first study to investigate the relationships between flower economics and hydraulic traits across aquatic and terrestrial herbaceous plants. We found that flowers of aquatic and terrestrial plants follow the same economics spectrum rules, and flower economics traits are closely related to their hydraulic traits. These results suggest the coordination and trade-offs at the level of floral organs are independent of environmental conditions. In addition, we found that flowers of aquatic plants are characterized by thinner petals and epidermis and smaller epidermal cells compared to terrestrial plants, which suggests that flowers might be able to adjust their structures and functions according to their habitats to achieve a balance between growth and reproduction.
4.1. Similar flower economics spectrum pattern in aquatic and terrestrial plantsOur results show that flowers of aquatic and terrestrial plants follow the same economics spectrum pattern, confirming our hypothesis. For instance, flower mass per area was significantly and positively correlated with floral longevity and flower dry matter content across aquatic and terrestrial herbaceous plants (Fig. 3a and b). However, flower mass per area, floral longevity, and flower dry matter content were not correlated with flower nitrogen concentration (Table S2). This suggests that the flower economics spectrum might be mainly determined by floral traits related to carbon cost rather than by flower nitrogen concentration. Furthermore, we found that floral traits associated with carbon cost were closely related to the hydraulic traits across aquatic and terrestrial plants. For example, petal stomatal density and time required for drying of saturated flowers to 70% relative water content increased with flower mass per area in these two habitats, implying that flower mass per area is closely related to the rate of water loss in flowers (Fig. 3c and d). Additionally, we found that long-lived flowers usually have slower water loss rates and higher water storage capacity in both aquatic and terrestrial plants (Fig. 4a and b). This could be because longer-lived flowers tend to possess a higher flower mass per area to improve their water retention time when facing water deficit. The significant positive correlation between floral area and pedicel maximum vessel diameter suggests that the higher floral area requires higher water cost (Fig. 4c). This is consistent with Lambrecht (2013), who found that water may indirectly limit flower size in drought environments. In addition, a meta-analysis based on global data supports the conclusion that water availability limits flower size (Kuppler and Kotowska, 2021).
The flower water potential at the turgor loss point has been considered a key indicator of drought tolerance in flowers. The significant negative correlation of flower turgor loss point with its dry matter content and the positive correlation with its pedicel vessel lumen fraction (Fig. 5c and d) indicate that flowers increase their drought tolerance by allocating more resources to the structural construction cost. Moreover, across six aquatic and six terrestrial species, pedicel theoretical hydraulic conductivity was significantly negatively correlated with the construction cost of flowers and positively correlated with pedicel hydraulic diameter (Fig. 5a and b), suggesting a trade-off of the carbon investment between the floral water transport system and flower structural construction. Standard major axis regression analysis results also supported such a pattern, although floral traits were highly variable among species. These findings indicate that flower economics and hydraulic traits might be tightly coupled across diverse plant taxa.
4.2. Flowers may have additional water transport pathways aside from the xylemWe found weak correlations between stomata and veins in flowers, which do not suggest that water supply and demand are out of balance; instead, they refer to the contribution of the cuticle to water loss in flowers or the existence of extra water supply pathways in flowers (e.g., water supply through the phloem). It is well acknowledged that the flower xylem is the primary water transport channel. For instance, flowers of Magnoliaceae and Calycanthaceae have been shown to transport water primarily through their xylem (Feild et al., 2009; Roddy et al., 2018). Water flows from high to low water potential in the xylem; however, previous studies have suggested that water potential gradients between flowers and stems appear to be reversed (Alexmander, 1990; Trolinder et al., 1993; Chapotin et al., 2003). Some flowers of eudicots have a higher water potential than bracts and leaves (Trolinder et al., 1993; Chapotin et al., 2003). According to this reverse gradient, the direction of water flow should occur from flowers to leaves (Chapotin et al., 2003). In addition, floral and fruit water potentials are not influenced by water status in some species (e.g., Trolinder et al., 1993). It has also been found that the majority (70%) of sap flow transported to the fruits occurs through the phloem (Araki et al., 2004). These findings indicate that flowers are hydrated mainly through the phloem rather than xylem (Ho et al., 1987; Trolinder et al., 1993; Araki et al., 2004). However, Harrison Day et al. (2022) demonstrated that under water stress during a phloem girdling experiment the xylem is the main conduit of water supply to fruits (tomato). Taken together, these studies and our present study imply that alternative water transport pathways are present in flowers. A combination of anatomical, morphological, and hydraulic traits could provide new insights into the water transport mechanisms of flowers.
4.3. Aquatic and terrestrial plant flowers: differences and similaritiesIn the present study, four flower hydraulic traits of aquatic plants were significantly different from those of terrestrial plants, suggesting that aquatic plant flowers indeed possess some unique characteristics. For instance, aquatic flowers had a thinner epidermis and petal than terrestrial flowers. The epidermis, an external covering layer of the plant organs, often responds to environmental conditions since it is in direct contact with the outside environment. Many structural traits of the epidermis are related to their physiological functions. For example, the outer wall of epidermal cells usually has cuticle and wax, which limits transpiration (Schreiber and Riederer, 1996; Riederer and Schreiber, 2001). Given that aquatic plants have access to abundant water, they do not need to accumulate thick wax and develop thick epidermis to reduce cuticle transpiration. In contrast, they employ a luxurious water use strategy, which could be beneficial for acquiring nutrients for flower development.
Furthermore, we found that the variation in flower economics and hydraulic traits was large across terrestrial and aquatic plants (Table S1) with two plant groups greatly overlapping in the multivariate trait space (Fig. 6). For instance, floral longevity, floral area, flower mass per area, and pedicel vessel density varied widely among species. Floral longevity ranges from 8 h in Nymphoides cristata to 34 days in Paphiopedilum hirsutissimum, which is consistent with a previous study (Song et al., 2022) in which floral longevity varied 400-fold and ranged from 2 h (Heteracia szovitsii) to 33 days (Telipogon peruvianus), with average floral longevity of 4.53 ± 0.14 days. Zhang et al. (2017) found greater variability in flower mass per area even in plants from the same family. Roddy et al. (2019) also found that flowers had more diverse hydraulic traits. The great variation in flower hydraulic and economics traits among terrestrial and aquatic plants may facilitate their adaptation to different environments.
5. ConclusionsWe found that flowers follow a similar economics spectrum pattern across aquatic and terrestrial plants and that there is a strong linkage between economics and hydraulic traits of flowers. Increasing flower hydraulic conductivity usually comes at the cost of reducing flower structure construction, and enhanced flower drought tolerance requires higher carbon investments. In addition, aquatic plants had thinner petals and epidermis and smaller epidermal cell size compared to terrestrial plants. We strongly recommend further investigations of the linkages between flower hydraulics and economics across diverse plant taxa in different habitats in order to reveal a comprehensive understanding of how flowers maintain carbon and water balances.
AcknowledgementsThis work was supported by the National Natural Science Foundation of China (32171507, 31870385, 31901285) and CAS "Light of West China" program. The Institutional Center for Shared Technologies and Facilities of Xishuangbanna Tropical Botanical Garden, Chinese Academy of Sciences analyzed the flower nutrient concentrations. The Centre for Gardening and Horticulture of Xishuangbanna Tropical Botanical Garden, Chinese Academy of Sciences provided data on flower phenology. We thank the two reviewers for their constructive comments that improved the quality of this manuscript.
Author contributions
Y.K. and J.L.Z. conceived and designed the study. Y.K., W.L. and Q.W. performed the experiments. Y.K., F.P.Z., Y.B.Z., J.L.Z. and K.F.C. analyzed the data. Y.K. wrote the draft of the manuscript. All authors read, commented and approved the final version of the manuscript.
Declaration of competing interest
The authors declare that they have no known competing financial interests or personal relationships that could have appeared to influence the work reported in this paper.
Appendix A. Supplementary data
Supplementary data to this article can be found online at https://doi.org/10.1016/j.pld.2023.01.006.
Alcantara, S., Lohmann, L.G., 2010. Evolution of floral morphology and pollination system in Bignonieae (Bignoniaceae). Am. J. Bot., 97: 782-796. DOI:10.3732/ajb.0900182 |
Alexander, L., 1990. Xylem, phloem and transpiration flows in developing apple fruits. J. Exp. Bot., 41: 645-651. DOI:10.1093/jxb/41.6.645 |
Araki, T., Eguchi, T., Wajima, T., et al., 2004. Dynamic analysis of growth, water balance and sap fluxes through phloem and xylem in a tomato fruit: short-term effect of water stress. Environ. Control Biol., 42: 225-240. DOI:10.2525/ecb1963.42.225 |
Ashman, T.L., Schoen, D.J., 1994. How long should flowers live?. Nature, 371: 788-791. DOI:10.1038/371788a0 |
Ashman, T.L., Schoen, D.J., 1997. The cost of floral longevity in Clarkia tembloriensis: an experimental investigation. Evol. Ecol., 11: 289-300. DOI:10.1023/A:1018416403530 |
Bartlett, M.K., Scoffoni, C., Ardy, R., et al., 2012. Rapid determination of comparative drought tolerance traits: using an osmometer to predict turgor loss point. Methods Ecol. Evol., 3: 880-888. DOI:10.1111/j.2041-210X.2012.00230.x |
Bourbia, I., Carins-Murphy, M.R., Gracie, A., et al., 2020. Xylem cavitation isolates leaky flowers during water stress in pyrethrum. New Phytol., 227: 146-155. DOI:10.1111/nph.16516 |
Chapotin, S.M., Holbrook, N.M., Morse, S.R., et al., 2003. Water relations of tropical dry forest flowers: pathways for water entry and the role of extracellular polysaccharides. Plant Cell Environ., 26: 623-630. DOI:10.1046/j.1365–3040.2003.00998.x |
Chave, J., Coomes, D., Jansen, S., et al., 2009. Towards a worldwide wood economics spectrum. Ecol. Lett., 12: 351-366. DOI:10.1111/j.1461–0248.2009.01285.x |
E-Vojtkó, A., Junker, R.R., de Bello, F., et al., 2022. Floral and reproductive traits are an independent dimension within the plant economic spectrum of temperate central Europe. New Phytol., 236: 1964-1975. DOI:10.1111/nph.18386 |
Fang, X.W., Turner, N.C., Yan, G., et al., 2010. Flower numbers, pod production, pollen viability, and pistil function are reduced and flower and pod abortion increased in chickpea (Cicer arietinum L.) under terminal drought. J. Exp. Bot., 61: 335-345. DOI:10.1093/jxb/erp307 |
Feild, T.S., Chatelet, D.S., Brodribb, T.J., 2009. Giant flowers of southern magnolia are hydrated by the xylem. Plant Physiol., 150: 1587-1597. DOI:10.1104/pp.109.136127 |
Fenster, C.B., Armbruster, W.S., Wilson, P., et al., 2004. Pollination syndromes and floral specialization. Annu. Rev. Ecol. Evol. Syst., 35: 375-403. DOI:10.1146/annurev.ecolsys.34.011802.132347 |
Galen, C., 1989. Measuring pollinator‒mediated selection on morphometric floral traits: bumblebees and the alpine sky pilot, Polemonium viscosum.. Evolution, 43: 882-890. |
Galen, C., 1999. Why do flowers vary? The functional ecology of variation in flower size and form within natural plant populations. Bioscience, 49: 631-640. DOI:10.2307/1313439 |
Galen, C., 2005. It never rains but then it pours: the diverse effects of water on flower integrity and function. In: Reekie, E., Bazzaz, F.A. (Eds.), Reproductive Allocation in Plants. Elsevier Press, San Diego, CA, USA, pp. 77–95.
|
Galen, C., Sherry, R.A., Carroll, A.B., 1999. Are flowers physiological sinks or faucets? Costs and correlates of water use by flowers of Polemonium viscosum. Oecologia, 118: 461-470. DOI:10.1007/s004420050749 |
Gleason, S.M., 2018. A blooming interest in the hydraulic traits of flowers. Plant Cell Environ., 41: 2247-2249. DOI:10.1111/pce.13345 |
Hao, G.Y., Sack, L., Wang, A.Y., et al., 2010. Differentiation of leaf water flux and drought tolerance traits in hemiepiphytic and non-hemiepiphytic Ficus tree species. Funct. Ecol., 24: 731-740. DOI:10.1111/j.1365–2435.2010.01724.x |
Harrison Day, B.L., Carins-Murphy, M.R., Brodribb, T.J., 2022. Reproductive water supply is prioritized during drought in tomato. Plant Cell Environ., 45: 69-79. DOI:10.1111/pce.14206 |
Herrera, J., 2005. Flower size variation in Rosmarinus officinalis: individuals, populations and habitats. Ann. Bot., 95: 431-437. |
Ho, L.C., Grange, R.I., Picken, A.J., 1987. An analysis of the accumulation of water and dry matter in tomato fruit. Plant Cell Environ., 10: 157-162. DOI:10.1111/1365-3040.ep11602110 |
Jin, Y., Qian, H., 2022. V. PhyloMaker2: an updated and enlarged R package that can generate very large phylogenies for vascular plants. Plant Divers., 44: 335-339. DOI:10.1016/j.pld.2022.05.005 |
Kuppler, J., Kotowska, M.M., 2021. A meta-analysis of responses in floral traits and flower‒visitor interactions to water deficit. Global Change Biol., 27: 3095-3108. DOI:10.1111/gcb.15621 |
Lambrecht, S.C., 2013. Floral water costs and size variation in the highly selfing Leptosiphon bicolor (Polemoniaceae). Int. J. Plant Sci., 174: 74-84. DOI:10.1086/668230 |
Lambrecht, S.C., Dawson, T.E., 2007. Correlated variation of floral and leaf traits along a moisture availability gradient. Oecologia, 151: 574-583. DOI:10.1007/s00442-006-0617-7 |
Lambrecht, S.C., Santiago, L.S., DeVan, C.M., et al., 2011. Plant water status and hydraulic conductance during flowering in the southern California coastal sage shrub Salvia mellifera (Lamiaceae). Am. J. Bot., 98: 1286-1292. DOI:10.3732/ajb.1000514 |
Laughlin, D.C., Delzon, S., Clearwater, M.J., et al., 2020. Climatic limits of temperate rainforest tree species are explained by xylem embolism resistance among angiosperms but not among conifers. New Phytol., 226: 727-740. DOI:10.1111/nph.16448 |
Lawlor, D.W., Cornic, G., 2002. Photosynthetic carbon assimilation and associated metabolism in relation to water deficits in higher plants. Plant Cell Environ., 25: 275-294. DOI:10.1046/j.0016-8025.2001.00814.x |
Li, J.W., Zhou, Y., Zhang, Z.B., et al., 2022. Complementary water and nutrient utilization of perianth structural units help maintain long floral lifespan in Dendrobium. J. Exp. Bot.: erac479. |
Mommer, L., Wolters-Arts, M., Andersen, C., et al., 2007. Submergence-induced leaf acclimation in terrestrial species varying in flooding tolerance. New Phytol., 176: 337-345. DOI:10.1111/j.1469–8137.2007.02166.x |
Pierce, S., Brusa, G., Sartori, M., et al., 2012. Combined use of leaf size and economics traits allows direct comparison of hydrophyte and terrestrial herbaceous adaptive strategies. Ann. Bot., 109: 1047-1053. DOI:10.1093/aob/mcs021 |
Poorter, H., Niinemets, Ü., Poorter, L., et al., 2009. Causes and consequences of variation in leaf mass per area (LMA): a meta-analysis. New Phytol., 182: 565-588. DOI:10.1111/j.1469–8137.2009.02830.x |
Poorter, L., McDonald, I., Alarcón, A., et al., 2010. The importance of wood traits and hydraulic conductance for the performance and life history strategies of 42 rainforest tree species. New Phytol., 185: 481-492. DOI:10.1111/j.1469–8137.2009.03092.x |
Primack, R.B., 1985. Longevity of individual flowers. Annu. Rev. Ecol. Evol. Syst., 16: 15-37. DOI:10.1146/annurev.es.16.110185.000311 |
R Core Team, 2020. R: A Language and Environment for Statistical Computing. R Foundation for Statistical Computing, Vienna, Austria. Retrieved from. https://www.R-project.org/.
|
Rering, C.C., Franco, J.G., Yeater, K.M., et al., 2020. Drought stress alters floral volatiles and reduces floral rewards, pollinator activity, and seed set in a global plant. Ecosphere, 11: e03254. DOI:10.1002/ecs2.3254 |
Riederer, M., Schreiber, L., 2001. Protecting against water loss: analysis of the barrier properties of plant cuticles. J. Exp. Bot., 52: 2023-2032. DOI:10.1093/jexbot/52.363.2023 |
Roddy, A.B., Dawson, T.E., 2012. Determining the water dynamics of flowering using miniature sap flow sensors. Acta Hortic., 951: 47-53. DOI:10.17660/ActaHortic.2012.951.4 |
Roddy, A.B., Brodersen, C.R., Dawson, T.E., 2016. Hydraulic conductance and the maintenance of water balance in flowers. Plant Cell Environ., 39: 2123-2132. DOI:10.1111/pce.12761 |
Roddy, A.B., Simonin, K.A., McCulloh, K.A., et al., 2018. Water relations of Calycanthus flowers: hydraulic conductance, capacitance, and embolism resistance. Plant Cell Environ., 41: 2250-2262. DOI:10.1111/pce.13205 |
Roddy, A.B., Jiang, G.F., Cao, K.F., et al., 2019. Hydraulic traits are more diverse in flowers than in leaves. New Phytol., 223: 193-203. DOI:10.1111/nph.15749 |
Roddy, A.B., Martínez-Perez, C., Teixido, A.L., et al., 2021. Towards the flower economics spectrum. New Phytol., 229: 665-672. DOI:10.1111/nph.16823 |
Ronzhina, D.A., P'yankov, V.I., 2001. Structure of the photosynthetic apparatus in leaves of freshwater hydrophytes: 1. General characteristics of the leaf mesophyll and a comparison with terrestrial plants. Russ. J. Plant Physiol., 48: 567-575. DOI:10.1023/A:1016733015194 |
Saatkamp, A., Cochrane, A., Commander, L., et al., 2019. A research agenda for seed-trait functional ecology. New Phytol., 221: 1764-1775. DOI:10.1111/nph.15502 |
Schreiber, L., Riederer, M., 1996. Ecophysiology of cuticular transpiration: comparative investigation of cuticular water permeability of plant species from different habitats. Oecologia, 107: 426-432. DOI:10.1007/BF00333931 |
Soltis, P.S., Soltis, D.E., 2014. Flower diversity and angiosperm diversification. In: Riechmann, J., Wellmer, F. (Eds.), Flower Development. Methods in Molecular Biology. Humana Press, New York, USA, pp. 85–102.
|
Song, B., Sun, L., Barrett, S.C., et al., 2022. Global analysis of floral longevity reveals latitudinal gradients and biotic and abiotic correlates. New Phytol., 235: 2054-2065. DOI:10.1111/nph.18271 |
Teixido, A.L., Valladares, F., 2015. Temperature-limited floral longevity in the large-flowered Mediterranean shrub Cistus ladanifer (Cistaceae). Int. J. Plant Sci., 176: 131-140. DOI:10.1086/679477 |
Teixido, A.L., Valladares, F., 2019. Heat and drought determine flower female allocation in a hermaphroditic Mediterranean plant family. Plant Biol., 21: 1024-1030. DOI:10.1111/plb.13031 |
Trolinder, N.L., Mcmichael, B.L., Upchurch, D.R., 1993. Water relations of cotton flower petals and fruit. Plant Cell Environ., 16: 755-760. DOI:10.1111/j.1365–3040.1993.tb00496.x |
Tyree, M.T., Ewers, F.W., 1991. The hydraulic architecture of trees and other woody plants. New Phytol., 119: 345-360. DOI:10.1111/j.1469–8137.1991.tb00035.x |
Usherwood, J.R., Ennos, A.R., Ball, D.J., 1997. Mechanical and anatomical adaptations in terrestrial and aquatic buttercups to their respective environments. J. Exp. Bot., 48: 1469-1475. DOI:10.1093/jxb/48.7.1469 |
Van der Niet, T., Johnson, S.D., 2012. Phylogenetic evidence for pollinator-driven diversification of angiosperms. Trends Ecol. Evol., 27: 353-361. DOI:10.1016/j.tree.2012.02.002 |
Vertregt, N., Penning De Vries, F.W.T., 1987. A rapid method for determining the efficiency of biosynthesis of plant biomass. J. Theor. Biol., 128: 109-119. DOI:10.1016/S0022-5193(87)80034-6 |
Warton, D.I., Duursma, R.A., Falster, D.S., et al., 2012. Smatr 3-an R package for estimation and inference about allometric lines. Methods Ecol. Evol., 3: 257-259. DOI:10.1111/j.2041-210X.2011.00153.x |
Wright, I.J., Reich, P.B., Westoby, M., et al., 2004. The worldwide leaf economics spectrum. Nature, 428: 821-827. DOI:10.1038/nature02403 |
Zhang, S.B., Dai, Y., Hao, G.Y., et al., 2015. Differentiation of water-related traits in terrestrial and epiphytic Cymbidium species. Front. Plant Sci., 6: 260. |
Zhang, F.P., Yang, Y.J., Yang, Q.Y., et al., 2017a. Floral mass per area and water maintenance traits are correlated with floral longevity in Paphiopedilum (Orchidaceae). Front. Plant Sci., 8: 501. |
Zhang, L.X., Ma, D., Xu, J.S., et al., 2017b. Economic trade-offs of hydrophytes and neighbouring terrestrial herbaceous plants based on plant functional traits. Basic Appl. Ecol., 22: 11-19. DOI:10.1016/j.baae.2017.06.004 |
Zhang, F.P., Carins Murphy, M.R., Cardoso, A.A., et al., 2018. Similar geometric rules govern the distribution of veins and stomata in petals, sepals and leaves. New Phytol., 219: 1224-1234. DOI:10.1111/nph.15210 |