b. Yangtze River Basin Ecological Environment Monitoring and Scientific Research Center, Yangtze River Basin Ecological Environment Supervision and Administration Bureau, Ministry of Ecological Environment, Wuhan 430072, China
The phyllosphere comprises aerial or above-ground plant parts, including leaves, stems, flowers, and fruits (Lindow and Brandl, 2003; Knief et al., 2010), with leaves as the predominant component (Vorholt, 2012). This heterogeneous habitat is frequently exposed to varying environmental conditions, including temperature fluctuations, ultraviolet radiations, nutrient stress, relative humidity, and desiccation. The phyllosphere harbors a plethora of microbial communities, including eukaryotic algae well adapted to these inhospitable conditions. Although many studies have focused on the composition of bacterial and fungal communities in the phyllosphere (Vorholt, 2012; Turner et al., 2013; Copeland et al., 2015; Laforest-Lapointe et al., 2017; Morella et al., 2018), less attention has been paid to the phyllosphere algal community.
Most previous research on phyllosphere algal communities has focused on describing new species rather than characterizing diversity and community composition (Suto and Ohtani, 2009; Li et al., 2020b). Cultivation-independent studies have suggested that a large number of unknown and cryptic algal species are abundant on rainforest leaves (Neustupa 2003; Neustupa and Škaloud, 2008; Neustupa et al., 2011). Moreover, researchers have reported that the principal members of these phyllosphere algal communities are cyanobacteria and green microalgae, such as coccoid Trebouxiophycean algae and branched Trentepohliacean algae (Neustupa and Škaloud, 2010; Zhu et al., 2018). Additional studies have used environmental sequencing to reveal new genera (Němcová et al., 2011). However, quantitative analyses of the composition of phyllosphere algal communities and associated environmental factors are still limited.
The humid rainy climate and extraordinarily high biodiversity of tropical or subtropical rainforests are favorable sites to investigate phyllosphere algal communities (Lopez-Bautista et al., 2007; Neustupa and Škaloud, 2008). The subaerial habitats of rainforests represent one of the least known algal habitats worldwide. The purpose of this study was to identify the environmental factors that drive phyllosphere microalgal community composition and diversity in rainforests. For this purpose, we used single molecule real-time sequencing of full-length 18S rDNA to characterize the composition of phyllosphere microalgal communities growing on different host tree species (Ficus tikoua, Caryota mitis, Arenga pinnata, and Musa acuminata) in various forest types during different seasons at Xishuangbanna Tropical Botanical Garden (XTBG). The results of this study contribute to our understanding of phyllosphere algal communities.
2. Materials and methods 2.1. Sampling sites and sample collectionAll sampling sites were located in Xishuangbanna Tropical Botanical Garden, Yunnan Province, China (XTBG) (21°41′N, 101°25′E) at the northern edge of the southeast Asian tropical zone and in the northern tropical monsoon climate zone. The dry season (November–April) and rainy season (May–October) are distinct throughout the year. Climate data during 2014–2019 were obtained from Xishuangbanna Station for Tropical Rain Forest Ecosystem Studies (XSTRE located in XTBG).
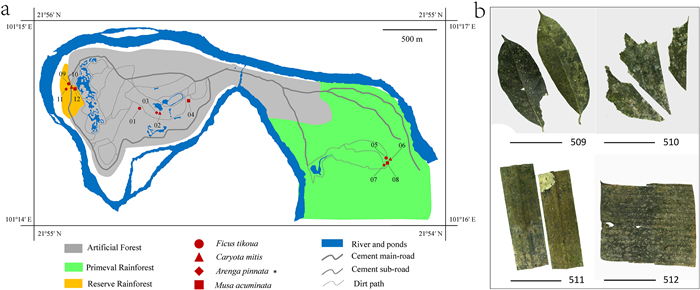
XTBG was divided into three sampling areas according to the forest types (Fig. 1a): planted forest (comprises cultivated single group plants for sightseeing, scientific research, or plant protection), primeval rainforest (a large part of rainforest almost without human interference, connected to the primeval rainforest), and reserve rainforest (a small rainforest patch reserved and under development). A total of 48 samples were collected from four tree species (Ficus tikoua, Caryota mitis, Arenga pinnata, and Musa acuminata) common to the three forest types. F. tikoua was collected at the end of May (the first month of the rainy season) 2018; C. mitis in August (one of the highest rainfall months) 2018; A. pinnata in November (the first month of the dry season) 2018, and M. acuminata in February (the least rainfall month) 2019. Images of leaves from each tree are shown in Fig. 1b.
|
| Fig. 1 Sampling sites and representative samples. (a) Details of the 12 sampling sites in XTBG. Different forest types (three forest types) are shown by different bottom colors. Four symbols of different shapes represent the four kinds of host plants. (b) Pictures of four representative samples collected in May 2018 from Ficus tikoua (509), Caryota mitis (510), Arenga pinnata (511) and Musa acuminata (512). Scale bars 10 cm. |
Each sample, comprising 3 leaves (or tissues from different leaves), was collected from 1.5 to 2.0 m above the ground from the specified tree, and was divided into two parts, one for DNA extraction and the other for the determination of Chlorophyll-a (Chla), nitrogen, and phosphorus nutrients. The leaves were scanned on white paper with a scale bar using SmartScan CK410 (Unls Document Solutions, Beijing, China), and the area was computed by Image-Pro Plus 6.0 software (Media Cybernetics, Los Angeles, CA, USA). The biofilm was scraped off the leaves with a sterile scalpel and stored in 10-mL reaction tubes at −80 ℃ for further processing.
To verify the universality of the primers used in this study and their potential for revealing the relative abundance of the algal species in the samples, a preliminary experiment was conducted based on a simulated environmental DNA sample that consisted of 43 pure culture algal DNA extracts, including those belonging to Trebouxiophyceae, Ulvophyceae, and Chlorophyceae (detailed information can be found in Supplementary Material Table S1).
2.2. Determination of Chla, nitrogen, and phosphorus nutrientsEntire microbial communities on the leaf surfaces were scraped off with sterile blades and put into sterile bottles containing 500 mL of double-distilled water, and shook in an Orbital Shaker HY-5 (Shang Hai Xiang Fan Instrument, Co., Shanghai, China) for 2 h to ensure that all the soluble nutrients were well dissolved. The Chla, total nitrogen (TN), ammonium (NH4+-N), nitrite nitrogen (NO2−-N), nitrate nitrogen (NO3−-N), total phosphorus (TP), and soluble reactive phosphorus (SRP) were measured following national standard methods (APHA, 2012).
2.3. DNA extraction, PCR amplification, sequencing, and operational taxonomic unit clusteringAlgal cells from the biofilm samples were lysed with liquid nitrogen, and pure culture strains were lysed with mini beads in a bead beater (3110BX, Biospec Products, Bartlesville, Oklahoma, USA). Genomic DNA was extracted with HP PlantDNA Kit (Omega Bio-Tek, Norcross, Georgia, USA) following manufacturer's instructions and stored at −20 ℃.
To create the simulated environmental DNA sample, DNA from each of 43 pure culture algal strains was extracted as described above and DNA concentrations were measured using a NanoDrop 8000 (Thermo Fisher Scientific, MA, USA). Subsequently, the 43 DNA extracts were mixed at a certain volume (Table S1). The 18S rDNA sequences of the 43 pure culture strains were first amplified by PCR, and the products were sequenced using Sanger dideoxy sequencing (sequence information is presented in Table S1, and the sequences are provided as a supplementary file named "43 pure cultured strains 18S sequences.fas"). The full-length 18S rDNA gene was amplified in a 50-μL reaction mixture with eukaryotic universal primers, Euk18SA (forward: 5′-AACCTGGTTGATCCTGCCAGT-3′) and Euk18SB (reverse: 5′-GATCCTTCTGCAGGTTCACCTAC-3′) (Medlin et al., 1988). The amplification products of simulated environmental DNA sample and 48 environmental DNA samples (or biofilm samples) were sequenced by Frasergen (Wuhan, China) using Pacbio Squeal platform (Pacbio, California, USA) for single molecule real-time sequencing following the manufacturer's protocol.
Quality control analysis of the Pacbio Squeal polymerase reads was performed using SMRT Link v.7.0 (Pacbio, CA, USA). To test the sequencing depth of the obtained data, the rarefaction curves were calculated by QIIME1 v.1.9.1with the python script single_rarefaction.py (Caporaso et al., 2010) (https://qiime2.org). In this study, when the sequences were not adjusted into the same direction, a total of 8792 OTUs were obtained; however, after adjusting the sequences into the same direction (5′–3′), only 1201 OTUs were acquired, indicating that it is essential to adjust all the reads into the same direction before OTU clustering. Thus, all reads were reoriented into 5′–3′ direction, and primer artifacts were removed using Cutadapt 2.7 (Martin, 2011). According to PacBio's 18S full-length amplicon process, reads with length of > 2000 bp should be removed. However, for many algal taxa, one or several introns always occur in the 18S rDNA gene sequences, resulting in length > 2000 bp (Liu et al., 2018a, 2018b). Among the 43 pure culture strains examined in the present study, nine 18S sequences with length > 2000 bp were detected, with the longest sequence length being 3248 bp (Jaagichlorella sp. LI-7201). Therefore, sequences with length between 1500 and 4000 bp were retained for further analysis.
In most previous studies involving next-generation sequencing, the lengths of sequences/reads is about 200–300 bp and are split into operational taxonomic units (OTUs) at a threshold of 97% similarity, a widely accepted standard (Yu et al., 2015; Wang et al., 2019; Xia et al., 2020). However, studies based on high-throughput sequencing of full-length 18S rDNA sequences lacks standards. Zhu et al. (2018) split full-length 18S rDNA sequences into OTUs at 98% similarity, whereas Salmaso et al. (2020) deemed that the 1% similarity cutoff for clustering 18S rDNA sequences into OTUs was reliable to exclude intragenomic sequence variations. Furthermore, Gong et al. (2013) showed that the minimum similarity between two 18S rDNA copies from the same individual ciliates was 99.1%, whereas the average similarity among copies of the same cell was 99.7–99.9%. In this study, we split sequences into OTUs at a 99% similarity level after removing the chimeric sequences by USEARCH tool using the UCHIME algorithm and unoise3 algorithm (Edgar et al., 2011) (http://www.drive5.com/usearch). The OTUs with fewer than two sequences were removed, and USEARCH was used to construct the relative abundance matrix (OTU table). To achieve comparable quantification among samples, the OTU table was resampled to a minimum number of sequences from each sample. Representative sequences of OTUs were assigned to taxonomic lineages with BLASTn search of the nucleotide NCBI database (updated February, 2022). The taxonomic information of algal OTUs was manually checked to ensure that the specific name of the closest matching sequence was correct and revised if it had been recently transferred to a different taxonomic group. Similarity of each representative algal OTU sequence with the closest matching sequence was collected within the OTU table. The sequence reads were submitted to the SRA of the NCBI database under the BioProject ID PRJNA682900 (Accession Nos. SAMN17013616–SAMN17013664).
2.4. Statistical analysisThe species tree of the algal OTUs was constructed using R 4.0.2 (creating edge and node files) and Cytoscape v.3.6.0 (Kohl et al., 2011). Pielou's evenness J (Pielou, 1966) was calculated using the vegan package for R (Oksanen et al., 2007) and based on OTU-level results. The Chla concentration was used as an estimator of biomass (Richards and Thompson, 1952). Principal component analysis (PCA) was performed for the four different grouping systems. The algal abundance was Hellinger-transformed and environmental variables were log-transformed to improve the normality and homoscedasticity for multivariate statistical analyses. The gradient length of the longest axis explored by detrended correspondence analysis (DCA) for algal communities was shorter than 3 SD (standard deviation) units; hence, further analyses were conducted using linear model. Redundancy analysis (RDA) was employed to evaluate the effects of environmental factors on the algal community structure. Based on variance inflation factor analysis, TN, NH4+-N, NO2−-N, NO3−-N, and SRP were used for RDA. The above-mentioned analyses were performed using vegan package for R (Oksanen et al., 2007). To identify the environmental drivers of dominant taxa, the algae were divided into three groups (Watanabeales, Trentepohliales, and others), and correlation analyses were conducted and plotted using Pearson correlation incorporated in the R package ggcor (Huang et al., 2020).
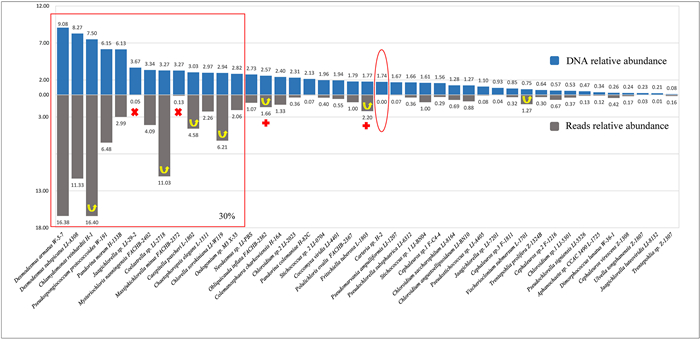
3. Results 3.1. Verification of primers used to determine algal abundanceWe verified the universality of the primers used in this study and their potential for revealing the relative abundance of the algal species in the samples by testing these primers with a simulated environmental DNA sample consisting of 43 algal DNA extracts. The DNA relative abundance in the simulated environmental DNA sample represents each strain's practical abundance in the environmental sample; the relative abundance of reads represents the abundance revealed by single molecule real-time sequencing of the amplification products. The universality of the primers and the degree to which they revealed the relative abundance of algal species in samples were demonstrated by comparison between the relative abundance of reads and DNA relative abundance of the 18S sequences of 43 pure culture strains (Fig. 2). As shown in Fig. 2, the strains were classified from high to low DNA relative abundance (upper, blue) and corresponding relative abundance of reads (under, gray). Among the 43 algal strains, 42 strains were identified from the mixed DNA sample, with only Carteria sp. H-2 (marked with a red circle) not detected. The abundances of seven strains (marked with upward arrows) increased in comparison with their DNA abundances. The abundances of two strains (Jaagichlorella sp. LI-29-2 and Massjukichlorella minus FACHB-2372, marked with red cross) dropped out of the top 30% of OTUs. The abundances of two other strains (Obliquicauda inflate FACHB-2362 and Fritschiella tuberosa L-1803, marked with red plus) increased into the top 30%.
|
| Fig. 2 The comparison of DNA relative abundance (upper, blue) and reads relative abundance (under, gray) of 43 pure cultured strains in CK01. Strains marked by yellow arrows reveal that their reads relative abundance increased relative to their DNA abundance. |
A total of 293, 461 high-quality sequences were obtained, including 54, 290 algal sequences. The rarefaction curves (Fig. S1) showed that the sequencing depth was adequate to acquire the majority of the diversity (Zhao et al., 2017). The resampled OTU table, resampled to the minimum number of sequences (3572) from each sample, contained 171, 456 reads split into 1201 OTUs, including 29, 042 algal reads and 304 algal OTUs. Because only algae were considered in this study, only the algal OTUs were used in subsequent analyses.
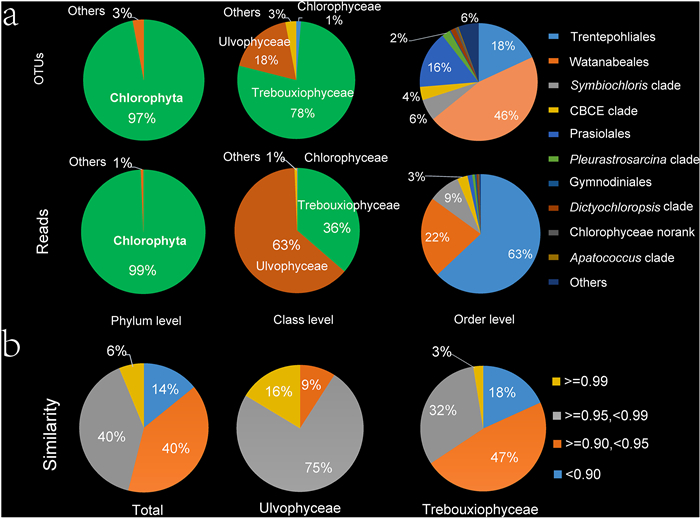
The 304 algal OTUs mainly consisted of Ulvophyceae and Trebouxiophyceae, as well as a small fraction of Chlorophyceae and non-Chlorophyta (Cryptophyceae, Chrysophyceae, Eustigmatophyceae, Coscinodiscophyceae, Dinophyceae, Synurophyceae, Klebsormidiophyceae, and Xanthophyceae). The percentages of OTUs and reads at different taxonomic levels are shown in Fig. 3a. Most OTUs and reads belong to Chlorophyta. Trebouxiophyceae accounted for 78% of OTUs and only 36% of reads, whereas Ulvophyceae accounted for 63% of reads and only 18% of OTUs. The top three orders included Watanabeales (46%), Trentepohliales (18%), and Prasiolales (16%), accounting for 80% of OTUs. Trentepohliales accounted for 63% of the total reads, followed by Watanabeales (22%). The top 10 most abundant genera were Phycopeltis, Trentepohlia, Symbiochloris, Phyllosiphon, Jaagichlorella, Mysteriochloris, Coccomyxa, Chloroidium, Elliptochloris, and Pleurastrosarcina. The community composition of each sample at the genus level is presented in Fig. S2. The similarities between OTU representative sequences and known sequences in the NCBI nucleotide database are shown in Fig. 3b, with 94% of sequences exhibiting similarities < 0.99. Similarities were mainly distributed between 0.90 and 0.99, and the percentage of similarity ≥ 0.99 in Ulvophyceae (16%) was higher than that in Trebouxiophyceae (3%; 0.95–0.99).
|
| Fig. 3 Taxonomic diversity of phyllosphere algae. (a) Percentages of OTUs and reads in phylum, order and genera level. (b) Percentages of the similarity between the OTU representative sequences and the known sequences in the nucleotide NCBI database. |
The samples were grouped into four different categories based on four environmental factors: season, month, forest type, and host tree species. Comparison of biomass (represented by Chla content), species richness, and Pielou evenness (Fig. S3) showed no significant differences among groups classified by season and month, but demonstrated significant differences among groups categorized by forest type and host tree species. Furthermore, PCA of different groups (Fig. S4) showed that groups classified based on seasons and months were not clearly separated, whereas those classified by forest type indicated that primeval rainforest samples were separated from reserve rainforest samples to some extent. In addition, PCA of groups classified based on host tree species showed that Arenga pinnata samples were separated from the other samples. Taken together, these findings indicated that the community compositions in different forest types and host tree species varied. Hence, variations in community composition in different forest types and host tree species were further analyzed in detail.
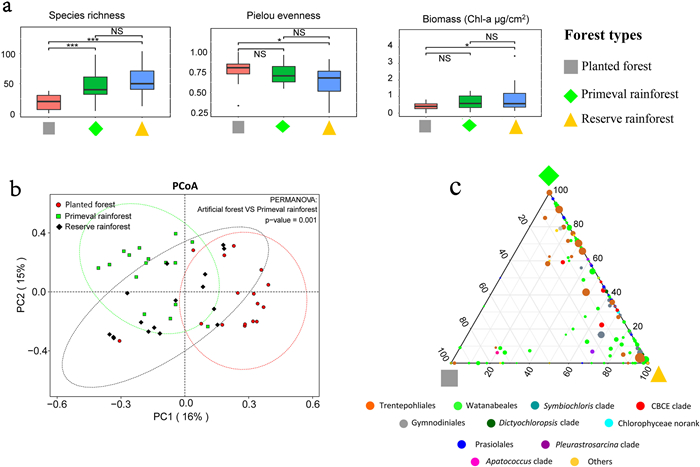
Algal community composition differed among the three forest types (Fig. 4). The biomass of algal communities was significantly greater in reserve rainforest than in planted forest (p = 0.027), whereas the biomass of algal communities was not significantly higher in primeval rainforest than in planted forest (Fig. 4a). Algal species richness was strongly significantly higher in primeval rainforest as well as reserve rainforest than in planted forest (Fig. 4a). In contrast, Pielou evenness was significantly lower in reserve rainforest than in planted forest, whereas Pielou evenness of primeval rainforest and planted forest showed no significant differences (Fig. 4a). PCA results (Fig. 4b) revealed that planted forest samples were significantly separated from primeval rainforest (PERMANOVA p = 0.001), whereas reserve rainforest samples were located between the two groups and partially overlapped them. The ternary plot revealed that most of the OTUs belonged to primeval rainforest, reserve rainforest, or both, whereas fewer OTUs belonged to planted forest (Fig. 4c). The percentage of Trentepohliales in planted forest (39%) was lower than that in the other two groups (70% in primeval rainforest and 60% in reserve rainforest). In contrast, the proportion of Watanabeales was higher in planted forest (38%) than in the other two groups (19% in primeval rainforest and 23% in reserve rainforest). The percentages of Symbiochloris clade members were higher in planted forest (14%) and reserve rainforest (11%) than in primeval rainforest (4%). Maximum exclusive OTUs (71) were found in samples from primeval rainforest, followed by those in samples from reserve rainforest (51) and planted forest (25). Only 53 OTUs belonged to all three groups. With regard to pairwise common OTUs, primeval rainforest and reserve rainforest samples exhibited maximum number of common OTUs (77), followed by reserve rainforest and planted rainforest samples (23), and the lowest number of common OTUs (4) was detected between samples from primeval rainforest and planted forest.
|
| Fig. 4 Community composition differences among three forest types. (a) Comparison of biomass, species richness and Pielou evenness in each forest type. * 0.01 < p < 0.05, ** 0.001 < p < 0.01, ***p < 0.001, NS, non-significant. (b) Principal Coordinates Analysis (PCoA) ordination based on bray-distance of OTU abundance. Dashed lines indicate 95% confidence interval. PERMANOVA analysis was done at the same time. (c) Ternary plot showing the distribution of each OTU in three forest types. Dot size represents abundance. Above analyses were successively performed using the R package: reshape2, ggsignif, vegan, ape, circlize, ggtern and ggplot2. |
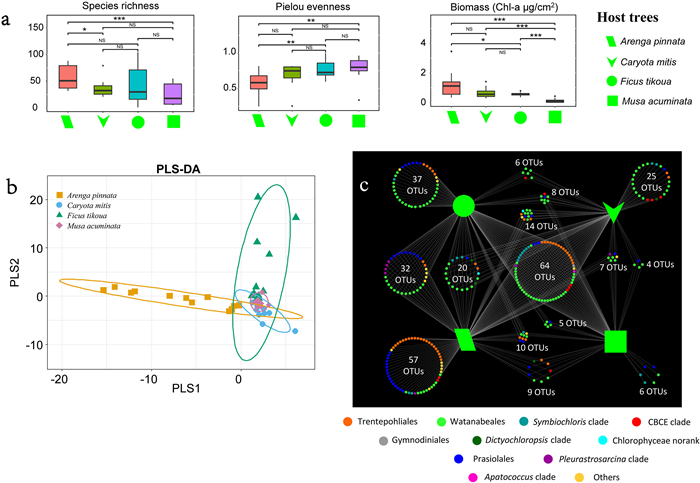
Algal community composition differed among the four host trees (Fig. 5). The algal community growing on Musa acuminata trees had the lowest biomass, whereas that of Arenga pinnata had the highest biomass, although it was not significantly higher than the biomass of communities on Caryota mitis (Fig. 5a). The species richness of algal communities growing on A. pinnata trees was significantly higher than that on C. mitis and M. acuminata, but was not significantly higher than that on Ficus tikoua (Fig. 5a). Furthermore, species richness and Pielou evenness of algal communities on C. mitis, F. tikoua, and M. acuminata exhibited no significant differences (Fig. 5a). Pielou evenness of algal communities of F. tikoua and M. acuminata were significantly higher than that of A. pinnata. The PLS-DA results revealed that the algal community of A. pinnata trees was separated from that of the other three trees, and a part of the F. tikoua algal community clustered together with those of C. mitis and M. acuminata (Fig. 5b).
|
| Fig. 5 Community composition differences among four kinds of host trees. (a) Comparison of biomass, species richness and Pielou evenness in different kinds of host trees. * 0.01 < p < 0.05, ** 0.001 < p < 0.01, ***p < 0.001, NS, non-significant. (b) Partial least squares discrimination analysis (PLS-DA). (c) Association network showing OTU distribution in four kinds of host trees. Performed by R and Cytoscape. Colors denote taxonomic groups at order level. Above analyses were successively performed using the R package: reshape2, ggsignif, mixOmics and ggplot2. |
The percentage of Trentepohliales growing in algal communities on Arenga pinnata (82%) was much higher than that of communities on the other three trees (43%, 30%, and 33% in Caryota mitis, Ficus tikoua, and Musa acuminata groups, respectively). In contrast, the percentage of Watanabeales in algal communities on A. pinnata (6%) was obviously lower than that of communities on the other three trees (44%, 52%, and 31% in C. mitis, F. tikoua, and M. acuminata groups, respectively). Specifically, Trentepohliales and Watanabeales were predominant in the phyllosphere algal communities of C. mitis and F. tikoua (43% and 44% in C. mitis group, respectively; 30% and 52% in F. tikoua group, respectively). In addition, a relatively high percentage of the algal community growing on F. tikoua consisted of the Symbiochloris (14%) and CBCE (15%) clades. The number of OTUs in the algal communities of A. pinnata, F. tikoua, C. mitis, and M. acuminata was 213, 182, 148, and 113, respectively. Fig. 5c illustrates the exclusive OTUs and common OTUs in all four host trees. Algal communities on A. pinnata exhibited the highest number of exclusive OTUs (57), followed by those on F. tikoua (37), C. mitis (25), and M. acuminata (6). A total of 64 common OTUs were detected in all four host trees, and the common OTUs among algal communities of A. pinnata, F. tikoua, and C. mitis were higher than those among M. acuminata and the other three host trees.
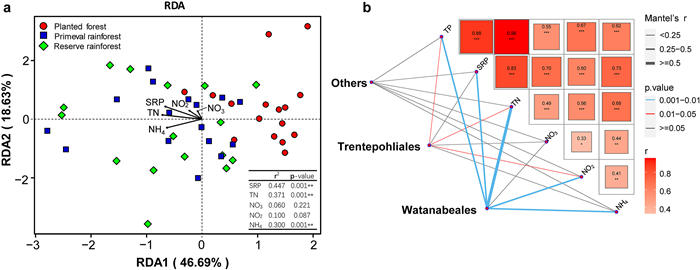
3.4. Environmental factors that affect phyllosphere algaeRDA ordination showed that the environmental factor with the greatest effect on phyllosphere algal communities is soluble reactive phosphorous (r2 = 0.447; p = 0.001), followed by TN (r2 = 0.371; p = 0.001) and NH4+-N (r2 = 0.300; p = 0.001) (Fig. 6a). The first RDA axis was correlated with SRP, TN, and NH4+-N, whereas the second axis revealed no strong correlation with these environmental factors. The correlation of dominant taxa with environmental factors is shown in Fig. 6b. Overall, the environmental factor that was most strongly correlated to Watanabeales was total nitrogen (Mantel's r ≥ 0.5), followed by total phosphorus, soluble reactive phosphorous, NO2−-N, and NH4 (0.25 < Mantel's r < 0.5). NO3−-N showed no significant correlation Watanabeales. Furthermore, no environmental factors were strongly correlated with Trentepohliales and Others. Pairwise comparisons between environmental factors and Trentepohliales and Others revealed that total nitrogen, total phosphorous, and soluble reactive phosphorus had the strongest correlations, whereas NO3−-N, NO2−-N, and NH4+-N were weakly correlated with these algal communities.
|
| Fig. 6 Environmental drivers of algae communities. (a) RDA ordination showing the effect of environmental factors on algae communities. (b) Spearman's correlation coefficients of environmental factors compared in pairs. Different groups were related to each environmental factor by Mantel tests. Edge width corresponds to the Mantel's r statistic for the correlations and edge color denotes the statistical significance. |
In this study, we characterized phyllosphere algae community composition and diversity in four host plants (Ficus tikoua, Caryota mitis, Arenga pinnata, and Musa acuminata) common to three types of forest at the Xishuangbanna Tropical Botanical Garden, Yunnan Province, China and identified environmental factors underlying the diversity in these communities. We found that the predominant phyllosphere algal groups were the green algae orders Watanabeales and Trentepohliales. In addition, algal community structures were significantly related to forest types and host tree species. Specifically, phyllosphere species richness and biomass of planted forest were lower than those of primeval and reserve rainforest, and the community composition of planted forest and primeval rainforest differed significantly. We also found that phyllosphere algal communities were affected by soluble reactive phosphorous, total nitrogen, and ammonium contents.
4.1. Abundance and diversity of phyllosphere algal communitiesAlgal diversity has rarely been studied with high-throughput sequencing of full-length 18S rDNA. Thus, we established the following standards for our use of 18S rDNA to measure phyllosphere algal diversity and abundance. We used sequences between 1500 and 4000 bp, split these sequences into operational taxonomic units (OTUs) at a 99% similarity level after removing chimeric sequences, and reoriented all reads in the 5′–3′ direction to avoid affecting the results of OTU clustering. To test the universality of the primers for our algal abundance analysis, we evaluated whether the primers would determine abundance of an simulated environmental mixture that contained 43 pure algal DNA extracts, including those belonging to Trebouxiophyceae, Ulvophyceae, and Chlorophyceae. Of 43 algal strains, only one strain, which had low DNA content, was undetected. In several algal strains, the relative abundance of reads increased in relation to their DNA relative abundance, whereas two strains dropped out of the top 30% of OTUs. These discrepancies may be due to differences in the copy numbers of these strains, impure strain samples, and/or the bacterial contamination of the DNA mixture. These findings indicated that the primers could be used to determine the relative abundance of algal species.
It had been demonstrated that subaerial habitats of tropical rainforests represent one of the least-known algal habitats worldwide (Williams et al., 2003; Burnham and Johnson, 2004; Neustupa, 2005; Rindi et al., 2006). Neustupa and Škaloud (2008) estimated that the proportion of undescribed and new taxa of green microalgae unidentifiable according to the traditional criteria was about 60%. The actual proportion of new algal species might be even higher given the high proportion of cryptic species among these groups (Krienitz et al., 2004; Neustupa, 2007 and herein).
Environmental 18S rDNA sequences also indicated that 94% of the total phyllosphere microalgal community consisted of OTUs with > 1% difference from known species. These OTUs, which accounted for 94% of the total phyllosphere microalgal community, might represent new taxa. Moreover, more than one new species of phyllosphere algae isolated from the same rainforests have been described in recent studies (Li et al., 2020a, 2020b, 2021). These findings reveal a high cryptic diversity of phyllosphere microalgae, and also indicate that gaps in the taxonomy and diversity of aerial algae are even more substantial for microalgae from tropical rainforests. Rainforests may provide abundant materials for algal studies and their importance cannot be overemphasized.
4.2. Environmental factors that drive phyllosphere algal diversity and community structureOur finding that species richness and biomass of phyllosphere algal communities were lower in the planted forest than in reserve forest and primeval rainforest may be explained by environmental differences between these forests at Xishuangbanna Tropical Botanical Garden. Planted forest is almost a single-layer and one-species forest, with leaves nearly completely exposed to the sun and excessive ultraviolet radiation, thus preventing moisture retention on the leaves. In contrast, primeval and reserve rainforests are natural, mixed, multi-layer forests, which are less exposed to direct sunlight and ultraviolet radiation, and hence, can retain more moisture on the leaves. Our finding that species richness and biomass of algal communities were lower on Musa acuminata than on Arenga pinnata, Ficus tikoua, and Caryota mitis may be due to the surface structure of the leaves. It must be noted that M. acuminata leaves are broad and smooth, which may not be suitable for moisture retention and algal fixation.
We also identified several additional environmental factors that influence phyllosphere algal communities, including soluble reactive phosphorous, total nitrogen, and ammonium contents. The RDA plot also implied that there might be other important factors that strongly influence phyllosphere algal community composition. The correlation of dominant taxa with environmental factors suggests that members of Watanabeales are more dependent on nitrogen and phosphorous nutrients than those of Trentepohliales, which could be due to the relatively complex filamentous or discoid plant body of Trentepohliales, helping in its survival for short periods of adverse conditions.
5. ConclusionsIn conclusion, this study characterizes algal diversity and community structure of four host plants (Ficus tikoua, Caryota mitis, Arenga pinnata, and Musa acuminata) common to three types of forest at the Xishuangbanna Tropical Botanical Garden, Yunnan Province, China. Our finding that the predominant phyllosphere algal groups are the green algae orders Watanabeales and Trentepohliales increases our understanding of diversity and distribution of phyllosphere algal communities and provides a foundation for future taxonomic research. The identification of several factors that drive phyllosphere algal diversity (e.g., host tree, soluble reactive phosphorous) may provide guidance for conservation efforts. Specifically, our finding that 94% of the phyllosphere algal community may represent new taxa emphasizes the importance of protecting tropical rainforest and the possibility that many algae are in danger extinction before discovery. In addition, the findings of this study have important reference value for molecular diversity analysis of algae in other specific habitats, such as epiphytic and soil algae.
AcknowledgementsThis work was supported by the National Natural Science Foundation of China (Grant no. 31870189 and 32000168). The authors are grateful to Xishuangbanna Station for Tropical Rain Forest Ecosystem Studies (XSTRE) for providing climate data. The authors are also grateful for Qijia Cai, Jijian Long and Yuanzhao Xu's help during the determination of N and P nutrients.
Author contributions
L.B.W. and L.G.X. planned and designed the research; L.B.W. and L.S.Y. performed experiments, conducted fieldwork, collected the data; L.B.W. and Z.H. analyzed data; L.B.W. and L.G.X. wrote the manuscript.
Declaration of competing interest
This article does not involve conflicts of interest.
Appendix A. Supplementary data
Supplementary data to this article can be found online at https://doi.org/10.1016/j.pld.2022.08.006.
APHA, 2012. Standard Methods for the Examination of Water and Wastewater, 22nd ed. American Public Health Association (APHA), Washington, DC, USA.
|
Burnham, R.J., Johnson, K.R., 2004. South American palaeobotany and the origins of neotropical rainforests. Philos. Trans. R. Soc. B, 359: 1595-1610. DOI:10.1098/rstb.2004.1531 |
Caporaso, J.G., Kuczynski, J., Stombaugh, J., et al., 2010. QIIME allows analysis of high-throughput community sequencing data. Nat. Methods, 7: 335-336. DOI:10.1038/nmeth.f.303 |
Copeland, J.K., Yuan, L., Layeghifard, M., et al., 2015. Seasonal community succession of the phyllosphere microbiome. Mol. Plant-Microbe Int., 28: 274-285. DOI:10.1094/MPMI-10-14-0331-FI |
Edgar, R.C., Haas, B.J., Clemente, J.C., et al., 2011. UCHIME improves sensitivity and speed of chimera detection. Bioinformatics, 27: 2194-2200. DOI:10.1093/bioinformatics/btr381 |
Gong, J., Dong, J., Liu, X., et al., 2013. Extremely high copy numbers and polymorphisms of the rDNA operon estimated from single cell analysis of Oligotrich and Peritrich Ciliates. Protist, 164: 369-379. DOI:10.1016/j.protis.2012.11.006 |
Huang, H., Zhou, L., Chen, J., et al., 2020. ggcor: extended tools for correlation analysis and visualization. R package 7 version 0.9.
|
Knief, C., Frances, L., Vorholt, J.A., 2010. Competitiveness of diverse Methylobacterium strains in the phyllosphere of Arabidopsis thaliana and identification of representative models, including M. Extorquens PA1. Microb. Ecol., 60: 440-452. DOI:10.1007/s00248-010-9725-3 |
Kohl, M., Wiese, S., Warscheid, B., 2011. Cytoscape: software for visualization and analysis of biological networks. Methods Mol. Biol., 696: 291-303. DOI:10.1007/978-1-60761-987-1_18 |
Krienitz, L., Hegewald, E.H., Hepperle, D., et al., 2004. Phylogenetic relationship of Chlorella and Parachlorella gen. nov. (Chlorophyta, Trebouxiophyceae). Phycologia, 43: 529-542. DOI:10.2216/i0031-8884-43-5-529.1 |
Laforest-Lapointe, I., Messier, C., Kembel, S.W., 2017. Tree leaf bacterial community structure and diversity differ along a gradient of urban intensity. mSystems, 2: e00087-17. |
Li, S., Zhu, H., Hu, Y., et al., 2020. Obliquicauda gen. nov. (Trebouxiophyceae, Chlorophyta), including O. inflata sp. nov. and O. apiculata sp. nov.: foliicolous algae from Ficus leaves. Phycologia, 59: 35-44. DOI:10.1080/00318884.2019.1667168 |
Li, S., Sun, H., Hu, Y., et al., 2020. Four new members of foliicolous green algae within the Watanabea clade (Trebouxiophyceae, Chlorophyta) from China. J. Eukaryot. Microbiol., 67: 369-382. DOI:10.1111/jeu.12787 |
Li, S., Tan, H., Liu, B., et al., 2021. Watanabeales ord. nov. and twelve novel species of Trebouxiophyceae (Chlorophyta). J. Phycol., 57: 1167-1186. DOI:10.1111/jpy.13165 |
Lindow, S.E., Brandl, M.T., 2003. Microbiology of the phyllosphere. Appl. Environ. Microbiol., 69: 1875-1883. DOI:10.1128/AEM.69.4.1875-1883.2003 |
Liu, X., Zhu, H., Song, H., et al., 2018. Quadricoccopsis gen. nov., a new genus of Quadricoccus-like algae in Oocystaceae from China (Trebouxiophyceae, Chlorophyta). Fottea, 18: 189-199. DOI:10.5507/fot.2018.005 |
Liu, X., Zhu, H., Song, H., et al., 2018. Euchlorocystis gen. nov and Densicystis gen. nov., two new genera of Oocystaceae algae from high-altitude semi-saline habitat (Trebouxiophyceae, Chlorophyta). J. Eukaryot. Microbiol., 65: 200-210. DOI:10.1111/jeu.12455 |
Lopez-Bautista, J., Rindi, F., Casamatta, D., 2007. The systematics of subaerial algae. In: Seckbach, J. (Eds.), Algae and Cyanobacteria in Extreme Environments. The Hebrew University of Jerusalem Press, Jerusalem, Israel, pp. 599-617.
|
Martin, M., 2011. Cutadapt removes adapter sequences from high-throughput sequencing reads. Embnet. J., 17: 10-12. DOI:10.14806/ej.17.1.200 |
Medlin, L., Elwood, H.J., Stickel, S., et al., 1988. The characterization of enzymatically amplified eukaryotic 16S-Wke rRNA-coding regions. Gene, 71: 491-499. DOI:10.1016/0378-1119(88)90066-2 |
Morella, N.M., Gomez, A.L., Wang, G., et al., 2018. The impact of bacteriophages on phyllosphere bacterial abundance and composition. Mol. Ecol., 27: 2025-2038. DOI:10.1111/mec.14542 |
Němcová, Y., Eliáš, M., Škaloud, P., et al., 2011. Jenufa gen. Nov.: a new genus of coccoid green algae (Chlorophyceae, incertae sedis) previously recorded by environmental sequencing. J. Phycol., 47: 928-938. DOI:10.1111/j.1529-8817.2011.01009.x |
Neustupa, J., 2003. The genus Phycopeltis (Trentepohliales, Chlorophyta) from tropical southeast Asia. Nova Hedwigia, 76: 487-506. DOI:10.1127/0029-5035/2003/0076-0487 |
Neustupa, J., 2005. Investigations on the genus Phycopeltis (Trentepohliaceae, Chlorophyta) from South-East Asia, including the description of two new species. Cryptogam. Algol., 26: 229-242. |
Neustupa, J., Elias, M., Sejnohova, L., 2007. A taxonomic study of two Stichococcus species (Trebouxiophyceae, Chlorophyta) with a starch-enveloped pyrenoid. Nova Hedwigia, 84: 51-63. DOI:10.1127/0029-5035/2007/0084-0051 |
Neustupa, J., Škaloud, P., 2008. Diversity of subaerial algae and cyanobacteria on tree bark in tropical mountain habitats. Biologia, 63: 806-812. DOI:10.2478/s11756-008-0102-3 |
Neustupa, J., Škaloud, P., 2010. Diversity of subaerial algae and cyanobacteria growing on bark and wood in the lowland tropical forests of Singapore. Plant Ecol. Evol., 143: 51-62. DOI:10.5091/plecevo.2010.417 |
Neustupa, J., Eliáš, M., Škaloud, P., et al., 2011. Xylochloris irregularis gen. et sp. nov. (Trebouxiophyceae, Chlorophyta), a novel subaerial coccoid green alga. Phycologia, 50: 57-66. DOI:10.2216/08-64.1 |
Oksanen, J., Kindt, R., Legendre, P., et al., 2007. The vegan package. Community Ecol., 10: 631-637. |
Pielou, E.C., 1966. The measurement of diversity in different types of biological collections. J. Theor. Biol., 13: 131-144. DOI:10.1016/0022-5193(66)90013-0 |
Richards, F.A., Thompson, T.G., 1952. The estimation and characterization of plankton populations by pigment analyses. J. Mar. Res., 11: 156-172. |
Rindi, F., Lopez-Bautista, J.M., Sherwood, A.R., et al., 2006. Morphology and phylogenetic position of Spongiochrysis hawaiiensis gen. et sp. nov., the first known terrestrial member of the order Cladophorales (Ulvophyceae, Chlorophyta). Int. J. Syst. Evol. Microbiol., 56: 913-922. DOI:10.1099/ijs.0.63977-0 |
Salmaso, N., Boscaini, A., Pindo, M., 2020. Unraveling the diversity of eukaryotic microplankton in a large and deep perialpine lake using a high throughput sequencing approach. Front. Microbiol., 11: 789. DOI:10.3389/fmicb.2020.00789 |
Suto, Y., Ohtani, S., 2009. Morphology and taxonomy of five Cephaleuros species (Trentepohliaceae, Chlorophyta) from Japan, including three new species. Phycologia, 48: 213-236. DOI:10.2216/07-31.1 |
Turner, T.R., James, E.K., Poole, P.S., 2013. The plant microbiome. Genome Biol., 14: 209. DOI:10.1186/gb-2013-14-6-209 |
Vorholt, J.A., 2012. Microbial life in the phyllosphere. Nat. Rev. Microbiol., 10: 828-840. DOI:10.1038/nrmicro2910 |
Wang, J., Liu, Q., Zhao, X., et al., 2019. Molecular biogeography of planktonic and benthic diatoms in the Yangtze River. Microbiome, 7: 153. DOI:10.1186/s40168-019-0771-x |
Williams, S.E., Bolitho, E.E., Fox, S., 2003. Climate change in Australian tropical rainforests: an impending environmental catastrophe. Proc. R. Soc. B-Biol. Sci., 270: 1887-1892. DOI:10.1098/rspb.2003.2464 |
Xia, P., Yan, D., Sun, R., et al., 2020. Community composition and correlations between bacteria and algae within epiphytic biofilms on submerged macrophytes in a plateau lake, southwest China. Sci. Total Environ., 727: 138398. DOI:10.1016/j.scitotenv.2020.138398 |
Yu, Z., Yang, J., Liu, L., et al., 2015. Bacterioplankton community shifts associated with epipelagic and mesopelagic waters in the Southern Ocean. Sci. Rep., 5: 12897. DOI:10.1038/srep12897 |
Zhao, H., Chu, M., Huang, Z., et al., 2017. Variations in oral microbiota associated with oral cancer. Sci. Rep., 7: 11773. DOI:10.1038/s41598-017-11779-9 |
Zhu, H., Li, S., Hu, Z., et al., 2018. Molecular characterization of eukaryotic algal communities in the tropical phyllosphere based on real-time sequencing of the 18S rDNA gene. BMC Plant Biol., 18: 365. DOI:10.1186/s12870-018-1588-7 |


