b. CAS Center for Excellence in Molecular Plant Sciences, Shanghai Institute of Plant Physiology and Ecology, Chinese Academy of Sciences, 300 Fenglin Road, Shanghai, 200032, China;
c. Shanghai Chenshan Plant Science Research Center, Chinese Academy of Sciences, 3888 Chenhua Road Songjiang, Shanghai, 201602, China;
d. University of Chinese Academy of Sciences, Beijing, 100049, China;
e. College of Life and Sciences, Shanghai Normal University, Shanghai, 201602, China;
f. Life Science and Technology College, Harbin Normal University, Harbin, Heilongjiang 150025, China;
g. Drug and Cosmetics Excellence Center, School of Pharmacy, Walailak University, Nakhon Si Thammarat, 80160, Thailand
Whole-genome duplication (WGD) is a ubiquitous feature of vascular plant genomes (Leitch and Leitch, 2013; Panchy et al., 2016; Soltis and Soltis, 2016). Although the occurrence of WGDs has varied dramatically throughout major clades of green plants (Viridiplantae), it has occurred most frequently in ferns and angiosperms (Gao et al., 2020; Huang et al., 2020; Zhang et al., 2020a). In several lineages, major WGDs have occurred during the same period, such as the Cretaceous-Paleogene boundary (Vanneste et al., 2014; Zhang et al., 2020b), possibly because WGDs lead to new functionalization, sub-functionalization and de-functionalization of duplicated genes, which allow plants to adapt to various biotic and abiotic stresses inherent to extreme climates (Panchy et al., 2016; Sattler et al., 2016).
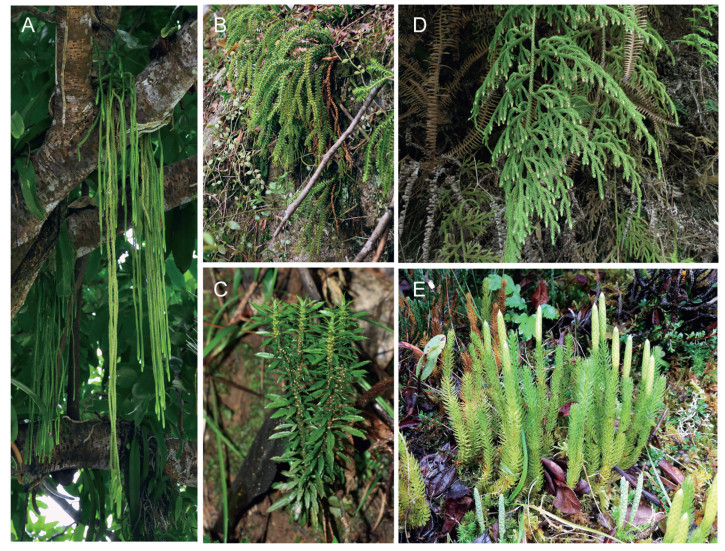
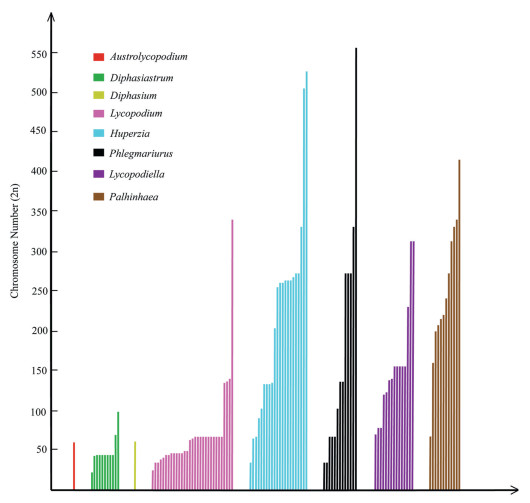
Lycopodiaceae, a family about 338 species comprising three subfamilies and 16 genera, has a worldwide distribution especially in tropical regions (Schuettpelz et al., 2016). The highest diversity of lycophytes is found in Lycopodiaceae (Schuettpelz et al., 2016; Testo et al., 2018), whose members grow in highly diverse ecological habits (Fig. 1) and have a diverse range of chromosome numbers (Fig. 2). Understanding the evolutionary history of Lycopodiaceae may provide insight into the patterns of early plant diversification. The evolution of one model lycophyte, Selaginella moellendorffii Hieron, has reportedly been driven by two WGD events (Wang et al., 2020). However, the lack of lycophyte genome sequences has hindered our understanding of the genetic events that underlie lycophyte evolution in other taxa. Although major research projects such as the One Thousand Plant Transcriptomes Initiative (1KP) have provided insight into WGDs of many plant groups including lychophytes (Leebens-Mack et al., 2019), detailed surveys have yet to report results for the occurrence of WGDs in Phlegmariurus (Herter) Holub Preslia, the largest genus of lycophytes. The absence of WGDs in certain lycophyte taxa would represent a curious paradox, especially in the genus Phlegmariurus with high chromosome numbers.
|
| Fig. 1 Ecological habits and morphological diversity of family Lycopodiaceae. (A) Epiphytic Phlegmariurus carinatus, which has cordlike stems and leaves, grows on tree trunks; (B) Epiphytic Phlegmariurus phlegmaria grows on rocks, here showing caespitose stems and pendulous trophophylls that spread obliquely; (C) Terrestrial Huperzia javanica grows under the forest with erect stems and homomorphic sporophylls with trophophylls; (D) Palhinhaea hainanensis grows under shrubs with erect stems and solitary strobili at the terminal of branches; (E) Terrestrial Lycopodium zonatum grows in the alpine grassland, here showing sparse leaves, cylindrical stems and solitary strobili at the terminal of the stems. |
|
| Fig. 2 Chromosomenumber variations in Lycopodiaceae. A histogram of chromosome number distribution. Colors represent different genera in Lycopodiaceae. Each bar represents an individual species. Although we have compiled all relevant data on Lycopodiaceae from the CCDB database, most genera still lack cytological information, including ploidy, chromosome number, gametophytic (n) or sporophytic (2n). The genera Austrolycopodium and Diphasium only have one record. |
Molecular biology and genomics have provided new methods to estimate WGDs. For species without sequenced genomes, the distributions of synonymous substitutions per synonymous sites (Ks) among paralogs of transcriptome sequence data has been commonly used to detect WGDs. For example, Ks analysis has been used to detect WGDs that occurred throughout the evolutionary history of ferns and angiosperms (Zhang et al., 2017; Li et al., 2018; Cai et al., 2019). However, Ks analyses sometimes overfit the number of WGDs. Furthermore, small-scale duplications (SSDs) can overshadow WGD events (Tiley et al., 2018), resulting in no WGD event peaks but only an L-shaped pattern in Ks-based age distributions (Lynch and Conery, 2000, Lynch and Conery, 2003).
Hence, in this study we integrated two phylogenomic pipelines, PUG and Tree2GD (McKain et al., 2016; Huang et al., 2020), with Ks plot analysis of the transcriptomes of 13 species to investigate WGDs in Lycopodiaceae. Additionally, we used mapping analysis to assess the phylogenetic conflict and concordance. We obtained strong evidence for two WGDs in Lycopodiaceae and argued that the WGD might have contributed to the diversification of Phlegmariurus.
2. Materials and methods 2.1. Transcriptome data collection and BUSCO analysisPlant tissue was collected from 12 species of Lycopodiaceae and one Isoetes sp., which served as an outgroup (Table 1). All sampled species were collected with the permission of nature reserves and the Shanghai Chenshan Botanical Garden in China. Illumina library preparation and RNA-sequencing were performed on the Majorbio next-generation sequencing (NGS) platform (Shanghai, China). Reads were cleaned using Trimmomatic (v.0.36) (Bolger et al., 2014), and assembled de novo using Trinity (v.2.4.0) (Haas et al., 2013). Protein sequences and coding sequences (CDS) of transcripts were predicted by TransDecoder (v.5.50) (https://github.com/TransDecoder/) with default parameters. Redundantly assembled sequences were removed by cd-hit (v.4.6.2) (Li and Godzik, 2006) with 99% identity.
| Species | Clean Size (G) | GC (%) | N50 (bp) | BUSCO Notation Assessment Results |
| Phlegmariurus nummulariifolia | 8.22 | 44.98 | 1344 | C: 93.4% [S: 66.7%, D: 26.7%], F: 2.6%, M: 4.0%, n: 430 |
| Phlegmariurus salviniodes | 11.2 | 49.97 | 1116 | C: 92.4% [S: 57.7%, D: 34.7%], F: 4.2%, M: 3.4%, n: 430 |
| Phlegmariurus carinatus | 9.48 | 44.51 | 1332 | C: 92.1% [S: 59.8%, D: 32.3%], F: 3.5%, M: 4.4%, n: 430 |
| Phlegmariurus sp. | 11.6 | 45.41 | 1323 | C: 92.0% [S: 66.0%, D: 26.0%], F: 3.3%, M: 4.7%, n: 430 |
| Phlegmariurus phlegmaria | 9.86 | 44.37 | 1431 | C: 96.5% [S: 65.1%, D: 31.4%], F: 0.7%, M: 2.8%, n: 430 |
| Phlegmariurus goebelii | 9.82 | 44.27 | 1467 | C: 94.9% [S: 67.9%, D: 27.0%], F: 2.8%, M: 2.3%, n: 430 |
| Phlegmariurus squarrosus | 14 | 44.31 | 1296 | C: 95.8% [S: 48.8%, D: 47.0%], F: 2.3%, M: 1.9%, n: 430 |
| Huperzia javanica | 6.35 | 45.28 | 1143 | C: 90.4% [S: 63.0%, D: 27.4%], F: 5.6%, M: 4.0%, n: 430 |
| Lycopodium japonicum | 4.57 | 45.64 | 1332 | C: 92.8% [S: 71.6%, D: 21.2%], F: 5.3%, M: 1.9%, n: 430 |
| Lycopodium zonatum | 8.88 | 44.67 | 1353 | C: 92.3% [S: 62.1%, D: 30.2%], F: 3.0%, M: 4.7%, n: 430 |
| Lycopodium complanatum | 9.55 | 44.63 | 1395 | C: 93.7% [S: 67.4%, D: 26.3%], F: 4.2%, M: 2.1%, n: 430 |
| Palhinhaea hainanensis | 14.1 | 46.52 | 1134 | C: 89.8% [S: 37.9%, D: 51.9%], F: 4.7%, M: 5.5%, n: 430 |
| Isoetes sp. | 4.59 | 43.65 | 1086 | C: 84.7% [S: 59.8%, D: 24.9%], F: 10.7%, M: 4.6%, n: 430 |
| BUSCO was used to assess transcriptome data quality, with 430 cores conserved orthologs of plant species (viridiplantae_odb10 database of BUSCO) as reference. Legend: Complete BUSCOs (C), Complete and Single-Copy BUSCOs (S), Complete and Duplicated BUSCOs (D), Fragmented BUSCOs (F), Missing BUSCOs (M), Total BUSCO groups searched (N). | ||||
The completeness of our transcriptome assembly was assessed by estimating the coverage of the gene space based on blast searches against the core plant homologous gene database (www.orthodb.org).
2.2. Orthologous group inferenceTo cluster transcripts into orthologous genes, the OrthoFinder (v.2.2.6) (Emms and Kelly, 2015) software was used to infer core-orthogroups based on all-against-all BLASTP (v.2.9.0+) (Camacho et al., 2009) searches with an E-value cutoff of 10−5 against 13 lycophytes species (Phlegmariurus nummulariifolia (Blume) Ching, Phlegmariurus salviniodes (Herter) Ching, Phlegmariurus carinatus (Desv. ex Poir.) Ching, Phlegmariurus sp., Phlegmariurus phlegmaria (L.) Holub, Phlegmariurus goebelii (Nessel) A.R. Field et Bostock, Phlegmariurus squarrosus (Forst.) L. Love et D. Love, Huperzia javanica (Sw.) Fraser-Jenk, Lycopodium japonicum Thunb. ex Murray, Lycopodium complanatum L., Lycopodium zonatum Ching, Palhinhaea hainanensis C.Y. Yang, Isoetes sp.). To further increase the robustness of phylogenetic analyses, OGs were required to have at least one sequence from each of the 13 transcriptomes. Thus, 7237 OGs were retained and 78 single-copy OGs were selected (Table S1).
2.3. Species tree reconstruction and divergence time datingSequences were aligned with MAFFT (v.7.471) (Katoh et al., 2002) and the best substitution model was determined using ProtTest (v.3.4) (Darriba et al., 2011). We constructed a phylogenetic tree based on a concatenated amino acid sequence alignment of 78 single-copy gene families from the 13 plant species using RAxML (v.8.2.12) (Stamatakis, 2014) software under the PROTCATJTT evolutionary model and 1000 bootstrap replicates with Isoetes sp. as the outgroup (Fig. S1). The resulting maximum likelihood (ML) best tree was retained for use in subsequent analyses.
For the phylogenomic dating, divergence times within the species tree were estimated by MCMCTREE in the PAML package (Yang, 2007). As no reliable fossils are available to calibrate the internal nodes of the Lycopodiaceae, two secondary calibrations from a recently published dated phylogeny of the Lycopodiaceae (Testo et al., 2018) were used to calibrate the crown age of Paleotropical Phlegmariurus to be no older than 66.8 million years ago (Mya) and the divergence time of Lycopodiaceae from Isoetes sp. to be no older than 403 Mya. The JC69 model was used to specify the rate priors for internal nodes. The Markov chain Monte Carlo (MCMC) process run with two replicates for 1, 200, 000 iterations with a sample frequency of 120, and the two independent runs were performed to check convergence.
2.4. General Ks analysisKs analysis is commonly used to detect WGDs in genome and transcriptome data sets. The paranome was built by performing an all-against-all BLASTP (v.2.9.0+) search of all protein coding sequences with an E-value cutoff of 1e-10−10. Then, a faster and more convenient pipeline based on MUSCLE (v.3.8.31) (Edgar, 2004) and codeml of PAML (v.4.8) was used to calculate maximum likelihood estimates of the Ks scores. The employed script of the pipeline is available online (https://github.com/EndymionCooper/KSPlotting/blob/38212ab1521e3b091c3ef9d9c24200bf663a21a7/kSPlotter.py). After Ks calculation, we determined Ks distributions for the transcriptome of each species.
All Ks values ≤ 0.1 and ≥5 were excluded from analysis to avoid the incorporation of recent duplications and old substitution saturation. The features of peaks in Ks plot most likely to correspond to a WGD during the evolutionary past, and the distribution of Ks contains WGD Gaussian functions (Vanneste et al., 2015). We therefore performed Gaussian mixture model in R (v.4.0.0) for fitting components that are WGD signature peaks. Fitted components corresponding to WGD features are selected and highlighted in red (Table S3). The Bayesian Information Criterion was used to select the best number of components.
2.5. Placement of WGD eventsTo further obtain a reliable estimate for potential WGD events, two approaches were used to test the phylogenetic placement of WGD events in Lycopodiaceae: the Polyploidy Using the Genomes (PUG) algorithm (McKain et al., 2016) and Tree2GD software (https://github.com/Dee-chen/Tree2gd).
For PUG, the 7237 rooted gene trees were employed for the identification of ancestral gene duplications using the species tree generated from the concatenated sequence super-matrix as a guide based on gene tree–species tree reconciliation. The commands and parameters used for running PUG were as follows: "perl PUG.pl -trees genetree_directory -outgroups sample_Isoetes -species species_tree". The results were visualized using Rscript provided by McKain et al. (2016).
The Tree2GD analysis software provides an integrated pipeline to identify WGD events. In summary, the software executes all-against-all BLASTP (v.2.9.0+) searches, and hierarchically clusters orthogroups using PhyloMCL (Zhou et al., 2020). The evolution of gene family size is estimated using Dollo Parsimony, which is nested within Tree2GD. Finally, accurate gene family clustering is used to detect WGDs. The Ks scores were calculated by codeml in PAML using a maximum likelihood method based on hierarchical orthogroups, and all the results were visualized using ggtree (Yu et al., 2017) package in R. Two factors were considered when identifying WGDs: the percentage of gene duplication for the most recent common ancestor (MRCA) nodes and percentage of gene duplication with all branches retained. In total, all WGD analyses can be accomplished with one friendly command: "Tree2gd -i pep_directory -tree species_tree".
2.6. Identifying and mapping conflict and concordanceConflict between gene trees and the species tree was assessed using PhyParts (v.0.0.1) (Smith et al., 2015). All 7237 gene trees and the species tree were rooted using TET3 in Python (v.3.8.3). The gene trees, which may include gene duplication and incomplete taxa, were mapped to the species tree based on a phylogenomic comparison, employing scripts from online (https://bitbucket.org/blackrim/phyparts/src/master/). To visualize the results of conflict or concordance between gene trees and the species tree, we used the scripts developed by Matt Johnson (https://github.com/mossmatters/phyloscripts/tree/master/phypartspiecharts). The running commands were as follows: "python phypartspiecharts.py species_tree phyparts_output 7237". "phyparts_output" is the suffix of the Phyparts output. The number "7237" indicates the number of gene trees used in Phyparts, which was used to properly calculate the pie chart percentages.
3. Results 3.1. Assessment of the transcriptome assemblyTranscriptome assembly for the 13 species resulted in clean data ranging from 4.45Gb to 11.4Gb, and an average GC content between 43.65%–49.97% for each sample, with a contig N50 between 1086–1467 bases (Table 1). The completeness of our transcriptome assembly was assessed by estimating the coverage of the gene space based on a core plant gene mapping approach that assesses how many genes out of a set of 430 genes shared by all plant species are present in our assembly. Our transcriptomes contained 84.7%–95.8% of conserved complete genes and ~71.6% of complete single-copy genes. Only between 1.9%–4.7% of single-copy genes were classified as missing, indicating fine coverage and high quality of the assembly of the protein-coding transcriptomes for these species.
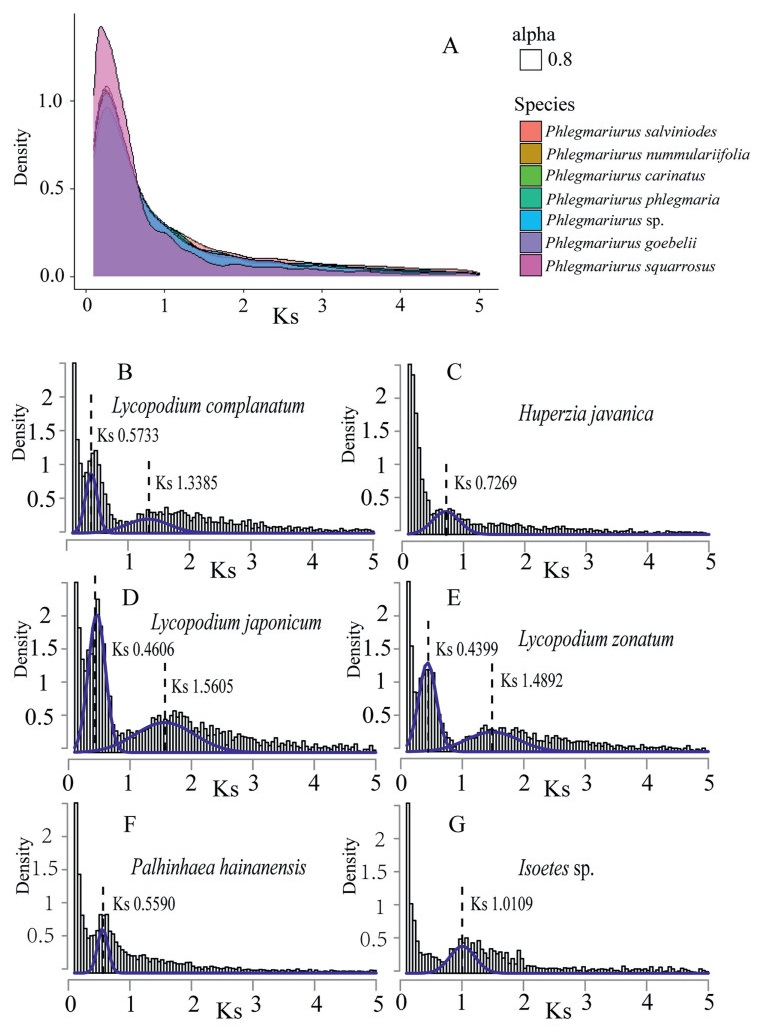
3.2. General Ks analysis fails to consistently identify recent WGD events in LycopodiaceaeSynonymous substitutions do not change the amino acid and are therefore considered to be have putatively neutral, so that they accumulate at a nearly constant rate. Hence, they serve as a proxy for the time since duplication of paralogous genes. For general Ks frequency plots (Fig. 3), detection of WGD events using paranome-based Ks distribution is difficult. We observed that paralogous genes in the seven Phlegmariurus species are approximately distributed in an L-shaped pattern (Fig. 3A), which indicates that most extant small-scale duplicated genes are of fairly recent origin and few paralogs have been retained from old duplication events. For the remaining six species (Lycopodium complanatum, L. japonicum, L. zonatum, Huperzia javanica, Palhinhaea hainanens and Isoetes sp.), we used mixture modeling to separate the contributions of recent duplications from the residual signals of large-scale gene duplication events that represent WGD signature peaks (Fig. 3B–G). The Lycopodium spp. had two peaks: one around a Ks of 0.5 and the other near a Ks of 1.5 (Table S3). H. javanica had a peak at a Ks of 0.72. P. hainanensis showed a peak at a Ks of 0.56 and the Isoetes sp. showed a peak at a Ks of 1. The density level and position of the fitted components varied among species. This variation suggests that general Ks analysis has substantial limitations in showing recent large-scale duplication events shared by several species.
|
| Fig. 3 Ks-based age distributions for thirteen lycophytes species. The full Ks-based age distribution of thirteen lycophyte species. The X axes show Ks value (synonymous distance) until a value cutoff of 5, and the Y axes display the density of retained duplicated paralogous gene pairs. (A): Ks plot of seven species in Phlegmariurus. The alpha 0.8 is the transparency of the layer defined by ggplot2. (B)–(G): Ks age distributions for Lycopodium complanatum, Huperzia javanica, Lycopodium japonicum, Lycopodium zonatum, Palhinhaea hainanensis, Isoetes sp. The gray columns represent the distributions of the paralogous genes that were used for Gaussian mixture modeling. The fitted components that correspond to a significant WGD feature were plotted on the age distribution in blue. |
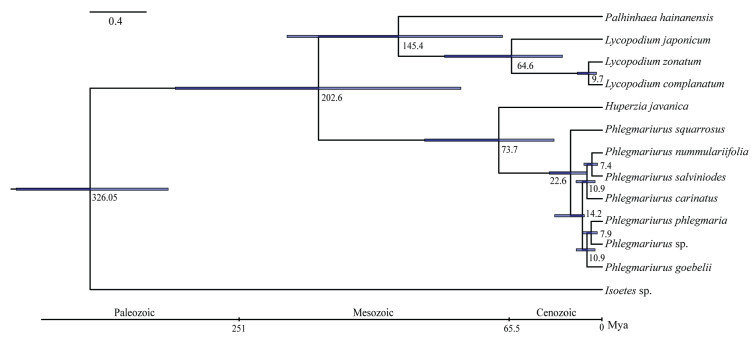
We constructed a phylogenetic tree (all of the nodes received maximum likelihood bootstrap ≥80%) and estimated the divergence times of 13 plant species using genes extracted from 78 single-copy families (Figs. 4 and S1). This phylogeny covers all three subfamilies (Lycopodielloideae, Lycopodioideae and Huperzioideae) of Lycopodiaceae with a robust phylogenetic topology. Seven species in Phlegmariurus formed a clade that is sister to H. javanica (genus Huperzia). Lycopodium japonicum, L. zonatum, L. complanatum formed the other clade within the Lycopodioideae that is sister to P. hainanensis (genus Palhinhaea). To obtain the evolutionary timescale of this clade, we used the tree constructed from the 78-gene concatenations for 13 species (12 Lycopodiaceae taxa and one outgroup) as the input to estimate divergence times using a Bayesian method (Fig. 4). The divergence of Lycopodiaceae from Isoetes sp. dates to ~326 Mya with a 95% confidence interval (CI) ranging from 299 to 353. Diversification of Phlegmariurus dates to 22.6 Mya (CI: 12.8–33.7), close to the Late Tertiary.
|
| Fig. 4 Phylogenetic tree showing divergence times. The phylogenetic tree shows the topology and divergence time for 13 lycophyte species. Divergence times are indicated by light blue bars at the internodes; the range of these bars indicates 95% confidence interval of the divergence time. Numbers at the internodes indicate the mean divergence time. The geological timescale is illustrated at the bottom. |
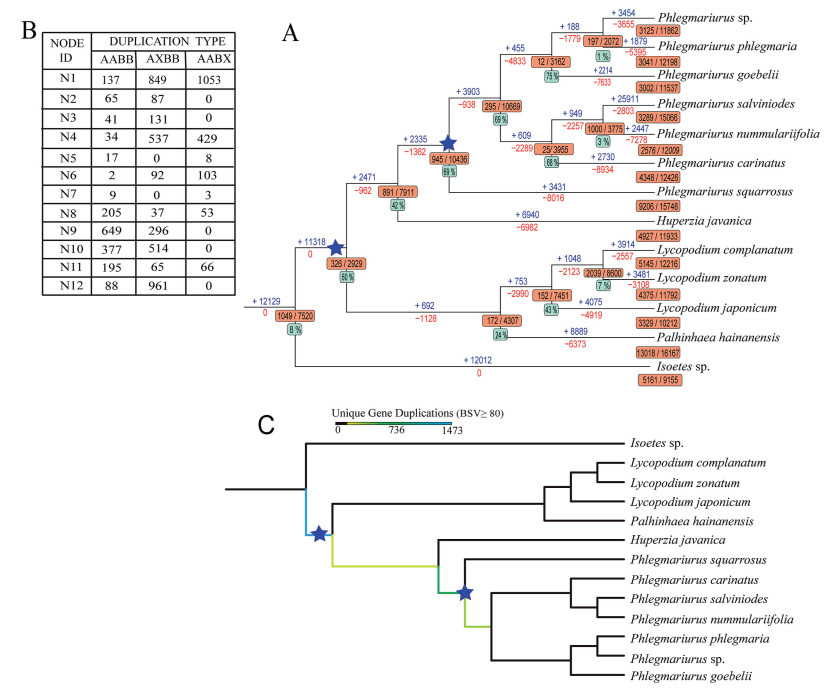
Because our general Ks analysis showed considerable variation, and we integrated reconciliation-based findings with analysis of Ks distributions to identify relatively recent and lineage-specific WGDs (Zwaenepoel et al., 2019). This required that we first determined stable phylogenetic relationships so as to classify the Ks of homologous pairs as different phylogenetic levels in internodes. For this purpose, we used Tree2GD and PUG to perform phylogenomic analysis. Both our phylogenomic approaches indicated that two WGD events occurred in Lycopodiaceae, one within the genus Phlegmariurus and the other in the common ancestor of Lycopodiaceae.
For Tree2GD analysis (Fig. 5A), we used the percent of gene duplications reported for a fern WGD (Huang et al., 2020) as a reference (8%). Higher percentages of residual duplicated genes of all branch paralogues retained within the MRCA nodes (the topology type of gene duplication as AABB) indicate less gene loss after duplication events. Although 26% (1000/3775) of the genes in the clade defined by the MRCA (N4 in Fig. 5A) were duplicated (far more than 8%), only 3% of genes were duplicated by two species (Phlegmariurus salviniodes and P. nummulariifolia), indicating that evidence for gene duplication shared by both species is weak. Of all nodes, only ancestral branch of family Lycopodiaceae (N11) and the ancestor of the Phlegmariurus (N11) have high percentages of gene duplications (> 8%) and high percentages of type AABB duplications (> 60%). In addition, we used Dollo parsimony analysis to map gene gains and gene losses to the phylogenetic trees. Parsimony analysis indicated that 2335 gene were gained and 1362 genes were lost in the ancestor of the Phlegmariurus (N9 in Fig. 5A), whereas 11, 318 genes were gained and no genes were lost in the ancestral branch of family Lycopodiaceae (N11 in Fig. 5A). A summary of duplication types is shown in Fig. 5B and the numbers of orthologous groups (OGs) corresponding to each node in Fig. 5A.
|
| Fig. 5 Detection of focal nodes labeled whole-genome duplications using phylogenomic approaches. (A) The two putative WGD events are depicted by blue stars. Numbers above and below branches indicate the expansion and contraction of gene families, respectively, with numbers of duplicated gene families shown by orange bars. Green bars indicate the percentage of AABB types in duplication nodes. (B) Summary of duplication types with numbers of orthologous groups (OGs) at corresponding nodes. (C) Mapping results from querying paralogous pairs identified from gene tree and species tree reconciliation based on the PUG algorithm. The number of duplication nodes with BSV ≥80 were counted and labeled below corresponding ancestral branches. The statistically unique geneduplication number is emphasized by colored branches. Two putative WGD events are depicted by blue stars. |
For PUG analysis (Fig. 5C), we examined ML gene trees constructed from 7237 gene families, including all of 13 Lycopodiaceae species. Collectively, these 7237 gene trees include gene duplication or incomplete homologous sequence mapping to the given species tree (Fig. S1). The ancestral node with the largest number of gene duplications was identified at the ancestral branch of family Lycopodiaceae (N11 in Fig. 5C and 1437 duplications BSV ≥80), which supports a polyploid event shared by all species in Lycopodiaceae. Large-scale duplication events were also indicated in the ancestor of the Phlegmariurus (N9 in Fig. 5C and 809 duplications BSV ≥80), which supports the other polyploid event shared by genus Phlegmariurus.
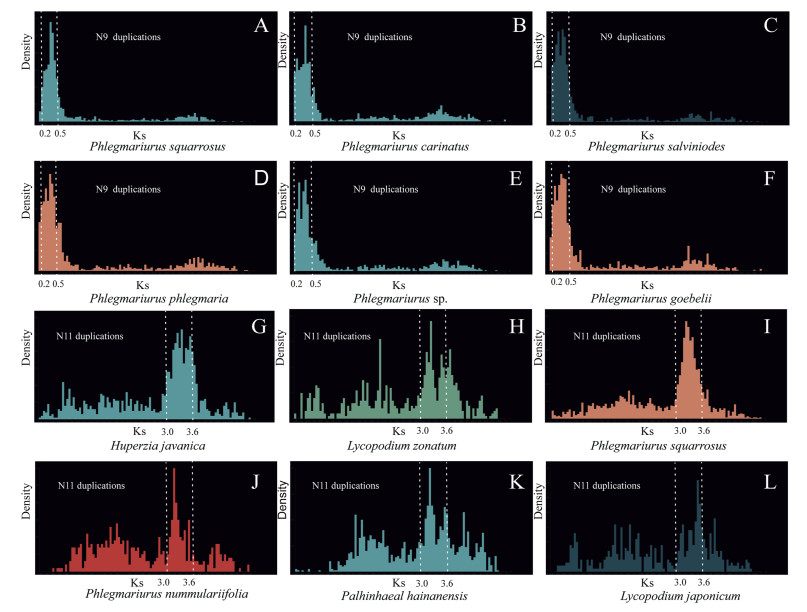
When we determined Ks frequency distributions for paralogous pairs defined in a gene family and classified the Ks values of gene pairs into different phylogenetic levels, we found that the paralogous pairs of species of genus Phlegmariurus were phylogenetically identified as products of gene duplications in the ancestor of the Phlegmariurus (N9) (Fig. 6A–F). Similarly, the products of the duplication at the ancestral branch of family Lycopodiaceae (N11) were identified as evidence of a WGD shared by Huperzia, Phlegmariurus, Lycopodium, and Palhinhaea (Fig. 6G–L). Based on the dated tree of Lycopodiaceae (Fig. 4) and Ks values of two putative WGDs (Fig. 6), we assumed 7.743–8.144 × 10⁻⁹ synonymous substitutions per site per year as a reference, and these peaks (0.2–0.5 and 3.0–3.6) were posited at 0.35 and 3.3 respectively. Thus, the age of WGD events has been determined to be ~22–23 Mya and ~206–214 Mya.
|
| Fig. 6 Ks analysis of the two putative WGDs (A)–(F) Ks distribution of six species supports a WGD shared by genus Phlegmariurus; (G)–(L) Ks distribution of six species supports a WGD shared by family Lycopodiaceae. |
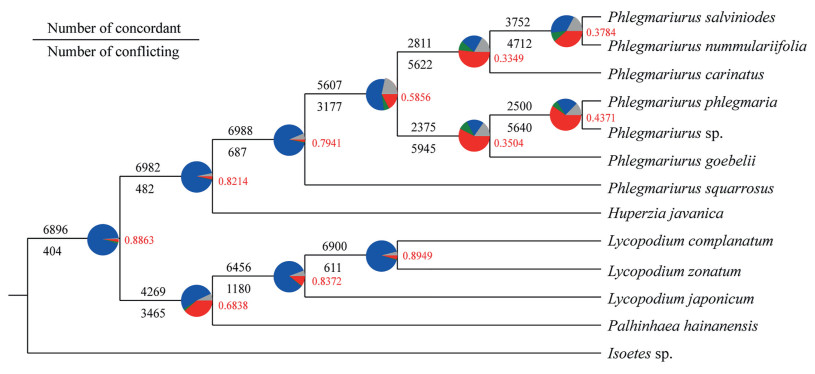
We examined the 13 large transcriptomic data sets for the presence of conflict and concordance in individual homologs across the phylogeny. Phyparts tree provided significant evidence of high concordance between gene trees and the guided species tree for the major relationships except for the clade of genus Phlegmariurus, which has obvious conflicts (Fig. 7). Therefore, by considering the frequency of all conflicting bipartitions in each node, we calculated internode certainty (ICA) scores to quantify incongruence among the grouped 7237 gene trees. ICA values ranged from 0.3349 to 0.8949. ICA values across the phylogeny were higher, except for those in Phlegmariurus, ranging from 0.7941 to 0.8949, whereas the ICA values in many of the ancestral nodes within Phlegmariurus were notably lower, ranging from 0.3349 to 0.5856, indicating a great deal of underlying gene tree conflict. These results suggest the presence of a complex multi-gene network underlies the divergent evolution of Phlegmariurus (Lycopodiaceae).
|
| Fig. 7 Phyparts assessment of phylogenomic signal. Pie charts tree quantifies the degree of conflict or congruence as follows: the proportion of gene trees in concordance (blue), the top alternative bipartition (green), all other alternative bipartitions (red), uninformative for that nodes (gray). Numbers above and below the branches also indicate the number of concordant and conflicting gene trees. Red numbers to the right of each node are the ICA values. |
Previous studies have used peaks in Ks distributions of transcriptomes to identify WGDs (Lynch and Conery, 2000). However, when we used this approach to detect WGDs in the transcriptomes of Lycopodiaceae species, we found considerable heterogeneity among species (Fig. 3), which is consistent with the limitations of Ks plot analyses in identifying relatively recent, lineage-specific WGDs (Tiley et al., 2018). Thus, in this study, we integrated Ks-based age distribution analysis and phylogenomic analyses (PUG and Tree2GD), which revealed that two WGDs occurred in Lycopodiaceae.
Our phylogenetic analyses both provide evidence that a WGD occurred in the common ancestor of extant Phlegmariurus (Lycopodiaceae) approximately 22–23 Mya and another WGD occurred in the common ancestor of Lycopodiaceae around 206–214 Mya. Our finding that a WGD event occurred around 206–214 Mya corresponds well to whole-genome duplications in lycophytes previously proposed by the One Thousand Plant Transcriptomes Initiative (1 KP). However, the 1 KP sampled only one Phlegmariurus species; in contrast, our study covered several species of Phlegmariurus. The other WGD event mapped to the Phlegmariurus clade is newly reported here. Our findings also indicate that without corroborating Ks analysis with reconciliation-based findings recent WGD events are overshadowed by SSDs. Although we have no direct evidence that our initial findings were affected by SSDs, the same conclusions have been previously reported (Hakes et al., 2007; Tiley et al., 2018). This, however, remains a difficult issue to resolve without structural genomic data.
The evolution of lycophyte genomes has long been considered controversial given the high chromosome numbers of taxa with demonstrated diploid genetic expression (Haufler, 2014). However, little is yet known about the molecular basis of diploidization (Clark et al., 2016). To understand the paradox of diploid genetic expression of lycophytes with high chromosome numbers, we compiled the number of chromosomes of all species in Lycopodiaceae from the chromosome counts database (CCDB) (Table S2). The number of chromosomes fluctuates dramatically within genus, ranging from tens to hundreds (Fig. 2). This observation suggests that most extant species of Lycopodiaceae have experienced multiple rounds of genome duplication. Therefore, we hypothesize that polyploidy is widespread in lycophytes and that diploid genetic expression of polyploidy has been typical throughout the evolutionary history of this group.
4.2. Divergence time estimatesLycophytes are an ancient group of plants with an extensive fossil record and are commonly thought to have diverged as early as 410 million years ago (Wikström and Kenrick, 2001; Testo et al., 2018). Fossils of Lycopodiaceae, a major clade of lycophytes, have yet to be recorded. One difficulty in assessing putative Lycopodiaceae fossils is that they are almost morphologically indistinguishable from Lepidodendrales and conifers (Wikström and Kenrick, 2001; Taylor et al., 2009). Thus, to infer divergence times in our phylogeny of Lycopodiaceae, we used two secondary calibration nodes generated from Tseto et al. (2018), which incorporate eight fossil calibrations (Schuettpelz et al., 2016). Our divergence time estimate for the crown age (202.6 Mya) of the Lycopodiaceae is younger than those reported by Wikström and Kenrick (2001) and Testo et al. (2018). Although the number of species sampled for divergence estimates in the family was small, our divergence time estimate for the diversification of Phlegmariurus is similar to previous reports, in which the origin of genus Phlegmariurus was found to be an ancient event (nearly Late Cretaceous), with species diversification occurring relatively recently (nearly Late Tertiary) (Testo et al., 2018).
4.3. Perspective on evolutionary conflict in the genus PhlegmariurusSequencing technology has afforded the opportunity to interpret sophisticated evolutionary mechanisms by increasing the availability of transcriptomic and genomic data sets (Delsuc et al., 2005). In addition, a greater number of large data sets also provides more heterogeneity for studies of phylogenetic relationships and biodiversity (Folk et al., 2018; Stubbs et al., 2020), which in turn may reflect phylogenetic signals. As previously reported in Micranthes (Saxifragaceae) (Stubbs et al., 2020), genetic discordance presents a valuable opportunity to develop hypotheses about its underlying causes, e.g., hybridization, polyploidization, and range shifts.
We found significant degrees of conflict at internal nodes within the Phlegmariurus gene tree (Fig. 7). Specifically, our analysis showed significant genetic discordance in individual homologs of Phlegmariurus, which implies a presence of a complicated multi-gene network related to divergent evolution. Gene duplication is a major mechanism for development of phenotypic innovation, while diversification of phenotypic innovation is typically found at nodes with high gene-tree conflict (Stull et al., 2021). Note that Testo et al. (2018) revealed that much of the diversity extant Phlegmariurus is recent, stemming from the Late Tertiary, even though the origin of the genus is much more ancient (Testo et al., 2018). Our estimate of the date of the WGD in Phlegmariurus suggests that the WGD played an important role in driving diversification.
In addition, our analysis presents credible evidence of genetic diversification, with both Phyparts and ICA scores providing poor support for the relationship within Phlemariurus. Taken together, these results suggest that Phlegmariurus is an ideal group for further investigation into a series of putative evolutionary events, such as hybridization, incomplete lineage sorting, or horizontal gene transfer, which may vary across the phylogeny.
Author contributionsYYH managed the project; XZQ, WZY and YYH conceived this research; GYF collected the plant material, SH and SJP sequenced the raw data; XZQ processed the raw data and analyzed the data; XZQ wrote the manuscript; WT and AJ suggested the manuscript; All authors contributed to the revision of the manuscript.
Data availabilityThe raw sequence data reported in this paper have been deposited in the Genome Sequence Archive (Wang et al., 2017) in the National Genomics Data Center, China National Center (Agarwala et al., 2016) for Bioinformation/Beijing Institute of Genomics, Chinese Academy of Sciences, under accession number CRA003961, and are publicly accessible at https://bigd.big.ac.cn/gsa.
Declaration of competing interestThe named authors declare that there is no conflict of interest, financial or otherwise.
AcknowledgmentsWe thank Rui Zhang, Hao Wang and Jiao Zhang for their help in field work and sample collection. We appreciate the editors, anonymous reviewers and Raymond Porter for carefully correcting the manuscript. This research was funded by the Strategic Priority Research Program of the Chinese Academy of Sciences (No. XDA19050404) and National Natural Science Foundation of China (No. 31800174).
Appendix A. Supplementary dataSupplementary data to this article can be found online at https://doi.org/10.1016/j.pld.2021.08.004.
Agarwala, R., Barrett, T., Beck, J., et al., 2016. Database resources of the national center for biotechnology information. Nucleic Acids Res., 44: D7-D19. DOI:10.1093/nar/gkv1290 |
Bolger, A.M., Lohse, M., Usadel, B., 2014. Trimmomatic: a flexible trimmer for Illumina sequence data. Bioinformatics, 30: 2114-2120. DOI:10.1093/bioinformatics/btu170 |
Cai, L.M., Xi, Z., Amorim, A.M., et al., 2019. Widespread ancient whole-genome duplications in Malpighiales coincide with Eocene global climatic upheaval. New Phytol., 221: 565-576. DOI:10.1111/nph.15357 |
Camacho, C., Coulouris, G., Avagyan, V., et al., 2009. BLAST+: architecture and applications. BMC Bioinformatics, 10: 421. DOI:10.1186/1471-2105-10-421 |
Clark, J., Hidalgo, O., Pellicer, J., et al., 2016. Genome evolution of ferns: evidence for relative stasis of genome size across the fern phylogeny. New Phytol., 210: 1072-1082. DOI:10.1111/nph.13833 |
Darriba, D., Taboada, G.L., Doallo, R., et al., 2011. ProTest 3: fast selection of best-fit models of protein evolution. Bioinformaics, 27: 1164-1165. DOI:10.1093/bioinformatics/btr088 |
Delsuc, F., Brinkmann, H., Philippe, H., 2005. Phylogenomics and the reconstruction of the tree of life. Nat. Rev. Genet., 6: 361-375. DOI:10.1038/nrg1603 |
Edgar, R.C., 2004. MUSCLE: multiple sequence alignment with high accuracy and high throughput. Nucleic Acids Res., 32: 1792-1797. DOI:10.1093/nar/gkh340 |
Emms, D.M., Kelly, S., 2015. OrthoFinder: solving fundamental biases in whole genome comparisons dramatically improves orthogroup inference accuracy. Genome Biol., 16: 14. DOI:10.1186/s13059-015-0581-9 |
Folk, R.A., Soltis, P.S., Soltis, D.E., et al., 2018. New prospects in the detection and comparative analysis of hybridization in the tree of life. Am. J. Bot., 105: 364-375. DOI:10.1002/ajb2.1018 |
Gao, B., Chen, M.X., Li, X.S., et al., 2020. Ancestral gene duplications in mosses characterized by integrated phylogenomic analyses. J. Syst. Evol.. DOI:10.1111/jse.12683 |
Haas, B.J., Papanicolaou, A., Yassour, M., et al., 2013. De novo transcript sequence reconstruction from RNA-seq using the Trinity platform for reference generation and analysis. Nat. Protoc., 8: 1494-1512. DOI:10.1038/nprot.2013.084 |
Hakes, L., Pinney, J.W., Lovell, S.C., et al., 2007. All duplicates are not equal: the difference between small-scale and genome duplication. Genome Biol., 8: 13. |
Haufler, C.H., 2014. Ever since Klekowski: testing a set of radical hypotheses revives the genetics of ferns and lycophytes. Am. J. Bot., 101: 2036-2042. DOI:10.3732/ajb.1400317 |
Huang, C.H., Qi, X., Chen, D., et al., 2020. Recurrent genome duplication events likely contributed to both the ancient and recent rise of ferns. J. Integr. Plant Biol., 62: 433-455. DOI:10.1111/jipb.12877 |
Katoh, K., Misawa, K., Kuma, K., et al., 2002. MAFFT: a novel method for rapid multiple sequence alignment based on fast Fourier transform. Nucleic Acids Res., 30: 3059-3066. DOI:10.1093/nar/gkf436 |
Leebens-Mack, J.H., Barker, M.S., Carpenter, E.J., et al., 2019. One thousand plant transcriptomes and the phylogenomics of green plants. Nature, 574: 679-685. |
Leitch, I.J., Leitch, A.R., 2013. Genome Size Diversity and Evolution in Land Plants. Springer Vienna, London, Britain.
|
Li, F.W., Brouwer, P., Carretero-Paulet, L., et al., 2018. Fern genomes elucidate land plant evolution and cyanobacterial symbioses. Nat. Plants, 4: 460-472. DOI:10.1038/s41477-018-0188-8 |
Li, W.Z., Godzik, A., 2006. Cd-hit: a fast program for clustering and comparing large sets of protein or nucleotide sequences. Bioinformatics, 22: 1658-1659. DOI:10.1093/bioinformatics/btl158 |
Lynch, M., Conery, J.S., 2000. The evolutionary fate and consequences of duplicate genes. Science, 290: 1151-1155. DOI:10.1126/science.290.5494.1151 |
Lynch, M., Conery, J.S., 2003. The evolutionary demography of duplicate genes. J. Struct. Funct. Genom., 3: 35-44. DOI:10.1023/A:1022696612931 |
McKain, M.R., Tang, H., McNeal, J.R., et al., 2016. A phylogenomic assessment of ancient polyploidy and genome evolution across the Poales. Genome Biol. Evol., 8: 1150-1164. |
Panchy, N., Lehti-Shiu, M., Shiu, S.H., 2016. Evolution of gene duplication in plants. Plant Physiol., 171: 2294-2316. DOI:10.1104/pp.16.00523 |
Sattler, M.C., Carvalho, C.R., Clarindo, W.R., 2016. The polyploidy and its key role in plant breeding. Planta, 243: 281-296. DOI:10.1007/s00425-015-2450-x |
Schuettpelz, E., Schneider, H., Smith, A.R., et al., 2016. A community-derived classification for extant lycophytes and ferns. J. Syst. Evol., 54: 563-603. |
Smith, S.A., Moore, M.J., Brown, J.W., et al., 2015. Analysis of phylogenomic datasets reveals conflict, concordance, and gene duplications with examples from animals and plants. BMC Evol. Biol., 15: 1-15. |
Soltis, P.S., Soltis, D.E., 2016. Ancient WGD events as drivers of key innovations in angiosperms. Curr. Opin. Plant Biol., 30: 159-165. |
Stamatakis, A., 2014. RAxML version 8: a tool for phylogenetic analysis and post-analysis of large phylogenies. Bioinformatics, 30: 1312-1313. DOI:10.1093/bioinformatics/btu033 |
Stubbs, R.L., Folk, R.A., Xiang, C.L., et al., 2020. A phylogenomic perspective on evolution and discordance in the Alpine-Arctic plant clade Micranthes (Saxifragaceae). Front. Plant Sci., 10: 1773. |
Stull, G.W., Qu, X.J., Parins-Fukuchi, C., et al., 2021. Gene duplications and phylogenomic conflict underlie major pulses of phenotypic evolution in gymnosperms. Nat. Plants, 7: 1015-1025. DOI:10.1038/s41477-021-00964-4 |
Taylor, T.N., Taylor, E.L., Krings, M., 2009. Paleobotany: the Biology and Evolution of Fossil Plants. Elsevier Science Publishers BV, Amsterdam, Netherlands.
|
Testo, W., Field, A., Barrington, D., 2018. Overcoming among-lineage rate heterogeneity to infer the divergence times and biogeography of the clubmoss family Lycopodiaceae. J. Biogeogr., 45: 1929-1941. DOI:10.1111/jbi.13373 |
Tiley, G.P., Barker, M.S., Burleigh, J.G., 2018. Assessing the performance of Ks plots for detecting ancient whole genome duplications. Genome Biol. Evol., 10: 2882-2898. |
Vanneste, K., Baele, G., Maere, S., et al., 2014. Analysis of 41 plant genomes supports a wave of successful genome duplications in association with the Cretaceous-Paleogene boundary. Genome Res., 24: 1334-1347. DOI:10.1101/gr.168997.113 |
Vanneste, K., Sterck, L., Myburg, A.A., et al., 2015. Horsetails are ancient polyploids: evidence from Equisetum giganteum. Plant Cell, 27: 1567-1578. DOI:10.1105/tpc.15.00157 |
Wang, J.P., Yu, J.G., Sun, P.C., et al., 2020. Paleo-polyploidization in lycophytes. Genom. Proteom. Bioinform., 18: 333-340. |
Wang, Y.Q., Song, F.H., Zhu, J.W., et al., 2017. GSA: genome sequence archive. Genom. Proteom. Bioinform., 15: 14-18. |
Wikström, N., Kenrick, P., 2001. Evolution of Lycopodiaceae (Lycopsida): estimating divergence times from rbcL gene sequences by use of nonparametric rate smoothing. Mol. Phylogenet. Evol., 19: 177-186. |
Yu, G.C., Smith, D.K., Zhu, H.C., Guan, Y., et al., 2017. GGTREE: an R package for visualization and annotation of phylogenetic trees with their covariates and other associated data. Methods Ecol. Evol., 8: 28-36. |
Yang, Z.H., 2007. Paml 4: phylogenetic analysis by maximum likelihood. Mol. Biol. Evol., 24: 1586-1591. DOI:10.1093/molbev/msm088 |
Zhang, C.F., Zhang, T.K., Luebert, F., et al., 2020. Asterid phylogenomics/phylotranscriptomics uncover morphological evolutionary histories and support phylogenetic placement for numerous whole-genome duplications. Mol. Biol. Evol., 37: 3188-3210. DOI:10.1093/molbev/msaa160 |
Zhang, G.Q., Liu, K.W., Li, Z., et al., 2017. The Apostasia genome and the evolution of orchids. Nature, 549: 379-383. DOI:10.1038/nature23897 |
Zhang, L.S., Wu, S.D., Chang, X.J., et al., 2020. The ancient wave of polyploidization events in flowering plants and their facilitated adaptation to environmental stress. Plant Cell Environ., 43: 2847-2856. DOI:10.1111/pce.13898 |
Zhou, S.Y., Chen, Y.M., Guo, C.C., et al., 2020. PhyloMCL: accurate clustering of hierarchical orthogroups guided by phylogenetic relationship and inference of polyploidy events. Methods Ecol. Evol., 11: 943-954. DOI:10.1111/2041-210x.13401 |
Zwaenepoel, A., Li, Z., Lohaus, R., et al., 2019. Finding evidence for whole genome duplications: a reappraisal. Mol. Plant, 12: 133-136. |


