b. University of Chinese Academy of Sciences, Beijing, 100049, China;
c. School of Resource and Environment, Hubei University, Wuhan, 430062, China
The spatial heterogeneity of plant communities is controlled by several factors, both biotic and abiotic, including topography and soil nutrients (Li et al., 2017; Liang and Chan, 2017). These factors also influence spatiotemporal distributions of vegetation (Iturrate-Garcia et al., 2016; Peringer et al., 2017; Phillips et al., 2017; Yang et al., 2019). Research has indicated that relatively small changes in environmental factors can have a substantial impact on species composition and diversity in plant communities (Luan et al., 2012), and consequently, on physiognomic differentiation of vegetation (Chmielewski et al., 2017; Sarquis et al., 2019). Therefore, assessing species composition and diversity in different plant communities relies on determining the magnitude and distribution of environmental factors. However, it is difficult to determine the effect of environmental factors because of spatial and temporal variation (Adachi et al., 2017; Kersti et al., 2020), especially in natural environments such as subtropical evergreen-deciduous broadleaved mixed forests, where topography, soil factors and plant communities are generally complex (Yun et al., 2020).
Evergreen-deciduous broadleaved mixed forest is a forest vegetation type between deciduous broadleaved forest and evergreen broadleaved forest (Huang et al., 2015). At present, studies on evergreen-deciduous broadleaved forest mainly focus on the basic concept (Nkosi et al., 2016), spatial distribution (Li et al., 2010), species composition (Yun et al., 2020), community renewal (Gebrehiwot et al., 2020), invasion of alien species (Iturrate-Garcia et al., 2016), and distribution of rare and endangered species (Yang et al., 2019). However, these studies have rarely examined how topographical and soil nutrient factors in evergreen-deciduous broadleaved mixed forest drive variation in mountain plant community types or quantified the relative contribution of each driver.
Most studies that examine how environmental factors structure plant communities have focused on the effects of elevation (Liang and Chan, 2017; Fan et al., 2020; Tajik et al., 2020). For example, the role that elevation plays in controlling plant growth conditions such as sunlight and water content are relatively well-understood as are slope (Li et al., 2010; Zheng et al., 2013), aspect (De Jager et al., 2016; Wang et al., 2016), and slope position (Liu et al., 2019; Yao et al., 2019; Ayoubi and Moazzeni, 2020). Studies have also found that the availability of soil nutrients determine plant growth and development, and affect the distribution of vegetation. For example, soil nutrients have been correlated with spatial heterogeneity in grasslands (Qi et al., 2010) and natural forests (Huang et al., 2015; Toriyama et al., 2015; Wang et al., 2016). In addition, studies have shown that a wide variety of soil nutrients, including soil organic matter, nitrogen, phosphorus, and other factors, affect the species composition and diversity of plant communities (Townsend et al., 2008; Becknell and Powers, 2014). Among edaphic factors, soil nutrient content may influence the structure and diversity of plant communities indirectly by affecting parameters such as tree height and basal area.
High variation in topography and soil content may be caused by the complex species composition (Iturrate-Garcia et al., 2016; Yun et al., 2020) and spatial heterogeneity of forests (Rodrigues et al., 2016; Zeng et al., 2020), leading to interactive effects which intensify the impact of topography and soil content on plant communities, especially in subtropical evergreen-deciduous broadleaved forest vegetation (Huang et al., 2015). However, studies that examine the effect of highly variable environmental factors are limited when only a few factors or a single vegetation type is measured and cannot estimate plant community composition and diversity with much certainty (Hasselquist et al., 2012; Chen et al., 2017). A few reports have examined how multiple factors, including topography and soil nutrients, structure plant community composition and diversity in evergreen-deciduous broadleaved forest (Tajik et al., 2020). Yet, current knowledge of the factors and underlying mechanisms that drive forest plant community variation is relatively limited.
To better understand the interactions between species diversity, community composition, and the environment, we investigated the relationships between plant community types and environmental factors in evergreen-deciduous broadleaved mixed forest in northwestern Hubei province, China. We hypothesized that 1) the importance values of species are related to plant community types and 2) the species composition and diversity of plant communities in the subtropical evergreen-deciduous broadleaved mixed forest would be mainly explained by the topography and soil nutrient factors. To test these hypotheses, we established randomized quadrats for mountain forest dynamics monitoring in subtropical evergreen-deciduous broadleaved mixed forests in northwestern Hubei Province, China. We synthesized field survey data sets of topography, soil nutrients, and plant identification, and used importance values of species in quadrats to systematically and quantitatively classify species composition, diversity indices and structural characteristics of plant communities, especially evergreen and deciduous species proportions. We also determined whether these characteristics of the plant communities were correlated with environmental factors, including topography and soil content.
2. Materials and methods 2.1. Study areaThe study was conducted in the Jingshan and Daba mountain ranges, northwestern Hubei Province (central China), at 109°4′ to 112°9′E and 31°2′ to 32°6′N, with a total area of 30, 286 km2 (Fig. 1). This area, which is characterized by mountains and forests, has a high elevation of 3105 m (a.s.l.) and a low elevation of 129 m (a.s.l.). Soil types in the study area are distinct at different elevations. Below 1200 m (a.s.l.) the study area has yellow soil; from 1200 m to 1800 m (a.s.l.) the soil is mainly yellow brown (Yang et al., 2017). The Jingshan and Daba mountain ranges serve as a watershed for the rivers between the Han River Basin and the Yangtze River Basin. These ranges are situated within a typical transition zone between the northern subtropical zone and the southern temperate zone, and also occupy a topographical transition zone, the second tier of China's three-tiered terrain, in which elevation is reduced from the southwest (Li et al., 2013; Tian et al., 2017). The annual mean air temperature is 15.4 ℃ with minimum and maximum monthly means of −6.7 ℃ in January and 37.5 ℃ in July; the mean annual effective accumulated temperature of ≥10 ℃ is approximately 4878 ℃, and the frost-free period is about 243 days. The precipitation level in the study area ranges between 800 and 1000 mm, and the average annual relative humidity is approximately 74%. The vertical zoning of vegetation is distinct, and the vegetation coverage rate reaches 80%, which is mainly affected by special climatic conditions and topographic features (Yang et al., 2019).

|
| Fig. 1 Plant quadrat distribution in Jingshan and Daba mountain ranges in northwestern Hubei Province, China. |
From April 2015 to September 2018, we established 213 forest dynamics monitoring quadrats in areas of the study site representative of the natural forest vegetation. Each randomly-located quadrat had an area of 20 m × 20 m and was located between elevations of 724–2611 m. The quadrats were constructed in accordance with the field methodology developed by the Center for Tropical Forest Science (CTFS) for forest dynamics plant sample plot monitoring (Condit, 1998; Huang et al., 2015). The grid method was used to divide each plot into 16 small plots of 5 m × 5 m, and all woody stems with diameter at breast height (DBH) ≥ 1 cm were tagged, identified, measured, and georeferenced.
2.3. Environmental factor measurementsAt each plot, the geographic location (including latitude, longitude, and elevation) and slope were recorded using a handheld GPS unit (Garmin GPS72H, Taiwan, China) and a clinometer, respectively. Slope aspect was measured using a Suunto compass and was given a code according to the methods of Zerihun and Backéus (1991) (N = 0; E = 2; S = 4; W = 2.5) and Bekele (1994) (NE = 1; SE = 3; SW = 3.3 and NW = 1.3). Slope position was given a code as described by Huang et al. (2015). Such factors are considered the topographical characteristics of every quadrat. The litterfall biomass of the plots of trees was used to measure plant productivity (Huang et al., 2015; Iturrate-Garcia et al., 2016).
The soil water content at 0–5 cm soil layer at each quadrat was determined using a type E thermocouple (REOTEMP Inc., San Diego, USA) and a GS-3 soil moisture probe (Decagon Devices, Inc. WA, USA). For each soil sample collected, ring samplers made of polyvinyl chloride (20 cm in diameter and 7 cm in height) were inserted 4 cm into each quadrat for soil nutrient measurements. Small living plants inside the ring samplers were clipped to eliminate aboveground plant influences. Soil samples were oven-dried at 105 ℃ for up to 24 h. The samples were sieved to remove the coarse soil particles, and the fraction < 5 mm was analyzed for chemical properties, including soil pH (pH, measured by the standard measurement) in water 1:25 (w/v), soil organic matter (SOM, measured by the external heating of potassium dichromate oxidation method), total nitrogen (TN, measured by Micro–Kjedahl digestion method), total phosphorus (TP, measured by NaOH digestion Mo–Sb colorimetry method), available nitrogen (AN, measured by alkali N-proliferation method), and available phosphorus (AP, measured by Bray II method).
2.4. Data analysesThe quadrats were used as the unit to calculate the importance value (IV) of the species in the quadrats using the formula: importance value (IV) = (relative abundance + relative significance + relative frequency)/3 (Zhang et al., 2018). The two-way indicator species analysis (TWINSPAN) in the VEAPAN software package was used for systematic quantitative classification of the quadrats (Li et al., 2017). Detrended correspondence analysis (DCA) in the CANOCO 4.5 software was used to explain and verify mountain plant community types obtained by TWINSPAN systematic quantitative classification (Kersti et al., 2020), which are all based on a matrix of the importance values of species and quadrats. The species were divided into three classes according to diameter at breast height (DBH): small DBH (1 cm ≤ DBH < 15 cm), medium DBH (15 cm ≤ DBH < 30 cm), and large DBH (DBH ≥ 30 cm). The mountain plant community structure was represented using the Shannon–Wiener diversity index, Pielou evenness index, Simpson dominance index, and Sorenson similarity index.
Linear regression analysis was applied to fit the relationships between the 12 environmental factors and species richness in the quadrats of plant communities given the insignificant difference between the Akaike information criterion (AIC) values for linear and nonlinear (quadratic) models (ΔAIC < 2) (Mellado and Zamora, 2015). To further study the potential pathways by which topography, soil nutrients, and other environmental factors may regulate species richness in the quadrats, we performed structural equation modeling (SEM) using the data set collected in the present study (Phillips et al., 2017). The model was fitted using the SPSS AMOS 21.0 for Windows 10 operation system (SPSS Inc., Chicago, IL, USA).
Finally, we determined the relationship between the 12 environmental factors and the plant community types using permutation-based multiple regression on Bray–Curtis similarity distance matrices, which significantly reflect the factors that affect species composition changes in the community (Lichstein, 2007; Yun et al., 2020). All statistical analyses were performed using R v.3.5.2 (R, Development Core Team) with "stats, " "raster, " "vegan, " and "ggplot2" software packages.
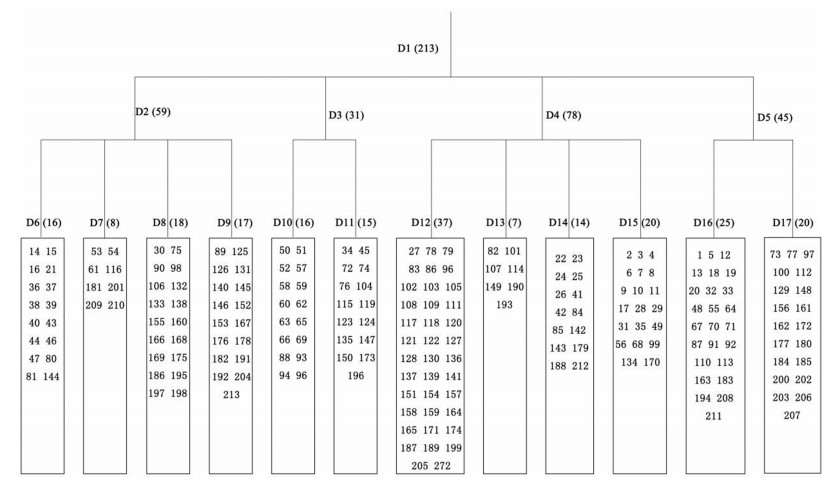
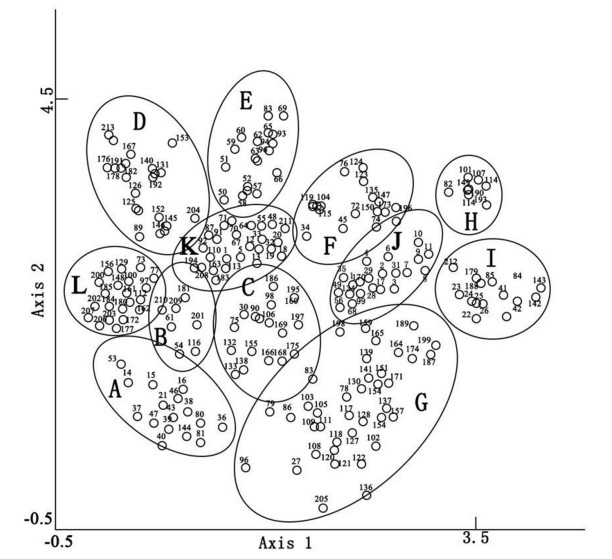
3. Results 3.1. Vegetation taxonomy 3.1.1. Classification of plant communitiesTWINSPAN classification indicated that the mountain forest plants in northwestern Hubei Province can be divided into 12 communities (Fig. 2, Table.1). This finding was verified in the DCA chart (Fig. 3), which shows the contribution rates of the first and second axes were 56.7% and 29.8%, respectively, and the cumulative contribution rate was 86.5%. Distribution characteristics for different communities are shown in Table 2. Plant communities were named following the International Code of Phytosociological Nomenclature (Dessalegn et al., 2014).
|
| Fig. 2 Dendrogram of TWINSPAN classification for 213 quadrats of mountain forest dynamics monitoring in the typical subtropical natural forest region in northwestern Hubei, China. D, division number. |
| Community types | Dominant species |
| A | Pinus armandii+Sorbus caloneura – Indocalamus nubigenus |
| B | Sinowilsonia henryi+Cyclobalanopsis glauca – Chimonobambusa neopurpurea |
| C | Cyclobalanopsis multinervis+Taxus chinensis – Anemone hupehensis |
| D | Rhododendron hypoglaucum+Pinus massoniana – Parathelypteris nipponica |
| E | Betula albosinensis+Platycarya strobilacea – Camellia cuspidate |
| F | Quercus spinosa+Corylus heterophylla var. sutchuenensis – Humulus scandens |
| G | Phoebe faberi+Tetracentron sinense+Quercus acrodonta – Eriophorum comosum |
| H | Euptelea pleiospermum+Davidia involucrata var. vilmoriniana – Elatostema involucratum |
| I | Fagus engleriana+Cornus macrophylla – Abelia macrotera |
| J | Pinus armandii+Populus davidiana+Picea wilsonii – Fragaria orientalis |
| K | Abies fargesii+Populus simonii – Ligularia veitchiana |
| L | Machilus ichangensis+Sycopsis sinensis – Camellia cuspidate |
|
| Fig. 3 Two-dimensional detrended correspondence analysis ordination diagram for the 213 quadrats of mountain forest dynamics monitoring in typical subtropical natural forest region in northwestern Hubei, China. Letters (A, B, C …) indicate different plant community types. |
| Community types | Slope (°) | Slope aspect | Slope position | Litterfall (cm) | Elevation (m) |
| A | 15–40 | NW, NE | Middle, lower slope | 1.5–2.0 | 1700–1800 |
| B | 15–80 | E, NW, N | Upper slope, platform | 0.5–4.0 | 300–1500 |
| C | 30–40 | S, SE, E | Lower slope | 1.0–2.0 | 900–1700 |
| D | 10–15 | SE, SW | Upper slope, ridge | 0.5–1.5 | 2000–2200 |
| E | 25–65 | S, SW, W | Ridge, platform | 0.5–3.0 | 1000–1400 |
| F | 20–70 | N, NW, NE | Lower slope | 0.5–4.0 | 700–1600 |
| G | 20–35 | SE, SW | Upper slope, platform | 1.0–2.0 | 1500–2700 |
| H | 20–50 | N, NW | Upper slope | 0.5–3.0 | 800–1700 |
| I | 40–65 | SE, SW | Upper slope | 1.0–5.0 | 1400–2500 |
| J | 10–50 | N, NE | Middle, lower slope | 1.0–2.0 | 1500–1800 |
| K | 35–65 | NW, NE | Upper slope, ridge | 1.0–4.0 | 1500–2000 |
| L | 20–40 | S, SE | Middle slope | 0.5–2.0 | 600–1500 |
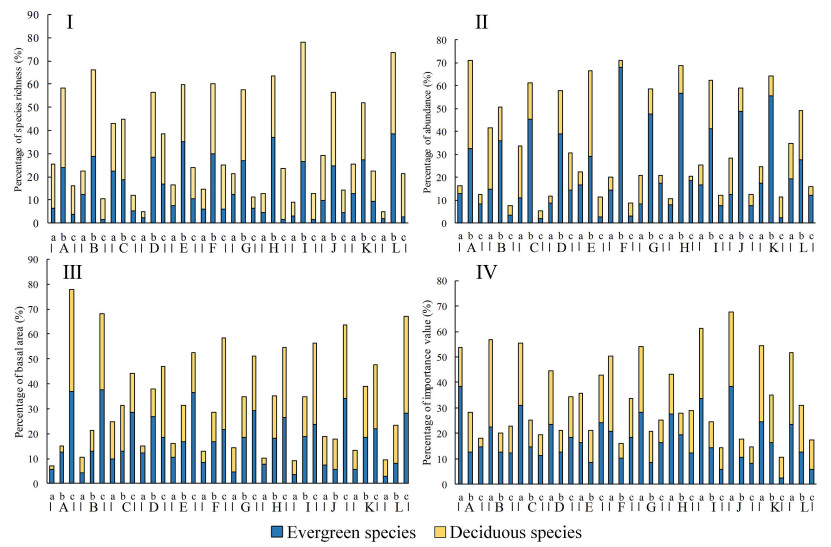
For all communities, the medium DBH class (15 cm ≤ DBH < 30 cm) had the highest ratio of evergreen to deciduous species richness. Species richness was higher for deciduous species than for evergreen species in the small DBH class (1 cm ≤ DBH < 15 cm) and the large DBH class (DBH ≥ 30 cm) of communities A, B, I, L. In all species communities, abundance was highest in the medium DBH class. Evergreen species abundance was greater than deciduous species abundance in all communities except A and E (Fig. 4-Ⅱ). In all communities except D and J, the ratio of evergreen basal area to deciduous basal area increased with the presence of higher classes of DBH. The basal area of deciduous species in the larger DBH classes was greater than that of evergreen species in communities A, F and L (Fig. 4-Ⅲ). In all communities, the species importance values were highest in the small DBH class, and the importance values of deciduous species was higher than that of evergreen species in communities B, F, K and L (Fig. 4-Ⅳ). These results might be related to the terrain and soil nutrients of the community.
|
| Fig. 4 Evergreen/deciduous ratio of species richness, abundance, basal area at breast height and importance values with DBH classes in subtropical evergreen-deciduous broadleaved mixed forest in northwestern Hubei, China. DBH, diameter at breast height. a, 1 cm ≤ DBH < 15 cm; b, 15 cm ≤ DBH < 30 cm; c, DBH ≥30 cm. I, II, III, and IV represent percentage of species richness, percentage of abundance, percentage of basal area and percentage of importance values, respectively. Letters (A, B, C …) indicate different community types. |
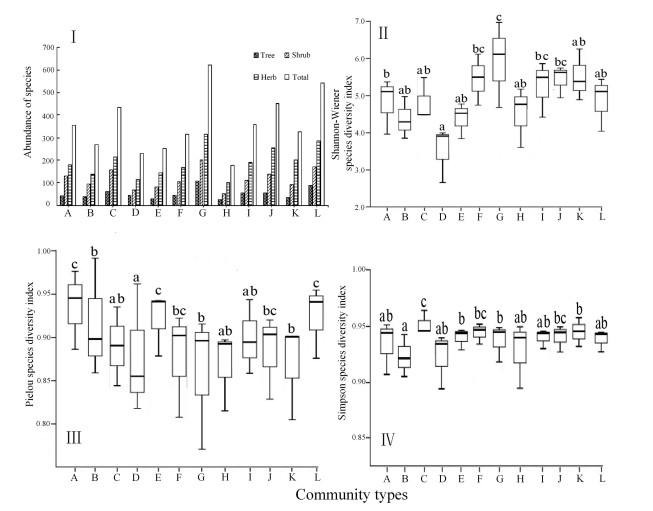
The species richness, Shannon–Wiener, Pielou, and Simpson species diversity indices of the 12 community types are shown in Fig. 5. Linear regression analysis indicates that species abundance is significantly higher in communities G and L than in other communities. In contrast, species abundance is not significantly different in communities D, E, and H. We found that communities G and H had the highest and lowest number of species with 623 and 177, respectively (Fig. 5-Ⅰ). The Shannon–Wiener diversity index was significantly lower for community D than for community G. The Pielou evenness index indicates that diversity is significantly lower in community D than in the other communities, while differences in diversity between communities H, C, and I are not significant (Fig. 5-Ⅲ). The Simpson species diversity index indicates that diversity is not significantly different between communities H and I (Fig. 5-Ⅳ).
|
| Fig. 5 (Ⅰ) Changes in species richness, (Ⅱ) Shannon–Wiener species diversity index, (Ⅲ) Pielou species evenness index, and (Ⅳ) Simpson species diversity index of different community types. Letters (A, B, C, …) indicate different community types. |
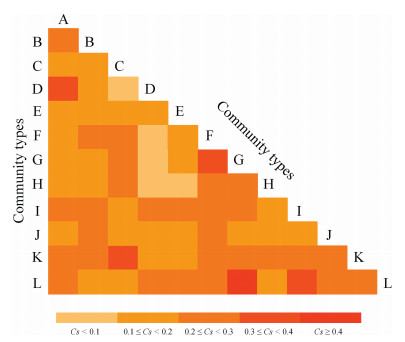
The Sorenson species similarity coefficient (CS) for different community types varied from approximately 0.01 to 0.6, and was mainly distributed from 0.1 to 0.3 (Fig. 6). Communities H and L had the highest CS (CS = 0.5994), which indicates that these communities have many identical species. This result also corresponds to the Shannon–Wiener and the Simpson indices. These findings indicate that species composition of communities is related to environmental factors.
|
| Fig. 6 Matrix of Sorenson species similarity coefficients (Cs) of different community types. Letters (A, B, C …) indicate different community types. |
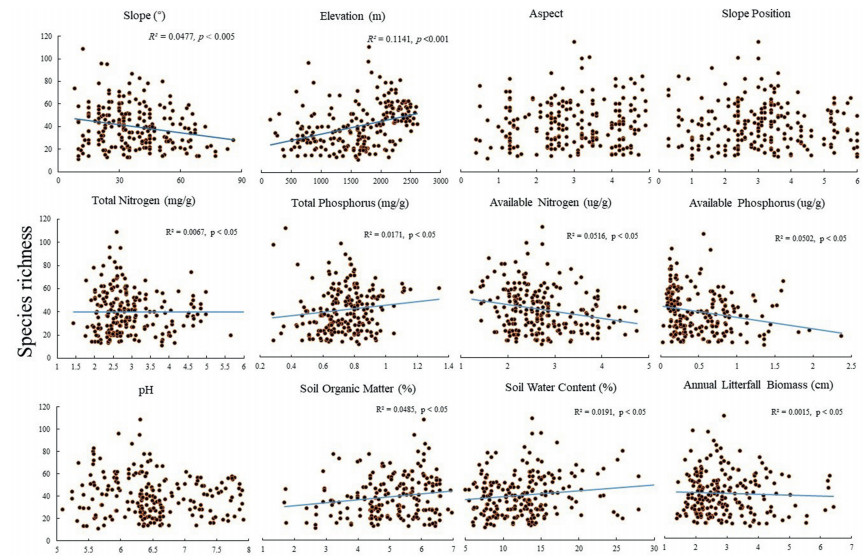
Linear regression analyses show that species richness in evergreen and deciduous community types is positively correlated with various environmental factors (Fig. 7), including elevation (R2 = 0.1141, p < 0.001), soil organic matter (R2 = 0.0485, p < 0.05), soil water content (R2 = 0.0191, p < 0.05), litterfall (R2 = 0.0015, p < 0.05), total nitrogen (R2 = 0.0067, p < 0.05), total phosphorus (R2 = 0.0171, p < 0.05), available nitrogen (R2 = 0.0516, p < 0.05), and available phosphorus (R2 = 0.0502, p < 0.05). Species richness in these communities is negatively correlated with slope, slope position, aspect, and pH.
|
| Fig. 7 Relationships between topography, soil nutrients, pH, soil organic matter, soil water content, annual litterfall biomass, and species richness in different quadrats of the community types. Statistics (R value and p) of fitted lines are displayed on the graphs. |
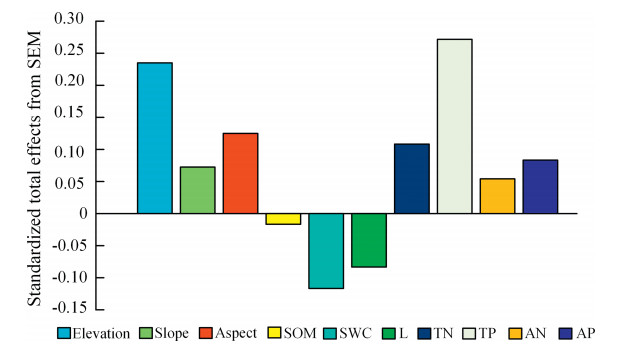
Standardized total effects from SEM analysis show that 51% of the spatial variation in species richness can be explained by the topographical and environmental factors investigated (Fig. 8). The factors that had the largest positive effect on species richness include elevation (0.24), aspect (0.12), total nitrogen (0.11), and total phosphorus (0.26). The factors that had the largest negative effects on species richness include soil water content (−0.13), litterfall (−0.1).
|
| Fig. 8 Standardized total effects derived from structural equation modeling (SEM) for the effects of environmental factors on species richness. SOM, soil organic matter; SWC, soil water content; L, litterfall; TN, total nitrogen; TP, total phosphorus; AN, available nitrogen; and AP, available phosphorus. |
Permutation-based multiple regression on Bray–Curtis similarity distance matrices shows that 68.37% of the spatial variability of species composition can be explained jointly by topography and soil nutrients (R2 = 0.6837, p < 0.05). Species composition in different communities is positively correlated with spatial variation in elevation (R2 = 0.2132, p < 0.001), slope (R2 = 0.0575, p < 0.01), slope position (R2 = 0.0149, p < 0.05), total nitrogen (R2 = 0.0015, p < 0.01), total phosphorus (R2 = 0.0428, p < 0.001), available nitrogen (R2 = 0.1186, p < 0.001), and available phosphorus (R2 = 0.2352, p < 0.001). These are also the main factors correlated with plant growth in the study area. In contrast, species composition is not correlated with aspect, soil water content, pH, soil organic matter, or litterfall (Table 3).
| Environmental variables | R2 | p | Environmental variables | R2 | p |
| Elevation | 0.2132 | 0.001*** | Soil organic matter | 0.0006 | 0.092 |
| Slope | 0.0575 | 0.002** | Litterfall | 0.0054 | 0.076 |
| Slope position | 0.0149 | 0.026* | Total nitrogen | 0.0015 | 0.002** |
| Aspect | 0.0027 | 0.063 | Total phosphorus | 0.0428 | 0.001*** |
| Soil water content | 0.0019 | 0.071 | Available nitrogen | 0.1186 | 0.001*** |
| pH value | 0.0029 | 0.059 | Available phosphorus | 0.2352 | 0.001*** |
| *, difference is significant at 0.05 level; **, difference is significant at 0.01 level; ***, difference is significant at 0.001 level; R2, coefficient of determination. | |||||
The systematic quantitative classification of plant communities is one of the most complex issues in vegetation ecology (Chen et al., 2015). To date, no unified classification principles or classification system are used by vegetation scientists (Song, 2004; Oyola-Guzmán and Oyola-Morales, 2018). The vegetation in the subtropical region of China has complex and diverse characteristics, which increase the difficulty of quantitative classification of vegetation. Moreover, traditional plant community systematic classification is mostly based on appearance characteristics and species composition of the community, which are greatly influenced by personal experience (Qin et al., 2016). As the requirements for accuracy improve in vegetation research, systematic quantitative classification methods that can provide objective results are becoming increasingly important in vegetation classification (Oyola-Guzmán and Oyola-Morales, 2018). At present, classification methods in quantitative ecology have become indispensable to modern vegetation research. Two such methods, two-way indicator species analysis (TWINSPAN) and detrended correspondence analysis (DCA), have been widely used in quantitative classification of mountain plant communities, such as forests and grasslands (Sun et al., 2009; Lian et al., 2015).
In this study, we used these quantitative classification methods to classify forest dynamics quadrats in evergreen-deciduous broadleaved mixed forest of northwestern Hubei Province. The TWINSPAN method classified 213 quadrats into 12 plant community types, which were verified by DCA. In addition to identifying plant community types, this study confirms that the combination of TWINSPAN classification and DCA verification is feasible for the analysis of vegetation quantity in subtropical regions and can be complemented and cross-checked.
4.2. The effect of topographical factors on species richness and composition of the evergreen-deciduous broadleaved mixed forest plant communityThe relationship between environmental factors and biodiversity patterns has long been a research focus of ecology (Zellweger et al., 2015; Idowu et al., 2020). The species composition of communities is strongly influenced by environmental factors (Mellado and Zamora, 2015) and changes in these environmental factors diversify habitats, leading to species differences across regions (Peringer et al., 2017). Evergreen-deciduous broadleaved mixed forest plants are important for biodiversity at a regional scale, especially in priority protection areas (Gebert et al., 2019; Idowu et al., 2020). In this study, we assessed the relationship between species and environmental topographical and soil factors using linear regression and SEM analysis. Our results indicate that topography and soil environmental factors have a large impact on the distribution of evergreen-deciduous broadleaved mixed forest plant communities (Table 3, Fig. 8).
Topographical factors indirectly have a significant impact on the species composition of plant communities by controlling the spatial distribution of solar radiation and precipitation (Iturrate-Garcia et al., 2016; Fan et al., 2020). For example, species composition of vegetation communities in subtropical evergreen-deciduous broadleaved mixed forest is greatly affected by low temperatures associated with high elevations (Pandey et al., 2018). In this study we analyzed which environmental and topographical factors were correlated with variations in species richness and diversity in plant communities of subtropical evergreen-deciduous broadleaved mixed forest. We found that the species diversity index and species richness of the communities G, L, and C were significantly higher than those of the other communities. Comparative analysis found that these communities were mainly distributed on sun slope and semi-sun slope areas with a slope of less than 50°, a thin litterfall layer, and a mid-high elevation section of 800–2500 m (Table 2).
Species richness, abundance, basal area and importance values of evergreen and deciduous species in each community type were different. The richness of deciduous species in most community types were higher than those of evergreen species, whereas the richness and basal area of deciduous species in the medium diameter at breast height (DBH) class (15 cm ≤ DBH < 30 cm) and large DBH class (DBH ≥ 30 cm) in each community type were lower than those of evergreen species. Abundance of evergreen species in the medium DBH class were higher than those of deciduous species. However, importance values of evergreen species in the majority of the community types were higher than those of deciduous species in the small DBH class (1 cm ≤ DBH < 15 cm) (Fig. 4). This phenomenon may be attributed to the fact that moderate light promotes the germination of the soil seed bank, which affects the density of seedlings and young trees.
We also found that communities with low species richness (D and H) are located near the forest fire isolation belt in the reserve and distributed in low-elevation areas that have long been disturbed by human logging. In contrast, communities with higher species richness (G and L) are mainly located on shady slopes, and the lighting conditions in the forest are moderate and suitable for the growth of species (Fig. 7). Moreover, the structural composition and species diversity indices of plant communities show specific patterns of differentiation and gradient (Gebrehiwot et al., 2020), as topographical factors (elevation, aspect, slope, and slope position) affect the distribution of vegetation (Fig. 7), and in turn they jointly affect the redistribution of water, temperature, nutrients, light, and other materials and energy.
4.3. The effect of soil factors on species richness and composition of the evergreen-deciduous broadleaved mixed forest plant communitySoil nutrients also affect the species composition of plant communities (Idowu et al., 2020), which is crucial for plant growth and reproduction (De Jager et al., 2016). Plant communities located in areas with high soil nitrogen content have highly diverse vegetation types. In subtropical evergreen-deciduous broadleaved mixed forests, nitrogen-rich soils are likely created by plant species with high nitrogen mineralization rates (Huang et al., 2015; Deacon et al., 2020), although, studies have shown that species in these forests do not have significantly different nitrogen mineralization rates (Becknell and Powers, 2014). In our study, the growth requirements of the 12 plant community types of evergreen-deciduous broadleaved mixed forest varied substantially. Regression analysis and permutation-based multiple regression on Bray–Curtis similarity distance matrices show that plant community vegetation composition, species distribution, and soil nutrients are correlated (Table 3). The soil nutrients that most affected plant community distribution and structure are total phosphate, total nitrogen, available phosphate, and available nitrogen (Fig. 7). Phosphorus plays a fundamental role in plant nutrition, and the concentration and availability of P determines to a great extent the soil fertility and site productivity because P is required in relatively large amounts by plants. Oliveira et al. (2015) observed a direct correlation between P and the distribution of plant species in northeastern America. Tsheboeng et al. (2016) reported that P is the main factor that defines plant communities in Botswana, and nutrients in general play a major role in the classification of plant groups. Available P in the soil, which can be absorbed by the plant component, has been shown to play a role in the distribution patterns of plant communities (Satir and Berberoglu, 2016). Total nitrogen also provides nutrients to plants, ensures plant production and development, and plays an important role in the sustainable development of the mountain forest plants (De Jager et al., 2016).
Previous studies have noted that species composition is greatly affected by soil nutrients (De Jager et al., 2016). However, the influence of soil nutrients on the distribution of species in each community requires further analysis (Luan et al., 2012). Specifically, the mechanisms that mediate changes in species composition and diversity in subtropical mountain plant communities need in-depth research on specific niches within the community (soil, topography, microclimate, and other factors) and the physiological and ecological characteristics, as well as ecological adaptability of different species (Idowu et al., 2020). These studies should be gradually conducted while investigating plant communities in northwestern Hubei Province, China. Through long-term observation and basic research, the restoration dynamics of the composition of the plant community and environmental changes in the region may be clarified, thus providing an important theoretical basis for the restoration of the region based on ecosystem functions.
5. ConclusionIn this study, we used systematic quantitative classification methods to classify quadrats of subtropical evergreen-deciduous broadleaved mixed forests in northwestern Hubei based on importance values of species to analyze and compare species structure characteristics and diversity indices for the spatial variance of species composition among different plant community types. We identified biotic and abiotic factors (e.g., topography and soil content) that are correlated with species richness and community structure. We found that these subtropical natural forests can be divided into 12 community types. Species richness, abundance, basal area and importance value of evergreen and deciduous species in each community type were different. The richness of deciduous species in most community types was higher than that of evergreen species. Linear regression analysis indicates that the dominant factors that affect species composition in each community type include elevation, slope, aspect, soil nitrogen content, and soil phosphorus content. Structural equation modeling (SEM) analysis showed that 51% of the variation on species richness can be explained by these environmental factors. Overall, the major factors that affect evergreen and deciduous species distribution across the 12 community types are elevation, slope and aspect, soil total nitrogen content, soil total phosphorus content, soil available nitrogen content and soil available phosphorus content.
Author contributionsLHW, QCY, FL, JLH and ZXW conceived and designed experiments. QCY, HHZ, TTL performed field investigations, analyzed the data, QCY and LHW wrote the manuscript. QCY, LHW, FL, JLH and ZXW revised the manuscript. All authors discussed the results and commented on the manuscript.
Declaration of competing interestThe authors have no commercial or associative interest that represents a conflict of interest in connection with the work submitted.
AcknowledgmentsThis study was supported by grants from the National Natural Science Foundation of China (51809250) and Hubei Provincial Natural Science Foundation for Innovation Groups (No. 2019CFA019). We are grateful to Kai Tian and Binmei Xiong (Hubei University) for providing valuable plant distribution information. We appreciate the help of Yuyang Xu, Bangjun Lin, Ling Li, Ze Li, Rongyou Chen, Wei Xiong, Wenjuan Zhang, Ruyue Ma during fieldwork. We also thank language editor Raymond Porter, peer reviewers and other editor(s) for valuable comments and discussions regarding the manuscript.
Adachi, M., Akihiko, I., Yonemura, S., et al., 2017. Estimation of global soil respiration by accounting for land-use changes derived from remote sensing data. J. Environ. Manag., 200: 97-104. DOI:10.1016/j.jenvman.2017.05.076 |
Ayoubi, S., Moazzeni, D.S., 2020. Identifying impacts of land use change on soil redistribution at different slope positions using magnetic susceptibility. Arab. J. Geosci., 13: 426. DOI:10.1007/s12517-020-05383-x |
Becknell, J.M., Powers, J.S., 2014. Stand age and soils as drivers of plant functional traits and aboveground biomass in secondary tropical dry forest. Can. J. Forest Res., 44: 604-613. DOI:10.1139/cjfr-2013-0331 |
Bekele, T., 1994. Phytosociology and ecology of a humid Afromontane forest on the central plateau of Ethiopia. J. Veg. Sci., 5: 87-98. DOI:10.2307/3235642 |
Chen, L., Tang, L.N., Ren, Y., et al., 2015. Ecological land classification: a quantitative classification and ordination of forest communities adjacent to a rapidly expanding urban area in southeast coastal China. Acta Ecol. Sin., 35: 46-51. |
Chen, Z.M., Xu, Y.H., Zhou, X.H., et al., 2017. Extreme rainfall and snowfall alter responses of soil respiration to nitrogen fertilization: a 3-year field experiment. Global Change Biol., 23: 3403-3417. DOI:10.1111/gcb.13620 |
Chmielewski, T.J., Butler, A., Kułak, A., et al., 2017. Landscape's physiognomic structure: conceptual development and practical applications. Landsc. Res., 43: 410-427. |
Condit, R., 1998. Tropical forest census plots: methods and results from Barro Colorado Island, Panama and a comparison with other plots. SpringerLink, Heidelberg, Berlin, pp. 3-7.
|
De Jager, N.R., Rohweder, J.J., Yin, Y., et al., 2016. The Upper Mississippi River floodscape: spatial patterns of flood inundation and associated plant community distributions. Appl. Veg. Sci., 19: 164-172. DOI:10.1111/avsc.12189 |
Deacon, C., Samways, M.J., Pryke, J.S., 2020. Determining drivers of dragonfly diversity patterns and the implications for conservation in South Africa. Biol. Conserv., 245: 108548. DOI:10.1016/j.biocon.2020.108548 |
Dessalegn, D., Beyene, S., Ram, N., et al., 2014. Effects of topography and land use on soil characteristics along the toposequence of Ele watershed in southern Ethiopia. Catena, 115: 47-54. DOI:10.1016/j.catena.2013.11.007 |
Fan, J.Q., Xu, Y., Ge, H.Y., et al., 2020. Vegetation growth variation in relation to topography in Horqin Sandy Land. Ecol. Indicat., 113: 106215. DOI:10.1016/j.ecolind.2020.106215 |
Gebert, F., Njovu, H.K., Treydte, A.C., et al., 2019. Primary productivity and habitat protection predict elevational species richness and community biomass of large mammals on. Mt. Kilimanjaro. J. Anim. Ecol., 88: 1860-1872. DOI:10.1111/1365-2656.13074 |
Gebrehiwot, K., Woldu, Z., Fekadu, M., et al., 2020. Classification and ordination of plant communities in Abune Yosef mountain range, Ethiopia. Acta Ecol. Sin., 40: 398-411. DOI:10.1016/j.chnaes.2019.12.001 |
Hasselquist, J.N., Metcalfe, B.D., Peter, H., 2012. Contrasting effects of low and high nitrogen additions on soil CO2 flux components and ectomycorrhizal fungal sporocarp production in a boreal forest. Global Change Biol., 18: 3596-3605. DOI:10.1111/gcb.12001 |
Huang, Y.T., Yao, L., Ai, R.X., et al., 2015. Quantitative classification of the subtropical evergreen-deciduous broadleaved mixed forest and the deciduous and evergreen species composition structure across two national nature reserves in the southwest of Hubei, China. Chin. J. Plant Ecol., 39: 990-1002. DOI:10.17521/cjpe.2015.0096 |
Idowu, G.A., Olonimoyo, E.A., Idowu, A.M., et al., 2020. Impact of gas and oil-fired power plants on proximal water and soil environments: case study of Egbin power plant, Ikorodu, Lagos State, Nigeria. SN Appl. Sci., 2: 1352. DOI:10.1007/s42452-020-3150-0 |
Iturrate-Garcia, M., O'brien, M.J., Khitun, O., et al., 2016. Interactive effects between plant functional types and soil factors on tundra species diversity and community composition. Ecol. Evo., 6: 8126-8137. DOI:10.1002/ece3.2548 |
Kersti, R., Bennett, J.A., Kook, E., et al., 2020. Drivers of plant community completeness differ at regional and landscape scales. Agric. Ecosyst. Environ., 301: 107004. DOI:10.1016/j.agee.2020.107004 |
Li, W., Cui, L.J., Sun, B.D., et al., 2017. Distribution patterns of plant communities and their associations with environmental soil factors on the eastern shore of Lake Taihu, China. Ecosyst. Health Sust., 3: 1385004. DOI:10.1080/20964129.2017.1385004 |
Li, W., Cui, L.J., Zhao, X.S., et al., 2010. Spatial distribution of vegetation and soil interpretation in the process of wetland restoration with the type of sand-mining land. Ecol. Environ. Sci., 19: 2325-2331. |
Li, Y., Zu, Y., Wu, B., et al., 2013. Forest diversity and community dynamics along an altitudinal gradient of Ailaoshan mountain (Yuanyang, Yunnan province, China). J. Environ. Eng. Landsc., 21: 96-105. DOI:10.3846/16486897.2012.695735 |
Lian, K.M., Wu, Y.J., Zhang, L., et al., 2015. Numerical classification and ordination of wild Castanea mollissima communities in Taikuan river nature reserve, Shanxi. Chinese J. Ecol., 34: 33-39. |
Liang, W.L., Chan, M.C., 2017. Spatial and temporal variations in the effects of soil depth and topographic wetness index of bedrock topography on subsurface saturation generation in a steep natural forested headwater catchment. J. Hydrol., 546: 405-418. DOI:10.1016/j.jhydrol.2017.01.033 |
Lichstein, J.W., 2007. Multiple regression on distance matrices: a multivariate spatial analysis tool. Plant Ecol., 188: 117-131. DOI:10.1007/s11258-006-9126-3 |
Liu, J., Qiu, L.P., Ao, G.K.L., et al., 2019. Effect of clipping on aboveground biomass and nutrients varies with slope position but not with slope aspect in a hilly semiarid restored grassland. Ecol. Eng., 134: 47-55. DOI:10.1016/j.ecoleng.2019.05.005 |
Luan, J.W., Liu, S.R., Zhu, X.L., et al., 2012. Roles of biotic and abiotic variables in determining spatial variation of soil respiration in secondary oak and planted pine forests. Soil Biol. Biochem., 44: 143-150. DOI:10.1016/j.soilbio.2011.08.012 |
Mellado, A., Zamora, R., 2015. Spatial heterogeneity of a parasitic plant drives the seed-dispersal pattern of a zoochorous plant community in a generalist dispersal system. Funct. Ecol., 30: 459-467. |
Nkosi, E.S., Barrett, S.A., Brown, R.L., 2016. Vegetation ecology of the Nooitgedacht section of Loskop Dam nature reserve, Mpumalanga. South Afr. J. Bot., 105: 79-88. DOI:10.1016/j.sajb.2016.02.199 |
Oliveira, P.C.D., Torezan, J.M.D., Cunha, C.N.D., 2015. Effects of flooding on the spatial distribution of soil seed and spore banks of native grasslands of the Pantanal wetland. Acta Bot. Bras., 29: 400-407. DOI:10.1590/0102-33062015abb0027 |
Oyola-Guzmá, D.R., Oyola-Morales, R., 2018. Implementing a fast, practical, and rational quality control technique at a soil mixture production plant, based on a continuous and quantitative classification of materials: a case study. Case Stud. Construct. Mater. 9, e00199.
|
Pandey, A., Badola, H.K., Rai, S., et al., 2018. Timberline structure and woody taxa regeneration towards treeline along latitudinal gradients in Khangchendzonga National Park, Eastern Himalaya. PLoS ONE. 13, e0207762.
|
Peringer, A., Buttler, A., Gillet, F., et al., 2017. Disturbance-grazer-vegetation interactions maintain habitat diversity in mountain pasture-woodlands. Ecol. Model., 359: 301-310. DOI:10.1016/j.ecolmodel.2017.06.012 |
Phillips, C.L., Bond-Lamberty, B., Desai, A.R., et al., 2017. Erratum to: the value of soil respiration measurements for interpreting and modeling terrestrial carbon cycling. Plant Soil, 413: 27. DOI:10.1007/s11104-016-3136-2 |
Qi, Y.C., Dong, Y.S., Zhao, J., et al., 2010. Spatial heterogeneity of soil nutrients and respiration in the desertified grasslands of Inner Mongolia, China. Pedosphere, 20: 655-665. DOI:10.1016/S1002-0160(10)60055-0 |
Qin, P.Y., Yang, H.J., Jiang, F.L., et al., 2016. Quantitative classification of natural plant communities in the Saihanba national nature reserve, Hebei province, China. J Appl. Eco., 27: 1383-1392. |
Rodrigues, P.M.S., Schaefer, C.E.G.R., Silva, J.D.O., et al., 2016. The influence of soil on vegetation structure and plant diversity in different tropical savannic and forest habitats. J. Plant Ecol., 2: 226-236. DOI:10.26694/pensando.v8i15.4723 |
Sarquis, A., Pestoni, S., Cingolani, A.M., et al., 2019. Physiognomic changes in response to herbivory increase carbon allocation to roots in a temperate grassland of central Argentina. Plant Ecol., 220: 699-709. DOI:10.1007/s11258-019-00945-w |
Satir, O., Berberoglu, S., 2016. Crop yield prediction under soil salinity using satellite derived vegetation indices. Field Crop. Res., 192: 134-143. DOI:10.1016/j.fcr.2016.04.028 |
Song, Y.C., 2004. Tentative classification scheme of evergreen broad-leaved forests of China. Chin. J. Plant Ecol., 28: 435-448. DOI:10.17521/cjpe.2004.0061 |
Sun, J., Li X.Z., Wang, X.W., et al., 2009. Latitudinal changes in species diversity of permafrost wetland plant communities in Great Xing'an Mountain valleys of Northeast China. Acta Ecol. Sin., 29: 272-277. DOI:10.1016/j.chnaes.2009.09.003 |
Tajik, S., Ayoubi, S., Lorenz, N., 2020. Soil microbial communities affected by vegetation, topography and soil properties in a forest ecosystem. Appl. Soil Ecol., 149: 103514. DOI:10.1016/j.apsoil.2020.103514 |
Tian, K., Wang, Z.X., Lei, Y., et al., 2017. Comparison of fish community structure and biodiversity among six nature reserves in northwest Hubei, China. Resour. Environ. Yangtze Basin., 3: 384-393. |
Toriyama, J., Hak, M., Imaya, A., et al., 2015. Effects of forest type and environmental factors on the soil organic carbon pool and its density fractions in a seasonally dry tropical forest. For. Ecol. Manag., 335: 147-155. DOI:10.1016/j.foreco.2014.09.037 |
Townsend, A.R., Asner, G.P., Cleveland, C.C., 2008. The biogeochemical heterogeneity of tropical forests. Trends Ecol. Evol., 23: 424-431. DOI:10.1016/j.tree.2008.04.009 |
Tsheboeng, G., Murray-Hudson, M., Kashe, K., et al., 2016. A baseline classification of riparian woodland plant communities in the Okavango Delta, Botswana. South. For.: a J. For. Sci., 78: 97-104. DOI:10.2989/20702620.2015.1108619 |
Wang, X.L., Yu, S.Q., Zhou, L.X., et al., 2016. Soil microbial characteristics and the influencing factors in subtropical forests. Acta Ecol. Sin., 36: 8-15. DOI:10.1016/j.chnaes.2015.12.004 |
Yang, Q.C., Li, T.T., Wang, Z.X., et al., 2017. Integrated assessment on ecological sensitivity for Shennongjia national park. J. Hubei Univ. (Nat. Sci.)., 39: 455-461. |
Yang, Q.C., Li, T.T., Wang, Z.X., et al., 2019. Spatial scale analysis of the species diversity and distribution of rare and endangered plants in northwest Hubei, China. Plant Sci. J., 37: 464-473. |
Yao, Y.F., Shao, M.G., Fu, X.L., et al., 2019. Effect of grassland afforestation on soil N mineralization and its response to soil texture and slope position. Agric. Ecosyst. Environ., 276: 64-72. DOI:10.1016/j.agee.2019.02.017 |
Yun, J., Zhang, B.W., Wang, W.T., et al., 2020. Topography and plant community structure contribute to spatial heterogeneity of soil respiration in a subtropical forest. Sci. Total Environ., 733: 139287. DOI:10.1016/j.scitotenv.2020.139287 |
Zellweger, F., Braunisch, V., Morsdorf, F., et al., 2015. Disentangling the effects of climate, topography, soil and vegetation on stand-scale species richness in temperate forests. For. Ecol. Manag., 349: 36-44. DOI:10.1016/j.foreco.2015.04.008 |
Zeng, Y., Zhao, C.Y., Kundzewicz, Z.W., et al., Distribution pattern of Tugai forests species diversity and their relationship to environmental factors in an arid area of China. PLoS One: e0232907. DOI:10.1371/journal.pone.0232907 |
Zerihun, W., Backéus, I., 1991. The shrubland vegetation in western Shewa, Ethiopia and its possible recovery. J. Veg. Sci., 2: 173-180. DOI:10.2307/3235949 |
Zhang, X.N., Yang, X.D., Li, Y., et al., 2018. Influence of edaphic factors on plant distribution and diversity in the arid area of Xinjiang, Northwest China. Arid Land Res. Manag., 32: 38-56. DOI:10.1080/15324982.2017.1376004 |
Zheng, J.G., Chen, Y.W., Wu, G.X., 2013. Association of vegetation patterns and environmental factors on the arid western slopes of the Helan Mountains, China. Mt. Res. Dev., 33: 323-331. DOI:10.1659/MRD-JOURNAL-D-12-00088.1 |


