b. Yunnan Key Laboratory for Integrative Conservation of Plant Species with Extremely Small Populations, Kunming, 650204, China;
c. CAS Key Laboratory for Plant Diversity and Biogeography of East Asia, Kunming Institute of Botany, Chinese Academy of Sciences, Kunming, 650204, China;
d. Chemodiversity Research Group, Division of Systematic and Evolutionary Botany, University of Vienna, Rennweg 14, A-1030, Vienna, Austria
The species Hibiscus aridicola is a shrub member of Malvaceae and is an endemic species in the dry-hot valleys of Jinsha River (upper reaches of the Yangtze River) in southwest China (Feng, 1979; Feng et al., 1984; Jin, 1999; Tang et al., 2007). This species, which has large flowers varying from white to whitish purple, is also cultivated for ornamental purposes (Li et al., 2003). The type material was collected near Shangri-La, Yunnan Province, China and, according to the Flora of China and Flora of Yunnan, in the past H. aridicola was widely distributed along the valleys of Jinsha River at elevations between 1300 and 2100 m a.s.l. Currently, however, H. aridicola can be found at fewer than five locations and the area of occupancy continues to decline, which, in accordance with EN B2ab (ii) of the IUCN Red List Categories and Criteria, has led to its classification as endangered and its placement in 2004 on the China Species Red List (Wang and Xie, 2004). This species is a typical plant species with extremely small populations (PSESP) (Ma et al., 2013). Our preliminary investigations into H. aridicola indicate that populations of this species are severely threatened, possibly due to human activities such as cutting for firewood, reclaiming farmland, and constructing hydropower stations. As a consequence, the distribution H. aridicola is highly fragmented, and the survival of the species requires both in situ and ex situ conservation. To propose effective solutions for the long-term in situ and ex situ conservation of H. aridicola, it is urgent to elucidate the genetic background of this species.
The genetic diversity of endangered species has been elucidated previously through the use of molecular markers, particularly microsatellites (Chen et al., 2009; Tang et al., 2008; Wang et al., 2006; Yang et al., 2018; Zhao and Gong, 2015). These markers are abundant, uniformly distributed, and show a high degree of polymorphism and codominance. Furthermore, these markers are easily amplified by PCR, produce results that are relatively simple to interpret, and can be easily accessed by other laboratories via published primer sequences (Jarne and Lagoda, 1996; Maroof et al., 1994). In addition, they can give informative results even with a small sample size (Habel et al., 2010).
The aim of this study was to elucidate the genetic background of H. aridicola, a plant species with extremely small populations. For this purpose, we used 11 microsatellite markers to examine the population structure and genetic diversity of the four remaining populations of H. aridicola. Based on our findings, we propose specific strategies for conserving this species.
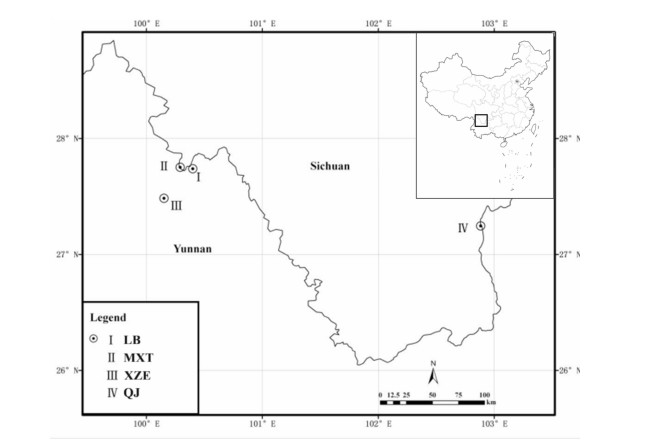
2. Materials and methods 2.1. Plant collectionH. aridicola samples were collected in the dry-hot valleys of Jinsha River in the provinces Yunnan and Sichuan, China between September 2007 and December 2011. In total, 69 individuals were collected from four populations: Labo Town (LB), Muxintu Village (MXT), Jinyang County (QJ), and Xiazhien Village (XZE) (for details, see Fig. 1 and Table 1). Firstly, around 20 individuals were collected from each population, with a distance of 10 m between each sample. The collected leaves were dried using silica gel. Two voucher specimens were collected for each population and deposited in the herbarium (KUN) of Kunming Institute of Botany, Chinese Academy of Sciences.
|
| Fig. 1 Geographical distribution of H. aridicola along the Jinsha River in Southwest China. |
| Population | Location | Altitude/longitude of location | Elevation (m) |
| LB | Tuodian Village, Labo Town, | N 27°440'20" | 1645-1749 |
| Ninglang County, Yunnan | E 100°24'01" | ||
| MXT | Muxintu Village, Luoji Town, | N 27°45'06" | 1420-2180 |
| Shangri-la County, Yunnan Province | E 100°17'32" | ||
| XZE | Xiazhien Village, Sanba Town | N 27°29'03" | 1770-1920 |
| Shangri-la County, Yunnan Province | E 100°09'06" | ||
| QJ | Jinyang County, | N 27°14'45" | 710-835 |
| Sichuan Province | E 102°52'59" |
The genomic DNA was extracted from approximately 5 g of dried leaves of each collected sample using the modified CTAB method (Doyle and Doyle, 1987). Zhang et al. (2011a) successfully isolated 15 suitable microsatellite loci for H. aridicola that showed polymorphisms of two to six alleles per locus. In the current study, we used 11 of these loci; relevant primer pairs were synthesized by Sangon Company (Shanghai). PCR was performed according to the method described by Zhang et al. (2011a) and the PCR products were separated on 8% denaturing polyacrylamide gels and visualized by silver staining with a 100 bp extended DNA ladder (Fermentas) as a size standard.
2.3. Data analysisTo estimate bias in the SSR markers, we tested Hardy-Weinberg equilibrium (HWE) and Hardy-Weinberg linkage disequilibrium (HWLD) by inputting data into GENEPOP 4.0 (Raymond and Rousset, 1995; Rousset, 2008). POPGENE V. 1.32 (Yeh et al., 1999) was used to calculate the following parameters at the population and species level: population averages of sample sizes (N), observed number of alleles (Na), effective number of alleles (Ne), Shannon's information index (I), expected (He) and observed (Ho) frequency of heterozygotes, percentage of polymorphic loci (PPB), and the Nei's (1973) expected heterozygosity (H). Nei's genetic identities and distances were also calculated among populations.
To examine the similarity of the populations included and to assess the correlation between genetic distance and geographic distance, principal coordinates analysis (PCoA) and the Mantel test were conducted using GenAlEx V. 6.0 (Peakall and Smouse, 2006). The geographic distances were transferred from the longitude and latitude data of the populations using Geographic Distance Matrix Generator V. 1.2.3 (Ersts, 2018). Hierarchical analyses of molecular variance (AMOVAs) were performed to assess the genetic structure within and between population genetic groups identified using ARLEQUIN V. 3.5.1.3 (Excoffier et al., 2005), and significance tests were performed on basis of 10, 000 permutations. Neighbor-Joining (NJ) analysis was conducted in PHYLIP V. 3.67 with the Nei's distances calculated in MICROSATELLITE ANALYSER 4.05. Tests for recent bottlenecks were performed using the software BOTTLENECK V. 1.2.02. The stepwise mutation model (SMM) and two-phase model (TPM) were selected and both the sign test and the Wilcoxon sign-rank test were conducted for 1000 iterations. The Bayesian assignment test was conducted in STRUCTURE V. 2.2 to determine the number of genetic groups (Pritchard et al., 2000) using the admixture model and assumed correlated allele frequencies for 10, 000 iterations, following a burn-in of 10, 000 iterations. To quantify the variation of the likelihood for each K (number of groups assigned to the populations), ten runs each were performed for K varying from one to nine (number of populations plus five). The best value of K for the data set was determined based on the estimated posterior log probability of the data, L(K), and the rate of change in probability (ΔK) between successive K values, following the work of Evanno et al. (2005). Graphics were drawn with DISTRUCT 1.1 (Rosenberg, 2004).
3. Results 3.1. Hardy-Weinberg equilibrium and linkage disequilibrium testsAmong the 44 combinations for the four populations and eleven microsatellite loci, only five failed to deviate from Hardy-Weinberg equilibrium (11.36% of the total), seven deviated (15.91% of the total, P < 0.05), six deviated significantly (13.64% of the total, P < 0.01), 26 deviated highly significantly (59.09% of the total, P < 0.001). Overall, 88.64% of the all combinations deviated from Hardy-Weinberg equilibrium (Table 2). Additionally, we found evidence of linkage disequilibrium between loci HA3 and HA4. The loci HA3 and HA13 showed highly significant P values (P < 0.001) after Bonferroni correction, therefore all further analyses were conducted without locus HA3, due to linkage disequilibrium (Table 3).
| LB | MXT | QJ | XZE | |
| HA-1 | 0 | 0 | 0 | 0 |
| HA-3 | 0.0045 | 0.045 | 0 | 0.0122 |
| HA-4 | 0.014 | 0.0009 | 0.0356 | 0.1295 |
| HA-5 | 0 | 0 | 0 | 0 |
| HA-6 | 0.0051 | 0 | 0 | 0.0287 |
| HA-7 | 0.1609 | 0.0003 | 0 | 0.0004 |
| HA-8 | 0 | 0.0004 | 0 | 0 |
| HA-9 | 0.0352 | 0.0555 | 0.0082 | 0 |
| HA-10 | 0.0002 | 0.022 | 0 | 0 |
| HA-13 | 0.0907 | 0.8387 | 0 | 0.0041 |
| HA-14 | 0.0003 | 0.0023 | 0.0061 | 0 |
| HA-1 | HA-3 | HA-4 | HA-5 | HA-6 | HA-7 | HA-8 | HA-9 | HA-10 | HA-13 | HA-14 | |
| HA-1 | |||||||||||
| HA-3 | 3.7854 | ||||||||||
| HA-4 | 3.2907 | Infinity** | |||||||||
| HA-5 | 6.9134 | 7.8803 | 3.3162 | ||||||||
| HA-6 | 1.9991 | 8.899 | 2.1217 | 2.0243 | |||||||
| HA-7 | 7.5805 | 3.4199 | 5.6183 | 13.0193 | 1.9646 | ||||||
| HA-8 | 12.1415 | 22.6385 | 15.8588 | 3.5358 | 2.3222 | 17.6733 | |||||
| HA-9 | 7.4187 | 4.8007 | 3.9194 | 4.3736 | 3.9748 | 3.1536 | 3.1104 | ||||
| HA-10 | 2.4377 | 11.1916 | 1.3975 | 7.1923 | 4.0474 | 11.4523 | 8.9064 | 1.9175 | |||
| HA-13 | 2.3706 | Infinity** | 9.408 | 0.6771 | 0.3201 | 7.769 | 15.0671 | 5.6453 | 8.3469 | ||
| HA-14 | 8.2961 | 0.9078 | 5.5292 | 1.7926 | 1.4751 | 3.0709 | 6.3767 | 0.8349 | 5.4327 | 5.1801 | |
| **p < 0.001. | |||||||||||
The related parameters of genetic diversity were calculated and summarized in Tables 4 and 5. Briefly, at both the population and species level, the percentage of polymorphic loci (PPB) was 100%. The number of different alleles (Na) and effective alleles (Ne) varied from 5.8 (MXT) to 7.0 (QJ), 3.7325 (XZE) to 4.3000 (QJ) at the population level, 9.9 and 5.7401 at the species level, respectively. The average Shannon's Information Index ( I), Observed Heterozygosity (Ho), Expected Heterozygosity (He) and Nei's (1973) expected heterozygosity (H) at the species level are 1.8381, 0.3580, 0.7894 and 0.7837, respectively and the LB population from Shangri-La, Yunnan Province showed the highest genetic diversity (I = 1.5198 and H = 0.7293), followed in descending order by the QJ, XZE and MXT populations. The value of the ratio of gene diversities of heterozygosities (Fst) and the gene flow (Nm) at the species level are 0.0971 and 2.3236, respectively.
| Populations | N | Na | Ne | I | Ho | He | H | PPB |
| LB | 32 | 6.2 | 4.2207 | 1.5198 | 0.4375 | 0.7528 | 0.7293 | 100% |
| MXT | 24 | 5.8 | 4.0034 | 1.4551 | 0.3583 | 0.7373 | 0.7066 | 100% |
| QJ | 48 | 7 | 4.3 | 1.5177 | 0.35 | 0.7148 | 0.6999 | 100% |
| XZE | 34 | 6.6 | 3.7325 | 1.4642 | 0.2941 | 0.7173 | 0.6962 | 100% |
| Total | 138 | 9.9 | 5.7401 | 1.8381 | 0.358 | 0.7894 | 0.7837 | 100% |
| Locus | Sample Size | Fis | Fit | Fst | Nm |
| HA1 | 138 | 0.842 | 0.8683 | 0.1668 | 1.249 |
| HA4 | 138 | 0.1714 | 0.2463 | 0.0904 | 2.5168 |
| HA5 | 138 | 0.6309 | 0.6668 | 0.0972 | 2.3224 |
| HA6 | 138 | 0.3927 | 0.4353 | 0.0702 | 3.3129 |
| HA7 | 138 | 0.5077 | 0.5755 | 0.1378 | 1.5646 |
| HA8 | 138 | 1 | 1 | 0.0301 | 8.0661 |
| HA9 | 138 | 0.3762 | 0.4254 | 0.0788 | 2.9228 |
| HA10 | 138 | 0.6358 | 0.6923 | 0.1552 | 1.3612 |
| HA13 | 138 | 0.1879 | 0.2552 | 0.0828 | 2.7676 |
| HA14 | 138 | 0.4492 | 0.4804 | 0.0566 | 4.1644 |
| Mean | 138 | 0.4907 | 0.5402 | 0.0971 | 2.3236 |
The AMOVA results (Table 6) indicate that only 3.03% of the total variance occurs among groups and 7.61% among populations within groups, whereas the remaining 89.35% of variation occurs within populations.
| Source of variation | d.f. | Σ of Squares | Variance components | variation [%] |
| Among groups | 2 | 39.059 | 0.12353 | 3.03 |
| Among populations within groups | 1 | 13.869 | 0.31023 | 7.61 |
| within populations | 134 | 487.811 | 3.64038 | 89.35 |
| Total | 137 | 540.739 | 4.07414 |
In the two-phase model, two populations of H. aridicola showed heterozygosity excess: the LB population (sign test: P = 0.04417; Wilcoxon test: P = 0.00684) and the MXT population (Wilcoxon test: P = 0.01221) (Table 7).
| Population | N | Sign test | Wilcoxon test P-value | ||||||
| TPM | SMM | TPM | SMM | ||||||
| No. of loci with heterozygosity excess | P-value | No. of loci with heterozygosity excess | P-value | ||||||
| LB | 16 | 5.96 | 0.04417 | 5.94 | 0.36629 | 0.00684 | 0.2158 | ||
| MXT | 12 | 5.82 | 0.13856 | 5.9 | 0.60859 | 0.01221 | 0.3125 | ||
| QJ | 24 | 5.77 | 0.32562 | 5.76 | 0.07447 | 0.1377 | 0.8125 | ||
| XZE | 17 | 5.86 | 0.59776 | 5.86 | 0.40323 | 0.34766 | 0.8623 | ||
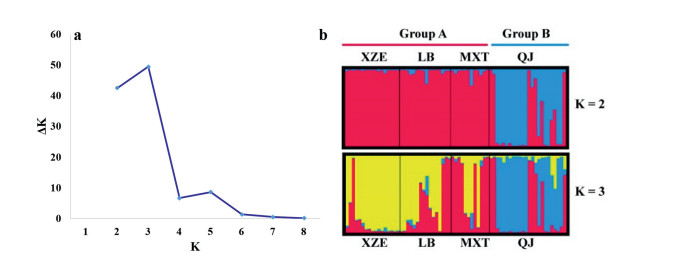
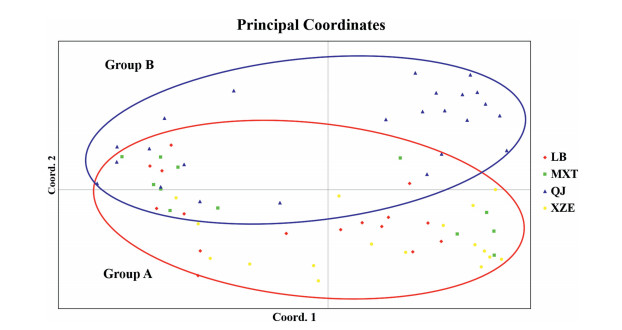
Genetic distance between the QJ and XZE populations was the longest (0.5491), followed by those between the LB and QJ, XZE and MXT, LB and MXT, LB and XZE populations (Table 8). When we quantified the number of clusters of individuals, we found that the maximum value of ΔK was reached when K was 3, and the second maximum was reached when K was 2 (Fig. 2a). The assignment of sampled individuals improved when they were assigned to two groups rather than to three groups (Fig. 2b). This is because one of the three groups would consist of LB and MXT populations; however, due to high levels of gene introgression between these two populations, they cannot be separated distinctly from another possible group (XZE) (Fig. 2b). Principle coordinate analysis showed that the first three principle coordinates explained 65.57% genetic variation, and the 1st coordinate (27.05%) explained similar genetic variation with the 2nd coordinate (23.14%). Both on the 1st and 2nd coordinates, H. aridicola individuals can be subdivided into two major groups, and the two groups divided on 2nd coordinate are similar to the following NJ analysis with one group (Group A) consisting of the LB, MXT, XZE populations and the other group (Group B) including only the QJ population (Fig. 3).
| pop ID | LB | MXT | QJ | XZE |
| LB | **** | 0.7224 | 0.6657 | 0.7367 |
| MXT | 0.3252 | **** | 0.7037 | 0.6698 |
| QJ | 0.407 | 0.3514 | **** | 0.5775 |
| XZE | 0.3056 | 0.4008 | 0.5491 | **** |
| Asterisks means no values for the corresponding cells. | ||||
|
| Fig. 2 Genetic structure of H. aridicola inferred by Bayesian clustering of SSR data. a: the best and the second-best grouping number was 3 and 2 (K = 3 and 2) based on the DK estimation. b: Assignment of 69 individuals into K = 2 and K = 3 genetically distinguishable groups. Each individual is represented by a vertical bar, colored according to the assigned group(s). |
|
| Fig. 3 Principal Coordinates Analysis of sampled individuals of H. aridicola. The first and second axes explained 27.05% and 23.14% of the genetic similarities among populations, respectively. |
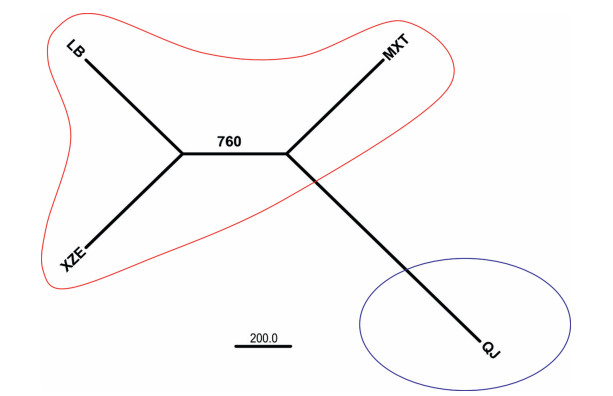
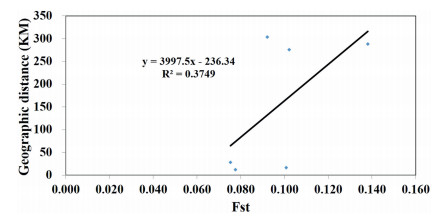
Neighbor-Joining (NJ) analysis indicated that the populations LB and XZE are the most closely related, followed by MXT and QJ (Fig. 4), and population genetic diversity are positively correlated to geographic distance (R2 = 0.3749, Fig. 5).
|
| Fig. 4 Unrooted neighbor-joining dendrogram illustrating the genetic relationship among the four populations of H. aridicola. |
|
| Fig. 5 Relationships inferred using the ratio of gene diversities of heterozygosities (Fst) and the geographical distances (Mantel test). |
In this study, we used 11 microsatellite loci to investigate the population structure and genetic diversity of four populations of H. aridicola along the Jinsha River in Yunnan and Sichuan Provinces in southwest China. We found that most combinations of loci and populations deviated from Hardy-Weinberg equilibrium. We also found that two of the four H. aridicola populations we examined have undergone genetic bottlenecks. Deviations from Hardy-Weinberg equilibrium may be the result of sampling small populations and heterozygote deficiencies in population bottlenecks. Hardy-Weinberg equilibrium tests are more reliable when the number of individuals in each population is above 50 (Peakall and Smouse, 2006); however, H. aridicola is a plant species with an extremely small populations and all current populations are below 50 individuals. In addition, genetic bottlenecks further reduce heterozygosity (Wang et al., 1998; Crow and Kimura, 1970).
Hardy-Weinberg disequilibrium between populations of H. aridicola may indicate physical linkage among loci, recent species-wide reductions in effective population size, effects of geographical structure, or selection. Over the last decade, human activities have caused rapid reductions in population sizes of H. aridicola, which in previous years were widely distributed along the Jinsha River. In addition, the geographic complexity in this area (Hoang et al., 2009) resulted in the unique geographical structure of H. aridicola. Similar geographical structures in populations of Terminalia franchetii (Zhang and Sun, 2011; Zhang et al., 2011b), Buddleja crispa (Zhang et al., 2015; Yue et al., 2012), and Osteomeles schwerinae (Wang et al., 2015) have also led to changes in population genetic diversity and structure.
4.2. Genetic diversity of H. aridicolaUnderstanding genetic diversity and differentiation within and among existing populations is a significant component of developing effective conservation strategies (Rivers et al., 2011). Our population genetic analyses indicate that genetic diversity for H. aridicola is high at both the population (0.6962-0.7293) and species level (0.7837) compared to those of endemic/endangered species in China, e.g., Abies ziyuanensis (He = 0.435) (Tang et al., 2008), Cycas hongheensis (He = 0.453) (Zhao and Gong, 2015), Houpoea officinali (He = 0.600) (Yang et al., 2018), Psathyrostachys huashanica (He = 0.3504) (Wang et al., 2006), Rheum tanguticum (He = 0.515) (Chen et al., 2009). Furthermore, the genetic diversity of H. aridicola is also higher than that of the reported average value of genetic diversity for endemic species (He = 0.42) (Nybom, 2004). These findings suggest that H. aridicola is relatively well-adapted to a variety of habitats within the hot and dry valleys of the Jinsha River. Our results also show that the decline in the number of H. aridicola populations is not the result of a decrease in population genetic diversity. Taken together, these findings suggest that declines in population numbers may be caused by human activities. Specifically, frequent human activity may have decreased the number of H. aridicola populations severely over the last several decades, thus increasing the risk of extinction for this species.
Our population genetic analyses also show that gene flow is frequent among the current populations (Nm = 2.3236). This frequent gene flow between populations may be due to the special distribution pattern of H. aridicola, in which the individuals grow along a river and its seeds are dispersed by wind in hot-dry valleys. This is similar to B. crispa (Zhang et al., 2015), a plant species distributed in the same area.
4.3. Genetic differentiation and structure of H. aridicolaWe also found that variation among the H. aridicola populations is low, and the majority of variation exists within populations. This is also indicated by the low ratio of gene diversities of heterozygosities (Fst = 0.0971). Previous studies reported that high genetic variation within populations may be caused by environmental heterogeneity (Ewing, 1979; Gillespie and Turelli, 1989; Yeaman and Jarvis, 2006). Thus, variable habitats in the dry and hot valleys might promote accumulation and accommodation of new mutations in H. aridicola, enabling this species to adapt to different habitats. The current population genetic structure of H. aridicola (Figs. 2-4) could be caused by the geographic distances between the remaining populations.
4.4. Conservation of H. aridicolaTaken together, our findings show that populations of H. aridicola have maintained high genetic diversity, low genetic differentiation and strong gene flow. However, we also found that two populations (LB and MXT) have undergone a genetic bottleneck, even though they have the highest genetic diversity. Therefore, in situ conservation efforts should focus on the LB and MXT populations; otherwise, the genetic bottleneck, which is known to lead to smaller population sizes, may decrease their ability to continue adapting to changes in the environment (Nei et al., 1975). Consequently, these populations may become extinct due to, among other factors, strong negative selective pressures such as human activities, inbreeding depression, and natural hazards.
Ex situ conservation efforts should focus on two populations, the isolated QJ population in Sichuan Province and the LB population in Yunnan Province. Because these populations have high genetic diversity, ex situ conservation would maintain gene flow among distinct populations and enrich the genetic pool of H. aridicola.
In conclusion, H. ardicola has high genetic diversity at both the population and species level, but low differentiation among populations. The distribution of H. ardicola along the Jinsha River and wind-mediated dispersal of its seeds may contribute strongly to the current genetic structure of H. ardicola populations. Finally, two populations in Yunnan Provincedthe LB population in Ninglang County and the MXT population in Shangri-La Countydhave undergone a genetic bottleneck and require more attention from conservationists.
Conflicts of interestThe authors declare that there are no conflicts of interest.
AcknowledgmentsWe are grateful to Gang Wu for his valuable comments on an earlier version of the manuscript. Support for this study was provided through grants from the NSFC (National Natural Science Foundation of China)-Yunnan Joint Funds to support key projects (Grant No. U1302262, No. U1602264), Yunnan Science and Technology Innovation Team Program for PSESP (Plant Species with Extremely Small Populations) Conservation and Utilization (Grant No. 2019HC015), and the Young Academic and Technical Leader Raising Foundation of Yunnan Province (Grant No. 2015HB091).
Chen F., Wang A., Chen K., Wan D., Liu J., 2009. Genetic diversity and population structure of the endangered and medically important Rheum tanguticum (Polygonaceae) revealed by SSR markers. Biochem. Syst. Ecol, 37: 613-621. DOI:10.1016/j.bse.2009.08.004 |
Crow, J.F., Kimura, M., 1970. An Introduction to Population Genetics Theory. Harper & Row, New York.
|
Doyle J.J., Doyle J.L., 1987. A rapid DNA isolation procedure for small quantities of fresh leaf tissue. Phytochem. Bull, 19: 11-15. |
Ersts, P.J., 2018. Geographic Distance Matrix Generator(version 1.2.3). Museum of Natural History, Center for Biodiversity and Conservation. Available from: http://biodiversityinformatics.amnh.org/open_source/gdmgAmerican.
|
Evanno G., Regnaut S., Goudet J., 2005. Detecting the number of clusters of individuals using the software STRUCTURE:a simulation study. Mol. Ecol, 14: 2611-2620. DOI:10.1111/j.1365-294X.2005.02553.x |
Ewing E.P., 1979. Genetic variation in a heterogeneous environment Ⅶ. Temporal and spatial heterogeneity in infinite populations.. Am. Nat, 114: 197-212. DOI:10.1086/283468 |
Excoffier L., Laval G., Schneider S., 2005. Arlequin (version 3. 0):an integrated software package for population genetics data analysis. Evol. Bioinform, 1: 47-50. |
Feng, K.M., 1979. Flora of Yunnan, vol. 2. Science Press, Beijing.
|
Feng, K.M., Li, H., Hsue, H.H., Chang, H.T., Liang, C.F., Wei, C.F., 1984. Malvaceae, Bombacaceae, Sterculiaceae, Dilleniaceae, Actinidiaceae, Ochnaceae. In: EBoFo, China (Ed.), Flora of China (Chinese Version), vol. 49 (2). Science Press, Beijing.
|
Gillespie J.H., Turelli M., 1989. Genotype-environment interactions and the maintenance of polygenic variation. Genetics, 121: 129-138. |
Habel J.C., Schmitt T., Meyer M., Finger A., Rödder D., Assmann T., Zachos F.E., 2010. Biogeography meets conservation:the genetic structure of the endangered lycaenid butterfly Lycaena helle (Denis Schiffermüller 1775). Biol. J. Linn. Soc, 101: 155-168. DOI:10.1111/j.1095-8312.2010.01471.x |
Hoang L.V., Wu F.Y., Clift P.D., Wysocka A., Swierczewska A., 2009. Evaluating the evolution of the Red River system based on in situ U-Pb dating and Hf isotope analysis of zircons. Geochem. Geophys. Geosyst, 10: Q11008. |
Jarne P., Lagoda P.J.L., 1996. Microsatellites, from molecules to populations and back. Trends Ecol. Evol, 11: 424-429. DOI:10.1016/0169-5347(96)10049-5 |
Jin Z.Z., 1999. The floristic study on seed plants in the dry-hot valleys in Yunnan and Sichuan. Guihaia, 19: 1-14. |
Li X.X., Chen W.Y., Guan K.Y., Zhou Z.K., 2003. A report on the wild ornamental plants from northwest Yunnan. Acta Bot. Yunnanica, 25: 435-446. |
Ma Y.P., Chen G., Grumbine R.E., Dao Z.L., Sun W.B., Guo H.J., 2013. Conserving plant species with extremely small populations (PSESP) in China. Biodivers. Conserv, 22: 803-809. DOI:10.1007/s10531-013-0434-3 |
Maroof Saghai M.A., Biyashev R.M., Yang G.P., Zhang Q., Allard R.W., 1994. Extraordinarily polymorphic microsatellite DNA in barley:species diversity, chromosomal locations, and population dynamics. Proc. Nat. Acad. Sci. U. S. A, 91: 5466-5470. DOI:10.1073/pnas.91.12.5466 |
Nei M., 1973. Analysis of gene diversity in subdivided populations. Proc. Nat. Acad. Sci. U. S. A, 70: 3321-3323. DOI:10.1073/pnas.70.12.3321 |
Nei M., Maruyama T., Chakraborty R., 1975. The bottleneck effect and genetic variability in populations. Evolution, 29: 1-10. DOI:10.1111/j.1558-5646.1975.tb00807.x |
Nybom H., 2004. Comparison of different nuclear DNA markers for estimating intraspecific genetic diversity in plants. Mol. Ecol, 13: 1143-1155. DOI:10.1111/j.1365-294X.2004.02141.x |
Peakall R., Smouse P.E., 2006. GENALEX 6:genetic analysis in Excel. Population genetic software for teaching and research. Mol. Ecol. Notes, 6: 288-295. DOI:10.1111/j.1471-8286.2005.01155.x |
Pritchard J.K., Stephens M., Donnelly P., 2000. Inference of population structure using multilocus genotype data. Genetics, 155: 945-959. |
Raymond M., Rousset F., 1995. GENEPOP (version 1. 2):population genetics software for exact tests and ecumenicism. J. Hered, 86: 248-249. DOI:10.1093/oxfordjournals.jhered.a111573 |
Rivers M.C., Brummitt N.A., Lughadha E.N., Meagher T.R., 2011. Genetic variation in Delonix s. l. (Leguminosae) in Madagascar revealed by AFLPs:fragmentation, conservation status and taxonomy. Conserv. Genet, 12: 1333-1344. DOI:10.1007/s10592-011-0234-9 |
Rosenberg N.A., 2004. Distruct:a program for the graphical display of population structure. Mol. Ecol. Resour, 4: 137-138. |
Rousset F., 2008. Genepop'007:a complete re-implementation of the genepop software for Windows and Linux. Mol. Ecol. Resour, 8: 103-106. DOI:10.1111/j.1471-8286.2007.01931.x |
Tang S., Dai W., Li M., Zhang Y., Geng Y., Wang L., Zhong Y., 2008. Genetic diversity of relictual and endangered plant Abies ziyuanensis (Pinaceae) revealed by AFLP and SSR markers. Genetica, 133: 21-30. DOI:10.1007/s10709-007-9178-x |
Tang, Y., Michael, G.G., Laurence, J.D., 2007. Malvaceae. In: Wu, Z.Y., Raven, P.H., Hong, D.Y. (Eds.), Flora of China, vol. 12. Science Press, Beijing.
|
Wang J., Caballero A., Hill W.G., 1998. The effect of linkage disequilibrium and deviation from HardyeWeinberg proportions on the changes in genetic variance with bottlenecking. Heredity, 81: 174-186. DOI:10.1046/j.1365-2540.1998.00390.x |
Wang L., Guo J., Zhao G.F., 2006. Genetic diversity of the endangered and endemic species Psathyrostachys huashanica natural populations using simple sequence repeats (SSRs) markers. Biochem. Syst. Ecol, 34: 310-318. DOI:10.1016/j.bse.2005.09.009 |
Wang, S., Xie, Y., 2004. China Species Red List 1. Higher Education Press, Beijing.
|
Wang Z.W., Chen S.T., Nie Z.L., Zhang J.W., Zhou Z., Deng T., Sun H., 2015. Climatic factors drive population divergence and demography:Insights based on the phylogeography of a riparian plant species endemic to the Hengduan mountains and adjacent regions. PLoS One, 10: e0145014. DOI:10.1371/journal.pone.0145014 |
Yang X., Yang Z., Li H., 2018. Genetic diversity, population genetic structure and protection strategies for Houpoëa officinalis (Magnoliaceae) an endangered Chinese Medical Plant. J. Plant Biol, 61: 159-168. DOI:10.1007/s12374-017-0373-8 |
Yeaman S., Jarvis A., 2006. Regional heterogeneity and gene flow maintain variance in a quantitative trait within populations of lodgepole pine. Proc. R. Soc. Lond, 273: 1587-1593. DOI:10.1098/rspb.2006.3498 |
Yeh, F., Yang, R.C., Boyle, T., 1999. PopGene Version 131: Microsoft Window-Based Freeware for Population Genetic Analysis. University of Alberta and Centre for International Forestry Research, pp. 11-23.
|
Yue L.L., Chen G., Sun W.B., Sun H., 2012. Phylogeography of Buddleja crispa(Buddlejaceae) and its correlation with drainage system evolution in southwestern China. Am. J. Bot, 99: 1726-1735. DOI:10.3732/ajb.1100506 |
Zhang L., Sun W.B., Wang Z.L., Guan K.Y., Yang J.B., 2011a. Isolation and characterization of microsatellite loci for Hibiscus aridicola (Malvaceae), an endangered plant endemic to the dry-hot valleys of Jinsha River in Southwest China. Int. J. Mol. Sci, 12: 5698-5704. DOI:10.3390/ijms12095698 |
Zhang T.C., Comes H.P., Sun H., 2011b. Chloroplast phylogeography of Terminalia franchetii (Combretaceae) from the eastern Sino-Himalayan region and its correlation with historical river capture events. Mol. Phylogenet. Evol, 60: 1-12. DOI:10.1016/j.ympev.2011.04.009 |
Zhang T.C., Sun H., 2011. Phylogeographic structure of Terminalia franchetii (Combretaceae) in southwest China and its implications for drainage geological history. J. Plant Res, 124: 63-73. DOI:10.1007/s10265-010-0360-3 |
Zhang X., Chen G., Ma Y.P., Ge J., Sun W.B., 2015. Genetic diversity and population structure of Buddleja crispa Bentham in the Himalaya-Hengduan mountains region revealed by AFLP. Biochem. Syst. Ecol, 58: 13-20. DOI:10.1016/j.bse.2014.10.015 |
Zhao Y.J., Gong X., 2015. Diversity and conservation of plant species in dry valleys, southwest China. Biodivers. Conserv, 24: 2611-2623. DOI:10.1007/s10531-015-0952-2 |


