Tropical lowland evergreen rainforests appear strikingly similar in panoramic and in aerial (overhead) views, but differ significantly in floristic composition and structural diversity stratified in vertical and horizontal spatial profiles (Lüttge, 2008). Many studies have delineated differences in floristic composition and species diversity of rainforests, but the variation in stratification is poorly understood (Lopes et al., 2014). In early assessments, ecologists proposed a multi-layered vertical stratification in tropical rainforests and noted an occurrence of up to eight strata in Panama Canal Zone (Richards, 1984). Subsequent studies observed variations in maximum height of the canopy, number of vegetation strata, discreteness of strata at fixed heights and the width of different strata in rainforests (Yamakura, 1987; Feroz et al., 2006; Kohyama and Takada, 2009, 2012; Wu et al., 2010). In vertical plane, stratification may reveal stacking of structural (abundances of species and individuals, life-forms, branching patterns, arrangement of leaves on branches, etc.), functional (basal area, biomass, leaf mass) and physiological (leaf types, leaf size, deciduousness, ramification patterns) traits of vegetation, since differentiation facilitates stable coexistence and maintenance of diversity in forests (Intachat and Holloway, 2000; Kohyama and Takada, 2009, 2012). In horizontal plane, the canopy openings, which can be detected by dispersion and diametric measurements of trees on the ground and also by overhead spatial mapping, suggest the state of local fragmentation and altered physical conditions, which determine the patterns of regeneration of species in the forests (Whitmore, 1989; Shankar, 2001). Hence, an assessment of vertical and horizontal stratification in the forests is useful in understanding the stacking patterns of community attributes, and also to develop allometric models to derive a forest biomass function and explain energetics (Caicoya et al., 2015).
Surprisingly, ecologists lack a consensus on a common framework to describe horizontal and vertical stratification in forest assemblages. The early studies relied upon drawing of profile diagrams depicting the patterns of stacking of the crown of trees of different heights in a small strip of forest. Hozumi (1975) proposed statistical M-w model for studying multi-layering of a forest stand, but this model has limitations, because it requires the values of tree weight (Feroz et al., 2006, 2015; 2016; Wu et al., 2010). Yamakura(1987, 1988) stratified the individuals of a forest stand into elementary subpopulations by applying quasi-1/2 power law of tree height. Latham et al. (1998) developed a program, TSTART, to place trees into vertical strata on the basis of an assumption related to a competition cut-off point among tree crowns in a given area. Baker and Wilson (2000) identified strata by comparing sorted tree heights to a moving average of height at the base of the live crown. Kohyama and Takada(2009, 2012) proposed a stratification theory for plant coexistence promoted by one-sided competition. In all these models, the emphasis has been on stratification of individuals (N), mass (w) or competition among species. In fact, the vertical structure of tropical rainforests is a complex gradient (continuum) and occurrence of discrete strata can be assumed as partitioning of the continuum in relation to certain traits. To maintain convenience, the ecologists commonly use the terminology (ground layer, understory, lower-storey, middle-storey, overstory, emergent, etc) to refer to different strata despite the fact that these terms arbitrarily apply to various heights in different forest types.
In tropical lowland evergreen rainforests, stratification is dependent largely on floristic composition, dominance of species and interspecific variation in maximum tree height (King et al., 2006). A clear stratification usually occurs when relative dominance of one or a few species is high, else layering in canopy may be indistinguishable (Richards, 1984; Corlett, 2019). Environmental correlates such as geological history, topographic and edaphic factors and climate also play a decisive role in determining stratification (Smith, 1973; King et al., 2006). While many researchers have used the count of individuals (N) to depict stratification (Smith, 1973; Negi et al., 2019), only limited studies have concentrated on the count of species (S), and basal area (BA) as robust parameters (Shankar, 2001).
This study elucidates the patterns of stratification of N, S and BA in 'tropical lowland evergreen rainforests' of Meghalaya, which occur north of the Tropic of Cancer in Indo-Malayan floristic province and constitute a part of the Indo-Burma global hotspot of biodiversity (Corlett, 2019), to address following questions: (ⅰ) is the canopy stratified into discrete strata at fixed heights in respect of N, S and BA?, (ⅱ) are there clearly defined clusters of species that coexist in each stratum?, (ⅲ) do strata exhibit different dominant species?, (ⅳ) do dominant species exhibit spatial segregation to facilitate coexistence?, (ⅴ) does stand structure trend classical inverse J-shaped exponential curve, which is an indicator of good regeneration of the constituent species and surety of survival of the forest in future in no disturbance regime?, and (ⅵ) is stratification in horizontal and vertical profiles mutually related?
The earlier studies of the rainforests of Meghalaya presented an opening dataset from the western edge of the lowland rainforests in north of the tropic of cancer, which detailed an account of floristics and physiognomy (Shankar and Tripathi, 2017; Shankar, 2017). These data are useful to fill the gap in understanding of rainforests in northern limits and practical to facilitate fine crosscontinental comparisons (Corlett, 2019). The present study on stratification of N, S and BA expounds the stunted and shortstatured canopy structure of rainforests in prevailing environment. The study also compares the results with the pristine and most diverse equatorial lowland rainforests predominated by dipterocarps in Jengka Forest Reserve in Malaya (Poore, 1968; Ho et al., 1987), and with the tropical seasonal rainforests near the tropic of cancer in Xishuangbanna in southwestern China (Zhu, 1997, 2008; Lü et al., 2010; Lan et al., 2012) as all these sites belong to the same biogeographical entity, i.e., Indo-Malaya ecozone (Olson and Dinerstein, 1998; Olson et al., 2001). Although the comparisons are based on studies spread over fifty years, yet they are highly relevant because they deal with the pristine state of the respective sites at the time of enumeration, which is rare for such a comparative study today.
2. Material and methods 2.1. Study areaThis study was carried out in tropical lowland evergreen rainforests of Meghalaya. The location of the study sites and a description of the study area are available in Shankar and Tripathi (2017).
2.2. Field samplingIn this study, six patches of rainforest were sampled in 10 m wide and up to 500 m long transects. In all, 2.45 ha was sampled. All stems ≥10 cm GBH (girth at breast height at 1.3 m above ground level), which is nearly ≈3 cm diameter, were included in enumeration. Each stem was measured for girth (cm) and height (m) following Murali et al. (1996). The measurements of stem girth were used to calculate basal area. A detailed inventory of floristics is available in Shankar and Tripathi (2017).
2.3. Data analysisRichards (1952) was the first to propose five vertically superimposed layers of plant diversity in tropical forests and termed these as 'A', 'B', 'C', 'D' and 'E', starting from the emergent stratum towards the ground. However, wide variations can be noted among forests with respect to vertical configuration. There is no consensus on delineating the number of strata (layers) and the width or range of each stratum in rainforests, as these may vary considerably from one to another climate, geographical region and soil type. In tropical rainforests, the overstory can reach up to 60 m and accordingly the width of each stratum in these forests may be broad. Hence, the number of strata and the width of each stratum shall continue to remain subjective in any study despite the attempts to segregate strata by statistical modelling (Hozumi, 1975; Feroz et al., 2006, 2009, 2016). In northeast India, a tropical rainforest may be visualized to display a canopy of five layers: ⅰ) ground layer comprising undergrowth of herbs, pteridophytes and bryophytes (below 1.3 m or breast height), ⅱ) understory-cum-regeneration layer packing shrubs, juveniles, saplings and treelets (1.3 m-5 m height), ⅲ) middle-storey representing lower canopy (5 m-15 m height), ⅳ) overstory representing upper canopy (15 m-25 m height) and ⅴ) emergent layer (above 25 m height). Here, the stratification of the whole assemblage of species in vertical plane is referred to as 'storey structure' (= height class distribution or 'stretch'), which explains vegetation complexity. In horizontal plane, the stratification is referred to as 'stand structure' (= diametric distribution or girth class distribution or 'spread'), which explains vegetation heterogeneity. Further, the stratification of individual species in vertical plane is being referred to as 'loftiness' and in horizontal plane, it is being referred to as 'population structure'. Of course, the vertical and the horizontal components are often interdependent and hence cannot be separated always (Brown, 1991; Brokaw and Lent, 1999).
2.4. Stratification in the vertical plane - storey structureThe storey structure was studied by plotting the cumulative percentages of individuals (N) as abscissa (x-axis) against the height of canopy strata as ordinate (y-axis), which is modified from Popma et al. (1988). This graphic presentation is being introduced here as the 'cumulative percentage plot' (CPP) and it can be extended to other parameters, such as, number of species (S) and basal area (BA). The purpose of CPP is to visualize the continuity or discreteness in the distribution of individuals in heights of forest canopy. The resolution of visualization depends on the least count of height of individuals measured in the field. The resolution will be increasing (getting finer) with decreasing least count of height. For instance, if height measurements of individuals were of 0.1 m graduation, the resolution will be finer than if height values were rounded-off to 1 m.
The mixed forest assemblages are not usually designed with concentrations of individuals in discrete strata. However, discreteness in stratification could be detected as an abrupt change in the slope of the curve in CPP. If the slope changes gradually without a distinct 'breakpoint', it indicates a lack of distinct stratification in the canopy of the forest. In fact, it is important to ignore many changes of small magnitude in the slope of the curve and only the abrupt or bigger changes shall be reckoned to arrive at a comprehendible number of strata. The deciding lines between the smaller and the bigger changes are arbitrary and may absorb some degree of subjectivity. Nonetheless, these may be drawn depending on the objectives of the study.
The CPP resulted in rather indistinct stratification of individuals in the canopy. Hence, the storey structure was further studied in conventionally fixed six 5 m tall height classes, viz., < 5, 5- < 10, 10- < 15, 15- < 20, 20- < 25 and ≥ 25 m (juvenile, young, elder, adult, mature and emergent, respectively). The 'loftiness' of a species in the forest is indicated by the height of its tallest individual or as an average of a few tallest individuals. It is likely that the tallest individual of a species in a given forest environment cannot be captured within the sample plots and thus may escape enumeration. However, an idea of the loftiness of a species may be obtained by observing the height of taller individuals in the vicinity of sample plots to determine that the species belong to which of the growth forms (shrub, small tree, intermediate tree, large tree or emergent). This is essentially desired for those tree species which are of large stature, but are incidentally represented in lower canopy strata.
2.5. Stratification in the horizontal plane - stand structureThe stand structure of individuals (N), species (S) and basal area (BA) was analysed in conventionally fixed nine 30 cm broad girth classes, viz., < 30, 30- < 60, 60- < 90, 90- < 120, 120- < 150, 150- < 180, 180- < 210, 210- < 240 and ≥ 240 cm. The girth class < 30 cm represents the understory-cum-regeneration layer. This class may comprise juveniles and saplings of trees and the individuals of understory species. The girth class between ≥30 and < 60 cm is labelled as young tree layer. This class may comprise saplings of trees, some small trees, shrubs and a few liana. The girth class between ≥60 and < 90 cm is labelled as elder tree layer. This class may comprise small trees, intermediate trees and younger individuals of large trees. The girth class between ≥90 and < 120 cm is labelled as adult tree layer. This class may comprise intermediate and large trees. The girth class between ≥120 and < 180 cm is labelled as mature tree layer. This class may comprise large trees and a few individuals of emergent trees. The girth classes ≥180 cm are labelled as emergent layer and comprise solely of trees protruding the canopy.
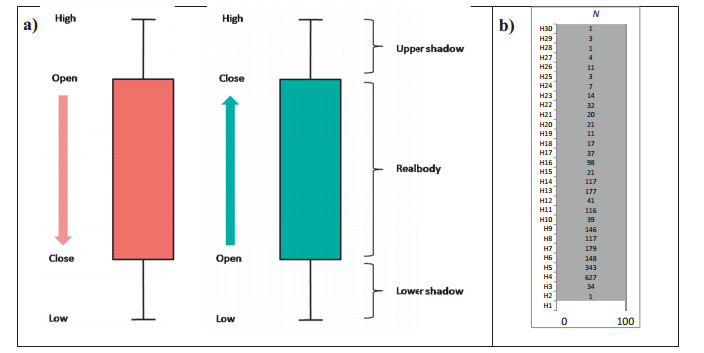
2.6. Stratification of species - loftiness and population structureOf late, the candlestick charts have been widely used in stock market analysis (Nison, 2001). A candlestick is characterized by a main or real body between a trading session's 'open' and 'close' caps of a security (scrip). The excursion above, up to a trading session's high price and the excursion below, up to a trading session's low price are called shadows (wick). If a scrip closed higher than it opened, the body is depicted unfilled or green, with the opening price at the bottom of the body and the closing price at the top (bullish candle, Fig. 1a). If a scrip closed lower than it opened, the body is depicted as filled or red, with the opening price at the top and the closing price at the bottom (bearish candle, Fig. 1a). Sometimes, a candlestick may lack either the real body or the wick. The candlestick charts appear superficially similar to box-plots, but are unrelated.
|
| Fig. 1 a) The scheme of a Japanese bearish (red) and bullish (green) candlestick chart, and b) a columnar candlestick matrix of 1-m tall height classes (strata) in the canopy on y-axis or ordinate (H1 through H30) and the count of individuals of all species together in each height class as one-hundred percent on x-axis or abscissa. |
Using the startling power of the candlestick charting patterns, I develop here a visualization to define together in one graph the loftiness (vertical dominance) and the population structure (horizontal dominance) of individual species in an assemblage. This is achieved in two steps. In the first step, all individuals of all species in the assemblage are viewed as a columnar matrix similar to the body of a candlestick (grey region in Fig. 1b). Based on the least count of the height measurements of the individuals, e.g., one metre in this study, the height classes (strata of the canopy) are worked out and the individuals within each height class are tallied (the numbers in the body of the candle in Fig. 1b). The tallied values of individuals in all height classes are considered as one-hundred percent on abscissa (x-axis). In this study, thirty classes of 1 m height were organized, respectively from H1 through H30 and the count of individuals in height classes is given in the figure (Fig. 1b). The smallest class, H1, has no individuals as only individuals >1.3 m height were measured (Fig. 1b).
In the second step, the vertical stretch (or loftiness) and the horizontal spread (or population structure) of a single species is portrayed embedded within the candlestick as a silhouette (Fig. 1b). The main population of the species is visible as the thick body (or wick) of the silhouette. An excursion downward (lower shadow) depicts the recruitment of younger individuals, and an excursion upward (upper shadow) depicts the expansion of population to maturity. In many cases, the silhouette may lack a thick real body or the wick. Further, the wick may be discontinuous or fragmented. Hence, myriad shapes of the silhouette may emerge depending on the size of population, principal range of incidence in the canopy, status of regeneration and occurrence of larger than the average individuals. The fineness of the candlestick charts shall depend on the resolution of the measurements of height. The precision of measurements may be of 5 m, 2 m, 1 m, 0.5 m or 0.1 m. A finer precision (0.1 m) may show more fragmentation in the wick and a coarser precision (5 m) may hide discontinuities in the wick. Hence, an appropriate precision of measurements of tree height shall be selected. Here, one metre precision is used. The candlestick charts would be of great utility in not only understanding the dominance of species in a forest assemblage with ease, but also in evaluating differences between assemblages and among species within an assemblage.
2.7. Statistical analysesMicrosoft Office Excel (Microsoft Excel, 2007) and PAST (Hammer et al., 2001) softwares were used for statistical analysis and graphics. An appropriate curve-fit evaluated the distribution of N, S, and BA in girth classes. The diversity indices, viz., Fisher's alpha, Shannon's diversity index (H'), Simpson's dominance index (D) and Pielou's evenness (equitability) index (E) were calculated for different strata in PAST. The rarefaction curves of individuals, PCA ordination of species, neighbour joining clustering of species using Mahalanobis distance, and unweighted pair-group method with arithmetic mean (UPGMA) clustering of fixed-height strata using Gower's distance measure of non-Euclidean family with range normalization were executed in PAST. The value of cophenetic correlation indicated the likeness of objects and the suitability of their falling into the same cluster. The bar diagrams, cumulative percentage plot, candlestick charts and 'torchlight scatter' of correspondence between girth classes and height classes were developed in Microsoft Office Excel.
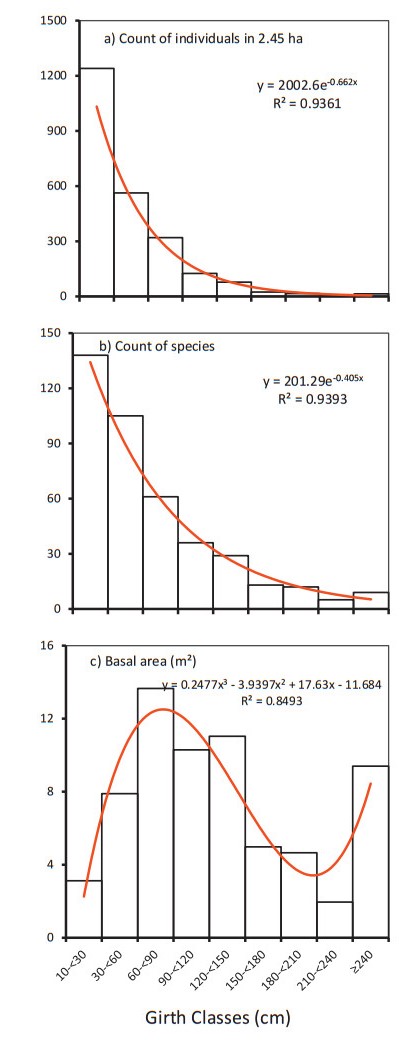
3. Results 3.1. Stratification in horizontal plane - stand structureThe stand structure, in terms of count of individuals (N), exhibited a reverse J-shaped curve with an increasingly slower declining rate from a lower to the next higher girth class (Fig. 2a). In terms of count of species (S), the curve was somewhat similar to that for N, but with slower rate of decrease (Fig. 2b). However, in terms of basal area (BA), the stand structure was bimodal with the first and taller mode in elder tree class and the second and smaller mode in emergent class (Fig. 2c).
|
Fig. 2 Stand structure of lowland rainforests of Meghalaya in terms of a) count of individuals (N), b) count of species (S) and c) basal area (BA) in nine conventionally fixed 30 cm interval girth classes. The best fit models (p < 0.001) are shown as red curves along with regression equations ( |
The smallest girth class of understory-cum-regeneration layer (girth ≥10 to < 30 cm) hoarded 75% of all species, 52% of all individuals and only 4.7% of stand's basal area. This class comprised of juveniles of large and intermediate trees which totalled to 92 species (50% of all species), 36.2% of all individuals and 3.5% of stand's basal area. Besides, the understory shrubs totalled to 46 species (25% of all species), 15.8% of all individuals and 1.2% of stand's basal area. The young-plus-elder classes (girth ≥30 to < 60 cm and ≥60 to < 90 cm) together hoarded 62% of all species, 37% of all individuals and 32.2% of stand's basal area. These classes comprised mainly of intermediate trees (97.1%), some shrubs (2.3%) and a few liana (0.6%). The adult-plus-mature classes (girth ≥90 to < 120 cm and girth ≥120 to < 180 cm) together hoarded 27.1% of all species, 9.5% of all individuals and 39.2% of stand's basal area. These classes comprised solely of trees. The emergent class (girth ≥180 cm) hoarded only 10.3% of all species, 1.5% of all individuals and 23.9% of stand's basal area. This class comprised solely of large trees. The large diameter trees (i.e., ≥300 cm girth, sensu Lutz et al., 2013) were: Castanopsis indica (360 cm girth, 25 m height), Mallotus tetracoccus (321.5, 26), Schima wallichii (319, 25), Terminalia myriocarpa (319, 27), Castanopsis armata (310, 21) and Garuga pinnata (301.5, 28).
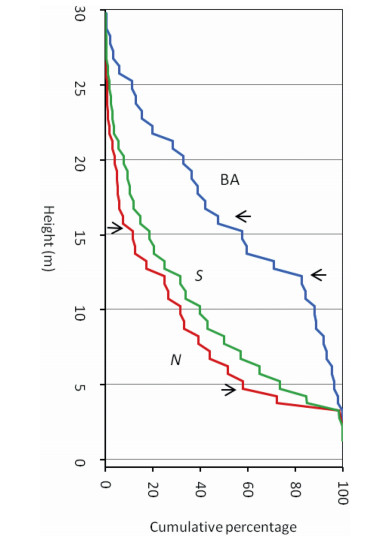
3.2. Stratification in vertical plane - storey structureThe cumulative percentage plot (CPP) of individuals (N) showed an arc-shaped pattern with two indistinctive breakpoints: one around 16 m height and the other around 5 m height (red curve in Fig. 3). The curve descended quickly from upper to lower strata, indicating a modest accretion of individuals (< 12%) above 15 m height. The descent of the curve slowed down up to 5 m height and showed a build up of nearly one-half of the remaining individuals. Below 5 m, the curve tended to be plane and showed an accumulation of the remaining individuals.
|
| Fig. 3 Cumulative percentage plot (CPP) of individuals (N, red), species (S, green) and basal area (BA, blue) for lowland rainforests of Meghalaya. The horizontal arrows indicate principal breakpoints. |
The CPP of species (S) closely followed the pattern of individuals (N), but with greater linearity (green curve in Fig. 3). The breakpoints were rather invisible. The curve for basal area (BA, blue curve in Fig. 3) tended to mirror the pattern of N with two distinctive breakpoints: one around 16 m height and another around 12 m height. The slope of the curve from top to 16 m height was almost linear-diagonal, i.e., unit decrease in cumulative percentage on abscissa with corresponding decrease in height on ordinate. Nearly one-half of the basal area was with trees above 16 m height. The slope of the curve tended to flatten between 16 m and 12 m and within this small range of height, the trees accumulated one-third of basal area. Below 12 m, the descent of the curve was steep and only 16% of basal area built up in this range of height.
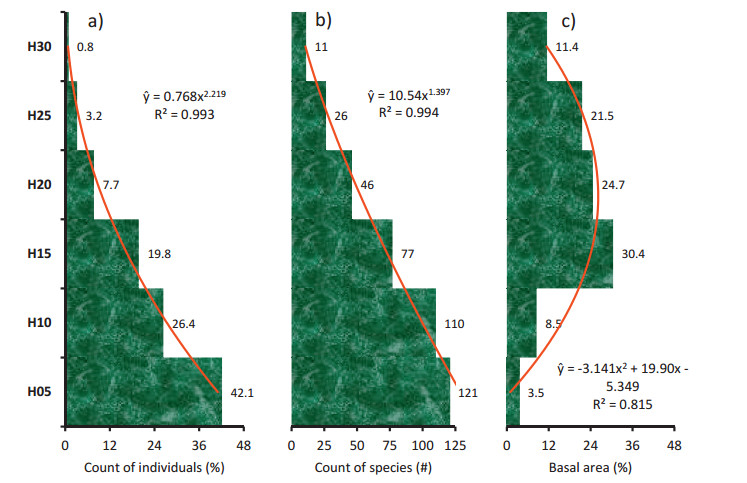
Due to rather inconspicuous multi-storied structure visualized in Fig. 3, six conventionally fixed 5 m interval height classes were defined to envisage the storey structure (Fig. 4). The understory was the thickest stratum hoarding most individuals (Fig. 4a) and majority of species (Fig. 4b). The average height was 7.6 ± 5.2 m for all individuals of ≥10 cm girth and it was 11.6 m for individuals of ≥30 cm girth. Nearly 68.5% individuals of 153 species were below 10 m height (x=4.6 ± 1.8 m), 27.5% individuals of 91 species were between ≥10 and < 20 m height (x=12.9 ± 2.3 m), 3.18% individuals of 26 species were between ≥20 and < 25 m height (x=21.2 ± 1.1 m) and 0.83% individuals of 11 species were with ≥25 m height (x=26 ± 1.5 m), shaping a concave-pyramidal storey structure. The diversification of species was maximum in H05 and H10 strata and declined almost linearly towards H30 stratum (Fig. 4b). The species which exhibited ≥25 m height were: Toona ciliata (6 individuals), S. wallichii (4), G. pinnata (2), Albizia chinensis (1), Bauhinia rufa (1, a climber), C. indica (1), M. tetracoccus (1), Syzygium cumini (1), T. myriocarpa (1), Trema orientalis (1) and Vitex quinata (1). The maximum height was 30 m for T. ciliata. The H15 stratum accumulated maximum basal area followed by H20 and H25 strata (Fig. 4c). The meagre accumulation of basal area in H05, H10 and H30 strata resulted in an arc-shaped storey structure in terms of basal area (Fig. 4c).
|
Fig. 4 Storey structure of lowland rainforests of Meghalaya in terms of a) count of individuals, b) count of species and c) basal area in six conventionally fixed 5 m interval classes of height on ordinate: 0 to < 5 m (H05, juvenile), 5 to < 10 m (H10, young), 10 to < 15 m (H15, elder), 15 to < 20 m (H20, adult), 20 to < 25 m (H25, mature) and 25-30 m (H30, emergent). The best fit models (p < 0.001) are shown as red curves along with regression equations ( |
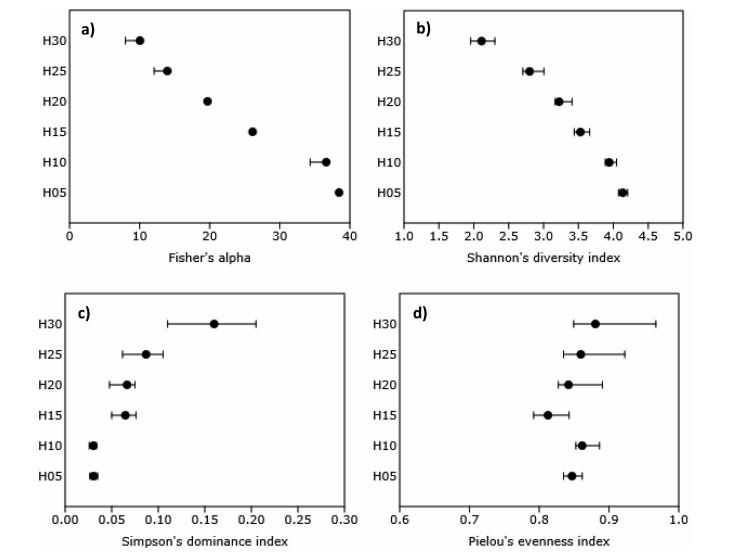
The indices of diversity exhibited striking patterns of stratification in the canopy (Fig. 5). Fisher's alpha values increased linearly from top-to-bottom (Fig. 5a). Shannon's diversity index increased from top-to-bottom, but with decreasing rate of increase with every next lower stratum (Fig. 5b). Simpson's index of dominance was low in all strata (< 0.1) except H30 wherein it was 0.16 and it decreased from top-to-bottom (Fig. 5c). Pielou's evenness (equitability) index was high (>0.81) and showed a somewhat increasing trend within a narrow range from bottom-to-top (Fig. 5d).
|
Fig. 5 Storey structure of lowland rainforests of Meghalaya in terms of a) Fisher's alpha, b) Shannon's diversity index, c) Simpson's dominance index, and d) Pielou's evenness index in six conventionally fixed 5 m interval classes of height on ordinate: 0 to < 5 m (H05, juvenile), 5 to < 10 m (H10, young), 10 to < 15 m (H15, elder), 15 to < 20 m (H20, adult), 20 to < 25 m (H25, mature) and 25-30 m (H30, emergent). The error bars ( |
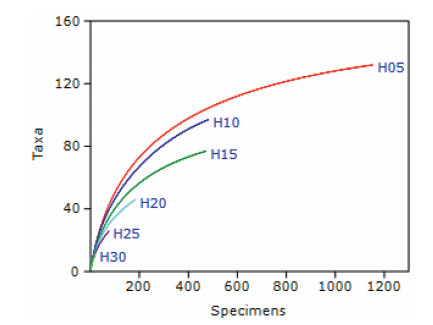
The rarefaction curves for individuals in different strata showed that the expected number of species (taxa) for any number of individuals (specimens) is maximum for the lowermost stratum (H05) and this number consistently declines from the lowermost to the uppermost stratum (Fig. 6). However, the expected number of species for H10 is only marginally lower than that for H05. Further, the curves remain to attain plateau in all strata expectedly with the addition of newer species in larger sampling regime. Notwithstanding, the curve for H05 stratum tended to approach plateau at current levels of sampling (Fig. 6).
|
| Fig. 6 The rarefaction curves of individuals (specimens) for conventionally fixed height strata in the canopy of lowland rainforests of Meghalaya. The height strata are: < 5 m (H05, juvenile), 5 to < 10 m (H10, young), 10 to < 15 m (H15, elder), 15 to < 20 m (H20, adult), 20 to < 25 m (H25, mature) and 25-30 m (H30, emergent). |
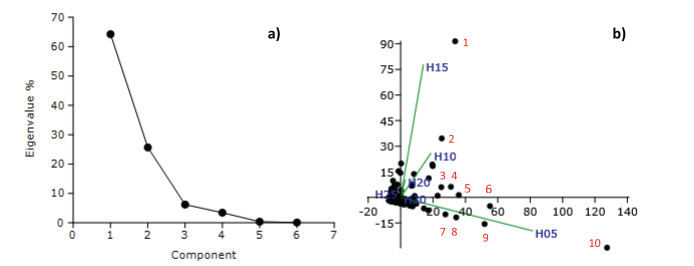
The PCA ordination of species revealed that the first principal component was the most important followed by the second principal component (Fig. 7a). All species, barring fourteen, were concentrated near the centroid within 95% ellipse. The fourteen species, which involve dominants from different strata, separated in different directions (spatial axes) as evident from the biplot (Fig. 7b). The most separated species included Boehmeria glomerulifera in H05 along Component 1 and Macropanax undulatus in H15 along Component 2 (Fig. 7b). The other prominently separated species were: Calamus erectus, Castanopsis lanceifolia, Cinnamomum bejolghota, Cinnamomum tamala, Garcinia elliptica, Helicia nilagirica, Itea macrophylla, Oreocnide integrifolia, Sarcosperma griffithii, S. wallichii, Symplocos sumuntia, and Syzygium tetragonum (Fig. 7b).
|
| Fig. 7 The PCA ordination of species in the canopy of lowland rainforests of Meghalaya: a) scree plot of eigenvalues of principal components, and b) dispersion of species in two dimensional space of Component 1 on abscissa and Component 2 on ordinate along with biplot of strata in green lines. The numbered species are: 1) Macropanax undulatus, 2) Cinnamomum tamala, 3) Sarcosperma griffithii, 4) Schima wallichii, 5) Oreocnide integrifolia, 6) Syzygium tetragonum, 7) Cinnamomum bejolghota, 8) Calamus erectus, 9) Symplocos sumuntia, and 10) Boehmeria glomerulifera. |
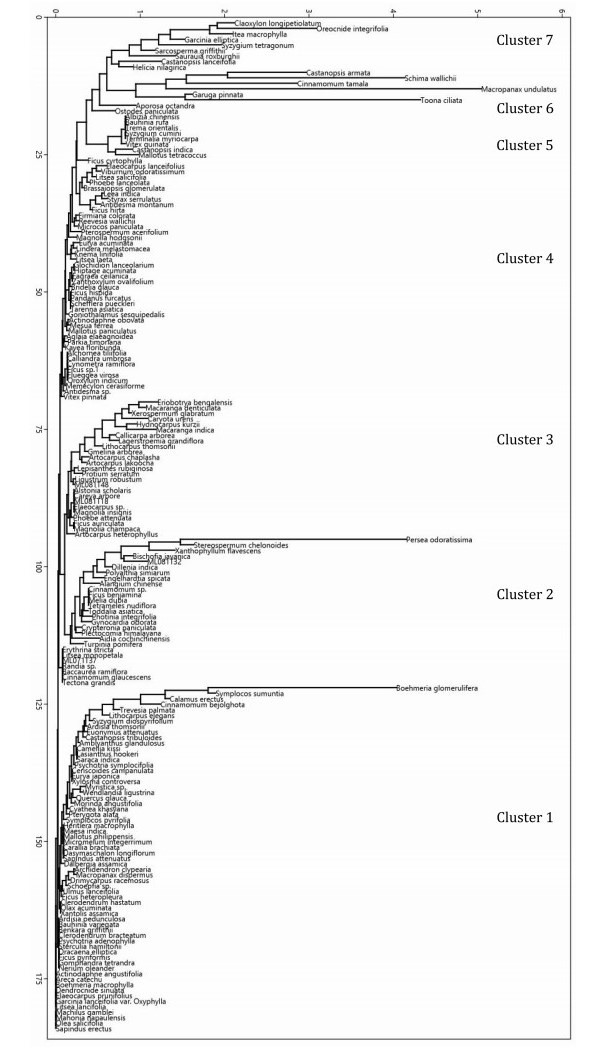
The neighbour joining cluster analysis showed seven principal clusters of 184 species (Fig. 8). Cluster 1 included 63 species primarily occurring in H05 stratum with predominance of B. glomerulifera. Cluster 2, dominated by Persea odoratissima and Stereospermum chelonoides, included 27 species, which grow up to 25 m height, but with maximum abundance in H20 stratum. Cluster 3 included 25 species, which grow up to 20 m height, but with the greatest abundance in H15 stratum. There was no clear dominant in this cluster. Cluster 4 included 44 species, which were necessarily present in H10 and optionally in H05 and H15 without a clear dominant. Principally, these species grow up to 10 m, but with a few individuals extending beyond. Cluster 5 included eight species, which were emergent trees in H30 stratum, but with rare abundances. Five of these were singletons and one was doubleton. Cluster 6 included six species, which showed mixed dominance of large trees with good representation in lower strata. Cluster 7 included eleven species, which were abundant, but restricted to lower strata (H05, H10 and H15) with predominance of Claoxylon longipetiolatum, I. macrophylla and O. integrifolia. Two species, viz., Aporosa octandra and Ostodes paniculata appeared clinging to Cluster 7 (Fig. 8). Overall, the species in lowermost (H05) and uppermost (H30) strata were distinct, but all other species appeared in multiple strata to result in mixed physiognomy and rather inconspicuous stratification of species in middle-storey.
|
| Fig. 8 Neighbour joining cluster analysis of species in the canopy of lowland rainforests of Meghalaya. The vertical axis shows the count of species (increasing from top to bottom) and the horizontal axis indicates distance in abundances (increasing from left to right). |
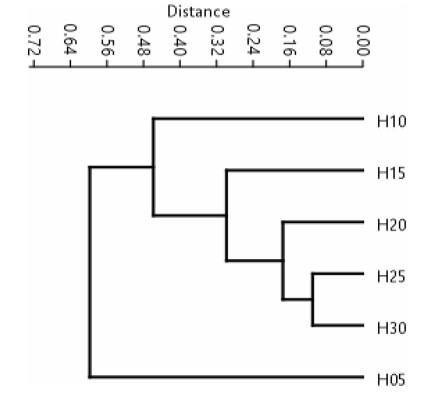
The dendrogram of the degree of similarity in fixed height stratum suggested broadly two clusters, viz., up to 5 m height (H05) and all beyond 5 m height (H05 to H30) with a cophenetic correlation of 0.9935 (Fig. 9). The lowermost stratum (H05) is the most distinct from rest of the canopy and the degree of its floristic similarity declined successively with each higher strarum, i.e., maximum similarity with H10, which declined with H15, H20, H25 and H30. Similarly, H10 exhibited maximum similarity with H15, which declined with H20, H25 and H30. Again, H15 exhibited maximum similarity with H20, which declined with H25 and H30. The similarity of H20 was more with H25 as compared to H30. Finally, the similarity between H25 and H30 was the least.
|
| Fig. 9 Dendrogram of the degree of similarity in floristic composition among fixedheight strata in the canopy of lowland rainforests of Meghalaya. |
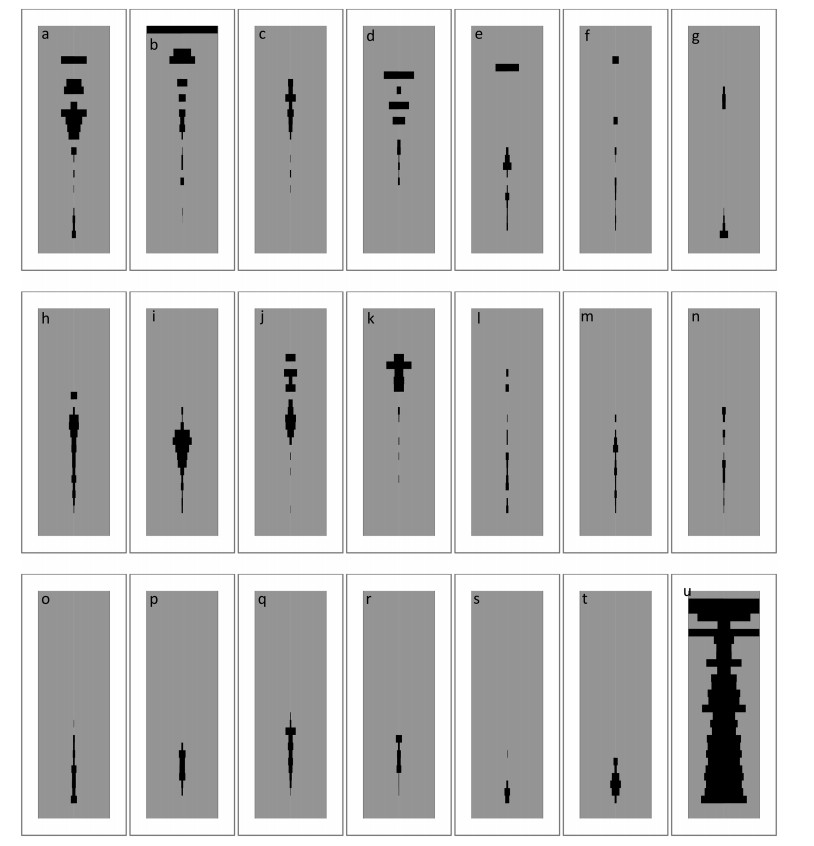
The loftiness and population structure of predominant species are presented together as silhouettes in candlestick matrix, which represents the canopy (Fig. 10). The species in overstory were: C. bejolghota, C. indica, C. lanceifolia, S. chelonoides, S. wallichii, T. ciliata and Xanthophyllum flavescens (Fig. 10a-g). The predominant species in middle-storey were: C. armata, C. tamala, H. nilagirica, Macaranga indica, M. undulatus, P. odoratissima and S. griffithii, which also occur in elder-cumadult strata (Fig. 10h-n). The predominant species in understory were: B. glomerulifera, C. longipetiolatum, I. macrophylla, O. integrifolia, S. sumuntia and S. tetragonum, which also occur in juvenile-cum-young strata (Fig. 10o-t). All the remaining species are considered together in one graph (Fig. 10u). The silhouettes of the species were segregated at different heights in the matrix. All species in overstory and middle-storey showed a lower shadow. Almost all species in understory showed an upper excursion. Several species showed discontinuity in the body of the silhouettes.
|
| Fig. 10 Candlestick charts depicting loftiness (vertical amplitude) and population structure of species in lowland rainforests of Meghalaya. The species are: a) Schima wallichii, b) Toona ciliata, c) Stereospermum chelonoides, d) Xanthophyllum flavescens, e) Castanopsis lanceifolia, f) Castanopsis indica, g) Cinnamomum bejolghota, h) Cinnamomum tamala, i) Macropanax undulatus, j) Castanopsis armata, k) Persea odoratissima, l) Sarcosperma griffithii, m) Helicia nilagirica, n) Macaranga indica, o) Syzygium tetragonum, p) Oreocnide integrifolia, q) Itea macrophylla, r) Claoxylon longipetiolatum, s) Symplocos sumuntia, t) Boehmeria glomerulifera, and u) the remaining 164 species. |
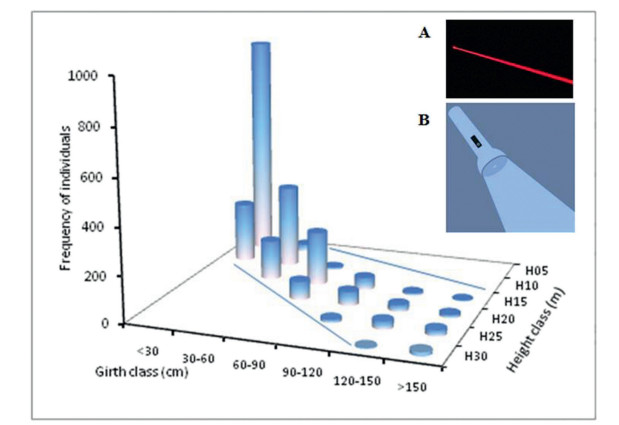
A positive 'torchlight scatter (or somewhat 'telescoping effect') was discernable in frequency of individuals in a matrix of conventionally fixed size classes of girth and height (Fig. 11). The most individuals below 30 cm girth were restricted to H05 (the tallest bar in the graph), with some individuals in H10. Similarly, the most individuals between 30 and 60 cm girth were available in H10, with some individuals in H15 and a few in H05. The individuals between 60 and 90 cm girth were principally in H15, and those between 90 and 120 cm girth were mainly in H20. The individuals between 120 and 150 cm girth were principally in H25, but some individuals also occurred in H20. Similarly, the individuals above 150 cm girth were principally in H25, but some emergent trees above 25 m height were in H30. Some of the individuals in this girth class remained below 25 m height. Hence, as the size of the girth class increased, ⅰ) the frequency of individuals decreased, ⅱ) the individuals tended to scatter in a wider range of height classes, creating a sort of torchlight scatter, and ⅲ) the scatter was biased towards smaller height classes.
|
| Fig. 11 Frequency of individuals in a matrix of conventionally fixed size classes of girth and height of lowland rainforests of Meghalaya, creating a 'torchlight scatter' pattern. Inset A indicates the path of a narrow beam emitted from a laser light and Inset B indicates the path of a torchlight scatter. |
The stratification, which is an important feature of forests, defines an orderly arrangement of taxa (plant, animal, microbes) and their traits (structural, functional and physiological) in an assemblage. Each stratum occupies a portion of the whole assemblage in horizontal as well as in vertical space and hence stratification is two-dimensional. In general, forest canopies are stratified with respect to number of individuals, number of species, tree diameter, height of individuals, leaf mass, and many more traits.
The lowland rainforests of Meghalaya showed a robust stand structure in the form of a classic reverse J-shaped curve, which is typical of mature forests and is characteristic of the average conditions of undisturbed or least-disturbed tropical rainforests (Blanc et al., 2000). An inverse J-shaped curve of N also illustrates excellent regeneration of an expanding assemblage wherein an adequate supply of juveniles (girth < 30 cm) is maintained to successively higher girth classes (Tripathi and Shankar, 2014; Bharathi and Prasad, 2017). A similar curve for S with relatively slower rate of decrease defines continual addition of species in successive girth classes of the assemblage. The smallest girth class, i.e., understorycum-regeneration class (girth ≥10 to < 30 cm), exerts the greatest influence on maintaining the floristic composition of a forest assemblage (Shankar, 2001). A slower rate of descent of the curve defines that a good proportion of juveniles of tree species in a smaller girth class succeeds to grow to the next higher girth class, resulting in a rather unvarying floristic composition and physiognomy of the assemblage on a temporal scale. On the other hand, a faster rate of descent would delineate more changes in floristic composition temporally. A bimodal curve for BA is generally expected in undisturbed assemblages wherein the mature and emergent individuals have not been assaulted (Shankar, 2001). As expected, the taller mode of BA curve was in elder and adult girth classes and the smaller mode was in emergent class. Such a pattern outlines greater ground coverage by the elder-adult-mature individuals as compared to emergent trees. In old growth forests, the emergent trees may show maximum ground coverage and in young regenerating forests, smaller classes (young-elder) encompass more coverage of the ground (Brokaw and Lent, 1999).
In rainforests of Meghalaya, the lack of any significant anthropogenic intervention has reserved the demographic structure of forests as refuge of the pristine vegetation, although the extraction of non-timber forest products (NTFPs) may sparingly occur at a few sites. For instance, Indian bay leaf from C. tamala trees and poles from S. wallichii trees were the only noticeable human activities in studied patches of the forest assemblage. The bay leaf is traded on large scale in Meghalaya for cash income in rural economy and hence people collect bay leaf from all kinds of habitats besides its cultivation in homegardens and agroforestry systems (Ghosh, 2007; Tynsong et al., 2012).
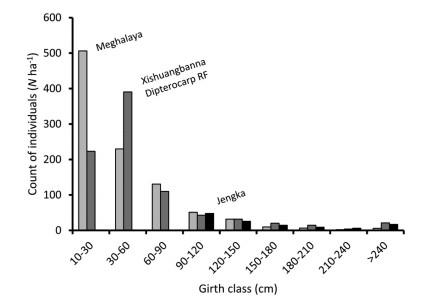
A comparison of stand structure of rainforests of Meghalaya was possible with that of seasonal rainforests in Xishuangbanna, southwestern China (Zhu, 1997) and equatorial rainforests at Jengka, Malaysia (Poore, 1968), although with some limitations and only for count of individuals (N). The stand structure in dipterocarp rainforest in Xishuangbanna was unimodal with a spiky mode in young class, which meant a paucity of regeneration or stressed supply of juveniles (Fig. 12; see Appendix 1). If Zhu (1997) also included measurements of individuals of 10-15 cm girth size (actually measured ≥5 cm DBH) in Xishuangbanna, the number of juveniles would be somewhat larger, but supposedly not as large as for juveniles in Meghalaya (Fig. 12). However, the emergent individuals (girth ≥180 cm) were more in Xishuangbanna than in Meghalaya as well as in Jengka. In spite of these differences, the assemblage size was comparable between Meghalaya (973 individuals ha-1) and Xishuangbanna (857 individuals ha-1). These two values would be closer if the measurements for 10-15 cm girth size were available in Xishuangbanna.
|
| Fig. 12 A comparison of stand structure of lowland rainforests of Meghalaya with seasonal rainforests in Xishuangbanna, China (Zhu, 1997) and equatorial rainforests at Jengka, Malaysia (Poore, 1968) in 'Indo-Malaya' ecozone. |
In Jengka forest reserve, the data were available only for adult, mature and emergent individuals (Poore, 1968). The assemblage size of individuals with girth ≥90 cm was comparable between Meghalaya (107 ha-1) and Jengka (120 ha-1). The stand structure of these individuals was strikingly similar between Meghalaya and Jengka although there were relatively more trees of girth ≥180 cm in Jengka than in Meghalaya (Fig. 12). Large diameter trees (≥300 cm girth), which are less in Meghalaya, are important to manifest better structural heterogeneity (Lutz et al., 2013). Apparently, Poore (1968) hinted at poor regeneration at Jengka by mentioning a smaller count of juveniles. Hence, structural heterogeneity of lowland rainforests of Meghalaya, north of the Tropic of Cancer, is not only typical of tropical rainforests, but also bears similarity with that of the dipterocarpus rainforests near the equator in Jengka as well as between the equator and the Tropic of Cancer in Xishuangbanna, although the differences in floristics may occur (Shankar and Tripathi, 2017). Apparently, the regeneration appears better in Meghalaya than in Xishuangbanna and at Jengka.
4.2. Storey structure and canopy heightThe storey structure of lowland rainforests of Meghalaya was characterised by the low average height (< 30 m), rather fuzzy layering of strata in middle-canopy and narrower widths of the strata. The slope of the cumulative percentage plot for N could imply only two feeble breakpoints (change in slope). However, conventionally fixed height classes could suggest more layers, viz., understory-cum-regeneration layer below 5 m, lower-storey between 5 and 15 m, overstory between 15 and 25 m and an emergent layer above 25 m of height. With an average stand height of only 7.6 m involving all individuals ≥10 cm girth or 11.6 m involving all individuals ≥30 cm girth, the lowland rainforests of Meghalaya compare well with rainforest in central Vietnam (mean tree height 7.9 m, Van and Cochard, 2017), but certainly rank lower in terms of attainment of loftiness of canopy as compared to the seasonal rainforests in southwestern China and equatorial dipterocarp forests in Malaysia. Shanmughavel et al. (2001) reported an average height of 13.02 m for individuals ≥5 cm DBH and 18.6 m for individuals ≥10 cm DBH in seasonal rainforest in Xishuangbanna. The canopy surpasses 40 m with emergent trees (Shorea chinensis) reaching up to 60 m height. The 20 ha Bubeng plot of tropical seasonal rainforest in Mengla county of Xishuangbanna National Nature Reserve is considered to have maintained the highest tree diversity in the region. This plot has trees growing beyond 45 m height and a canopy of five strata, viz., the treelet layer below 10 m, understory between 10 and 20 m, lower canopy between 20 and 30 m, upper canopy between 30 and 45 m and an emergent layer beyond 45 m in height (Lan et al., 2012; Uma Shankar's personal observation in 2018). In dipterocarp forests in Sarawak, Malaysia, the average canopy height was 21.8 m with enumeration of trees ≥10 cm DBH (Proctor et al., 1983). The storey structure of the dipterocarp rainforests at Jengka, Malaysia was not studied by Poore (1968) and Ho et al. (1987). However, the mean canopy height of only dipterocarp trees at Pasoh, Malaysia is known to be 47 m with emergent trees reaching up to 60 m or higher (Ghazoul, 2016).
The short stature of canopy, fuzzy layering of strata especially in middle-storey and narrower widths of strata in rainforests of Meghalaya are expected manifestations of the floristics, physiographic factors and prevailing climate. The members of family Dipterocarpaceae, which are known to grow to tall heights, as observed in southwest China and Malaysia are usually absent in rainforests of Meghalaya (Shankar and Tripathi, 2017). Further, several of the tall tree species, which easily grow beyond 30 m height, such as, A. chinensis, Cinnamomum glaucescens, Mesua ferrea, S. cumini, T. myriocarpa, Tetrameles nudiflora, and V. quinata are rare (< 1 individual ha-1).
The topographic and orographic features of the slopes of southern aspect of Meghalaya plateau source this region for frequent north-westerly cyclonic storms that arise from the Bay of Bengal, especially during spring and summer months. In course of evolution, these forests must have adapted to high speed windthrows by steady elimination of tall statured tree species from their floristics after setting of the pattern of Asian monsoon. As southern slopes of the Meghalaya plateau act as an immediate barrier to the monsoon, they receive very high quantities of rainfall, which results into heavy runoff losses of soil and nutrients and renders the substratum impoverished and inhospitable for supporting deep root systems and luxuriant growth of rainforests (Shankar et al., 1991, 1993; Tripathi et al., 1995). It has long been recognized that the forests that experience frequent strong winds do adapt to mitigate the catastrophic influence of storm damages at the margins of the cyclone belt, notably by their short stature and smooth canopy structure (Ashton, 1993). Bongers et al. (1988) specified a broadly similar set of reasons for rather short stature of the rainforests of Los Tuxtlas, Mexico, which represent the northernmost limit of tropical lowland rainforest at 18°36' N latitude in neotropics.
Among the climatic factors, the difference of precipitation (P) and potential evapotranspiration (PET) is recognized as an important determinant of forest canopy height. In a recent study, Tao et al. (2016) concluded that the mean canopy height is maximum in tropical regions, but forests >50 m height occur at varied latitudes. They found a hump-shaped relationship of the canopy height along a gradient of P-PET, which indicated that the mean canopy height initially increased, then peaked at approximately 680 mm of P-PET, and subsequently declined. This suggested that the excessive water supply negatively affects the canopy height. In rainforests of Meghalaya, the quantity of precipitation (>3000 mm y-1) as well as potential evapotranspiration (≈1000 mm deduced from Goroshi et al., 2017, which includes the maximum amount of water capable of being evaporated from the soil and transpired from the vegetation of a specific surface; sensu Zhang et al., 2007) are very high. Furthermore, the difference of P-PET is also very high (>1000 mm), which indicates excessive quantities of rainfall received in this region. The excessive quantities of rainfall not only impoverish the soil and influence productivity (Shankar et al., 1991, 1993; Tripathi et al., 1995; Soja and Starkel, 2006), but may also contribute to determine the short stature of the forests. In high rainfall receiving forests, low availability of light and moderation of temperature within the canopy may also impact tall growth of trees. In southwestern China, the difference of P-PET is around 600 mm as the mean annual evapotranspiration was estimated 1029 mm in Xishuangbanna National Nature Reserve (Li et al., 2010) and mean annual precipitation in the range of 1500-1600 mm (Li et al., 2010; Lü et al., 2010; Lan et al., 2012). Additionally, foggy mornings during winter months add to precipitation (Zhu, 1997). Hence, the values of P-PET around 600 mm are ideal for supporting the growth of lofty trees according to the estimates of Tao et al. (2016).
The storey structure of the rainforest is characterised by packing of N and S in a pyramidal fashion in vertical space, which means a metrical decline from the lowermost to the uppermost stratum. The storey structure was concave-pyramidal in terms of N with nearly two-third of individuals below 10 m height, nearly one-fourth of individuals between 10 and 20 m height and the remaining 5% individuals between 20 and 30 m height. The concaveness reduced (linearity increased) for the storey structure in terms of S, which means that a good proportion of species succeeds in reaching upper strata. These trends are a moderately different from other forest types in Meghalaya, such as 'Khasi hill sal' forest (Tripathi and Shankar, 2014) and subtropical broad-leaved hill forest (Upadhaya, 2015; Shankar, unpublished) wherein the paucity of individuals in the lowermost stratum rolls these patterns unimodal (non-pyramidal). The storey structure showed somewhat parabolic (arc) shape in terms of BA with three-fourth of the basal area restricted in the middle of canopy. This is different from invertedpyramidal storey structure, which characterizes forests with predominance of large-diameter trees and closed canopies. The fact that the rainforests of Meghalaya are short-statured with fewer large diameter trees as compared to the rainforests in Southeast Asia and Pacific elicits such a pattern.
4.3. Population structure and loftiness of dominant speciesThe lowland rainforests of Meghalaya exhibited differential dominance of species in canopy strata. While the lowermost and the uppermost strata showed predominance of a few species, the middle-storey revealed no clear dominants, resulting in a mixed pattern of dominance. The silhouettes of the species showed segregation at different heights in the canopy. All species in overstory and middle-storey showed a lower excursion or shadow of various lengths and thickness. Almost all species in understory showed an upper excursion. Many species showed discontinuity in the wicks. In general, the dominant species in all strata exhibited good regeneration. S. wallichii is the most stable and well regenerating species in the forest as it is represented in all diametric classes and has individuals of all heights. This species weaves the basic framework of the forest. An exceptionally low number of individuals of S. wallichii in 'young' class is partly attributable to preferential removal of pole size individuals for household consumption at a few sites. The diametric distribution of M. undulatus affirms that this medium-sized tree is currently predominant in middle-canopy and exhibits signs of 'stressed' regeneration. Species of this kind, with positively skewed population structure, would decline in future and may be replaced by the dominance of other species (Blanc et al., 2000). C. tamala represents a population structure which is typical of small and medium-sized tree species in the forest. Species of this kind grow stably in lower and middlecanopy and maintain adequate regeneration (Shankar, 2001). The population structure of B. glomerulifera is typical of the dominant species in understory with most individuals of small girth. Such profusely regenerating species belong to small life-forms (nanophanerophytes) and hardly exceed a diameter of 30 cm. The results suggest that in a well regenerating rainforest, such as in Meghalaya, many species, including dominants, have stable populations with adequate regeneration. Nonetheless, several species exhibit stressed regeneration as these species have obtained dominance in the assemblage and would decline in future to be replaced by other species. Thus, a shift in dominance of species is continual within the canopy of rainforests, while the forest manages to retain the physiognomy and life-form composition (Zhu et al., 2010).
4.4. Correspondence between girth classes and height classesThis study finds that the individuals (stems or trees) tend to scatter in increasingly wider range of height classes from a lower to the next higher girth class, creating a 'torchlight effect' (or somewhat 'telescoping effect'), with a tendency to concentrate more towards smaller height classes (Fig. 10). This means that the initial growth of stems in height strongly corresponds their proportionate diametric increase, but this correspondence weakens as stems continue to grow in girth, by expanding variation in height in terms of more stems attaining smaller height than they should in proportion to increase in girth. Seemingly, most individuals shall occur in the classes at the diagonal of the girth class-height class matrix if a fine correspondence between diametric growth and height growth occurs. This would appear somewhat like a narrow beam emitted from a laser light which is of one wavelength, highly directional and coherent (Inset A in Fig. 10). On the other hand, the increase in height of stems does not strongly correspond diametric growth as many stochastic factors may influence stem height during maturation, causing morbidity. This results in scattering of individuals in a broader range of height classes with increasing age or diametric growth in a manner similar to the scattering of light emitting from a torch, which is a combination of many different wavelengths (Inset B in Fig. 10). In undisturbed tropical forests, the natural stochastic events that influence the growth of trees both in girth and height may be intrinsic (genetic, physiological, etc.) and/ or extrinsic (mainly site quality factors such as physical, edaphic, climatic, biotic interactions including grazing, natural fire, diseases, etc.). In disturbed forests, a variety of anthropogenic factors may accentuate the influence on height growth in many ways. Although the girth class and height class relationship is not documented, the relationship between girth and height of trees of individual species is widely studied. A recent study on stand structure and heightdiameter relationship of Populus euphratica from northwest China has shown that the correlation between tree height and diameter decreased with the decline of tree vitality (Aishan et al., 2015).
5. ConclusionsThis study presents a framework for delineating the patterns of stratification in structural diversity (N, S and BA) along horizontal and vertical planes (strata) in a forest. The lowland rainforests of Meghalaya in northern limits of distribution reveal some important attributes of community organization. The stand structure follows classical reverse J-shaped exponential pattern of diverse and mature forests primarily due to absence of disturbance. The canopy is evidently of short stature (stunted) for any tropical lowland rainforest. It is nearly one-half the height of the canopy of dipterocarpus tropical rainforests near equator in Malaysia and about two-third of that in sourthwestern China. However, the structural complexity of rainforest canopy is maintained despite short stature, which is a precursor to support more species along microclimatic gradient in vertical space. Broadly, the canopy is stratified into three principal strata: a) highly diverse understory below 5 m, which accumulates one-half of the total individuals and a cluster of onethird of exclusive species, b) middle-storey between 5 and 15 m, which mainly weaves the framework of the rainforest, and c) an overstory between 15 and 25 m, which imparts appearance to the physiognomy of the rainforest. The Shannon's diversity gradually declines from the lowermost to the uppermost stratum, but the equitability among species remains almost unaltered. The dominance of the predominant species is not confined to a specific stratum. The stratification of individuals in horizontal and vertical spatial profiles was mutually related in a torchlight scatter pattern between diametric and height growth. An aided management of these rainforests can uphold the structural complexity and stratification that supports myriad diversity of angiosperms.
Conflict of interestThe author declares that he has no competing interests.
FundingThe principal funding for this study was from the Department of Biotechnology, Ministry of Science and Technology, Government of India, New Delhi through grant number BT/PR7928/NDB/ 52/9/2006 to the author. Financial support for visit to China was received under the INSA-CAS Bilateral Exchange Programme 2018 from the Indian National Science Academy, New Delhi and Chinese Academy of Sciences, Beijing vide grant number INT/CAS/2017/01.
Authors' contributionsThe author participated in the field survey, species identification, developed test hypotheses and study design, reviewed literature, analysed data and carried out manuscript writing.
Authors' informationThe author is a professor of botany at the North-Eastern Hill University, Shillong and teaches courses on ecology, biodiversity and conservation.
AcknowledgementsThe author is grateful to Prof. K.N. Ganeshaiah, UAS, Bengaluru, for encouragement, the custodians of forests in Meghalaya for permission, the Botanical Survey of India, Shillong for access to herbarium, and the Head, Department of Botany, NEHU for logistics. The help rendered by the project staff and spouse Mrs. Shilpi Agrawal is thankfully acknowledged. The author is studying phytosociology and regeneration of forest ecosystems in northeastern India under the doctor of science programme at the NorthEastern Hill University, Shillong. A recent visit of the author to Key Laboratory at Xishuangbanna Tropical Botanical Garden (XTBG) and its Bubeng plot in Yunnan, China, under INSA-CAS Bilateral Exchange Programme 2018 (courtesy my host, Professor Tao Su) helped the design and discussion of this paper. The author dedicates this paper to Professor R.S. Tripathi, FNA who taught ecology for nearly three decades at the North-Eastern Hill University and mentored over thirty doctoral students, including the author, in ecological research and remained academically active beyond his retirement in 2004 until he breathed last on February 14, 2019 in Lucknow, India.
Abbreviations| GBH | Girth at breast height (1.3 m above ground level) |
| DBH | Diameter at breast height (1.3 m above ground level) |
| N | count of individuals |
| S | Count of species |
| BA | Basal area of the stem |
| H' | Shannon's diversity index |
| D | Simpson's dominance index |
| E | Pielou's evenness index |
| GPS | Geographical positioning system |
| H05 | Height stratum 0 to < 5 m |
| H10 or juvenile Height stratum 5 to < 10 m or young | |
| H15 | Height stratum 10 to < 15 m or elder |
| H20 | Height stratum 15 to < 20 m or adult |
| H25 | Height stratum 20 to < 25 m or mature |
| H30 | Height stratum 25 to < 30 m or emergent |
Supplementary data to this article can be found online at https://doi.org/10.1016/j.pld.2019.08.001.
Aishan T., Halik Ü., Betz F., Tiyip T., Ding J., Nuermaimaiti Y., 2015. Stand structure and height-diameter relationship of a degraded Populus euphratica forest in the lower reaches of the Tarim River, Northwest China. J. Arid. Land, 7: 544-554. DOI:10.1007/s40333-015-0046-8 |
Ashton P.S., 1993. The community ecology of Asian rain forests, in relation to catastrophic events. J. Biosci, 18: 501-514. DOI:10.1007/BF02703082 |
Baker P.J., Wilson J.S., 2000. A quantitative technique for the identification of canopy stratification in tropical and temperate forests. For. Ecol. Manage, 127: 77-86. DOI:10.1016/S0378-1127(99)00118-8 |
Bharathi S., Prasad A.G.D., 2017. Diversity, population structure and regeneration status of arboreal species in the four sacred groves of Kushalnagar, Karnataka. J. For. Res, 28(2): 357-370. DOI:10.1007/s11676-016-0328-9 |
Blanc L., Maury-Lechon G., Pascal J.-P., 2000. Structure, floristic composition and natural regeneration in the forests of Cat Tien National Park, Vietnam:an analysis of the successional trends. J. Biogeogr, 27: 141-157. DOI:10.1046/j.1365-2699.2000.00347.x |
Bongers F., Popma J., Meave del Castillo J., Carabias J., 1988. Structure and floristic composition of the lowland rain forest of Los Tuxtlas. Mexico. Vegetatio, 74: 55-80. DOI:10.1007/BF00045614 |
Brokaw, N.V.L., Lent, R.A., 1999. Vertical structure. In: Hunter, I., Malcom, L. (Eds.), Maintaining Biodiversity in Forest Ecosystems. Cambridge University Press, Cambridge, pp. 373-399. https://doi.org/10.1017/CBO9780511613029.013.
|
Brown, V.K., 1991. The effects of changes in habitat structure during succession in terrestrial communities. In: Bell, S.S., McCoy, E.D., Mushinsky, H.R. (Eds.), Habitat Structure: the Physical Arrangement of Objects in Space, Population and Community Biology Series 8. Springer Science+Business Media, Dordrecht, ISBN 978-94-010-5363-1, pp. 141-168.
|
Caicoya A.T., Kugler F., Pretzsch H., Papathanassiou K., 2015. Forest vertical structure characterization using ground inventory data for the estimation of forest aboveground biomass. Can. J. For. Res, 461: 25-38. DOI:10.1139/cjfr-2015-0052 |
Corlett, R.T., 2019. The Ecology of Tropical East Asia, third ed. Oxford University Press, Oxford, UK, p. 336.
|
Feroz S.M., Mamun A.A., Kabir M.E., 2016. Composition, diversity and distribution of woody species in relation to vertical stratification of a tropical wet evergreen forest in Bangladesh. Glob. Ecol. Conser, 8: 144-153. DOI:10.1016/j.gecco.2016.08.012 |
Feroz S.M., Kabir M.E., Hagihara A., 2015. Species composition, diversity and stratification in subtropical evergreen broadleaf forests along a latitudinal thermal gradient in the Ryukyu Archipelago, Japan. Glob. Ecol. Conser, 4: 63-72. DOI:10.1016/j.gecco.2015.05.002 |
Feroz S.M., Hagihara A., Yokota M., 2006. Stand structure and woody species diversity in relation to the stand stratification in a subtropical evergreen broadleaf forest, Okinawa Island. J. Plant Res, 119(4): 293-301. DOI:10.1007/s10265-006-0270-6 |
Feroz S.M., Min W., Li Y., Sharma S., Suwa R., Nakamura K., Hagihara A., Denda T., Yokota M., 2009. Floristic composition, woody species diversity and spatial distribution of trees based on architectural stratification in a subtropical evergreen broadleaf forest on Ishigaki Island in the Ryukyu Archipelago. Tropics, 18(3): 103-114. DOI:10.3759/tropics.18.103 |
Ghazoul, J., 2016. Dipterocarp Biology, Ecology and Conservation. Oxford University Press, Oxford, UK, p. 320. https://dx.doi.org/10.1093/acprof:oso/9780199639656.003.0001.
|
Ghosh, B., 2007. Regeneration Ecology and Sustainability of Harvest of Bay Leaf, Cinnamomum Tamala Fr. Nees in Meghalaya. Department of Botany, NorthEastern Hill University, Shillong, p. 168. Ph.D. Thesis.
|
Goroshi S., Pradhan R., Singh R.P., Singh K.K., Parihar J.S., 2017. Trend analysis of evapotranspiration over India:observed from long-term satellite measurements. J. Earth. Syst. Sci, 126: 113. DOI:10.1007/s12040-017-0891-2 |
Hammer, O., Harper, D.A.T., Ryan, P.D., 2001. PAST, paleontological statistics software package for education and data analysis. Palaeontol. Electron. 41, 9.https://palaeo-electronica.org/2001_1/past/issue1_01.htm.
|
Ho C.C., Newbery D.McC., Poore M.E.D., 1987. Forest composition and inferred dynamics in Jengka forest reserve, Malaysia. J. Trop. Ecol, 31: 25-56. DOI:10.1017/S0266467400001103 |
Hozumi K., 1975. Studies on the frequency distribution of the weight of individual trees in a forest stand. V. The Mew diagram for various types of forest stands. Jpn. J. Ecol, 25: 123-131. |
Intachat J., Holloway J.D., 2000. Is there stratification in diversity or preferred flight height of geometroid moths in Malaysian lowland tropical forest? Biodivers. Conserv, 9: 1417-1439. |
King D.A., Wright S.J., Connell J.H., 2006. The contribution of interspecific variation in maximum tree height to tropical and temperate diversity. J. Trop. Ecol, 221: 11-24. |
Kohyama T.S., Takada T., 2009. The stratification theory for plant coexistence promoted by one-sided competition. J. Ecol, 97: 463-471. DOI:10.1111/j.1365-2745.2009.01490.x |
Kohyama T.S., Takada T., 2012. One-sided competition for light promotes coexistence of forest trees that share the same adult height. J. Ecol, 100: 1501-1511. DOI:10.1111/j.1365-2745.2012.02029.x |
Lan G., Zhu H., Cao M., 2012. Tree species diversity of a 20-ha plot in a tropical seasonal rainforest in Xishuangbanna, Southwest China. J. For. Res, 17: 432-439. DOI:10.1007/s10310-011-0309-y |
Latham P.A., Zuuring H.R., Coble D.W., 1998. A method for quantifying vertical forest structure. For. Ecol. Manage, 104: 157-170. DOI:10.1016/S0378-1127(97)00254-5 |
Li Z., Zhang Y., Wang S., Yuan G., Yang Y., Cao M., 2010. Evapotranspiration of a tropical rain forest in Xishuangbanna, southwest China. Hydrol. Process, 24: 2405-2416. DOI:10.1002/hyp.7643 |
Lopes S.F., Vale V.S., Schiavini I., Prado Jr., J. A., Oliveira A.P., Arantes C.S., 2014. Canopy stratification in tropical seasonal forests:how the functional traits of community change among the layers. Biosci. J. Uberl, 305: 1551-1562. |
Lü X.T., Yin J.X., Tang J.W., 2010. Structure, tree species diversity and composition of tropical seasonal rainforests in Xishuangbanna, south-west China. J. Trop. For. Sci, 22: 260-270. |
Lutz J.A., Larson A.J., Freund J.A., Swanson M.E., Bible K.J., 2013. The importance of large-diameter trees to forest structural heterogeneity. PLoS One, 8(12): e82784. DOI:10.1371/journal.pone.0082784 |
Lüttge, U., 2008. Physiological Ecology of Tropical Plants. Springer, Berlin, Heidelberg, p. 458. https://doi.org/10.1007/978-3-540-71793-5_3.
|
Microsoft Excel, 2007. Microsoft Office Excel 2007. Microsoft, Inc., USA.
|
Murali, K.S., Shankar, U., Uma Shaanker, R., Ganeshaiah, K.N., Bawa, K.S., 1996. Extraction of non-timber forest products in the forest of Biligiri Rangan hills, India. 2. Impact of NTFP extraction on regeneration, population structure and species composition. Econ. Bot. 50, 252-269.
|
Negi V.S., Pathak R., Rawal R.S., Bhatt I.D., Sharma S., 2019. Long-term ecological monitoring on forest ecosystems in Indian Himalayan Region:criteria and indicator approach. Ecol. Indicat, 102: 374-381. DOI:10.1016/j.ecolind.2019.02.035 |
Nison, S., 2001. Japanese Candlestick Charting Techniques, second ed. New York Institute of Finance, New York, p. 320.
|
Olson D.M., Dinerstein E., 1998. The Global 200:a representation approach to conserving the Earth's most biologically valuable ecoregions. Conserv. Biol, 12: 502-515. DOI:10.1046/j.1523-1739.1998.012003502.x |
Olson D.M., Dinerstein E., Wikramanayake E.D., Burgess N.D., Powell G.V.N., Underwood E.C., D'amico J.A., Itoua I., et al, 2001. Terrestrial ecoregions of the world:a new map of life on earth. BioScience, 51: 933-938. DOI:10.1641/0006-3568(2001)051[0933:TEOTWA]2.0.CO;2 |
Popma J., Bongers E., del Castillo J.M., 1988. Patterns in the vertical structure of the tropical lowland rain forest of Los Tuxtlas, Mexico. Vegetatio, 74: 81-91. DOI:10.1007/BF00045615 |
Poore M.E.D., 1968. Studies in Malaysian rain forest, Ⅰ. The forest on triassic sediments in Jengka forest reserve. J. Ecol, 56: 143-196. DOI:10.2307/2258073 |
Proctor J., Andersion J.M., Chai P., Vallack H.W., 1983. Ecological study in four contrasting lowland rainforests in Gunung Mulu National Park, Sarawak; I. Forest environment, structure and foristics. J. Ecol, 71: 237-260. |
Richards P.W., 1952. The Tropical Rain Forest:an Ecological Study. Cambridge: Cambridge University Press: p. 600.
|
Richards, P.W., 1984. The three-dimensional structure of tropical rain forests. In: Whitmore, T.C., Chadwick, A.C. (Eds.), Tropical Rain Forest Ecology and Management. Blackwell, London, pp. 3-10.
|
Shankar U., 2001. A case of high tree diversity in sal Shorea robusta.-dominated lowland forest of eastern Himalaya, floristic composition, regeneration and conservation. Curr. Sci, 81: 776-786. |
Shankar, U., 2017. Yes, we have tropical rainforests far away from the Equator - in Meghalaya! NEHU J. 15 (1), 1-16.
|
Shankar U., Tripathi R.S., Pandey H.N., 1991. Structure and seasonal dynamics of humid tropical grasslands in Meghalaya, India. J. Veg. Sci, 2: 711-714. DOI:10.2307/3236181 |
Shankar U., Pandey H.N., Tripathi R.S., 1993. Phytomass dynamics and primary productivity in humid grasslands along altitudinal and rainfall gradients. Acta. Oecol, 14: 197-209. |
Shankar U., Tripathi A.K., 2017. Rainforests north of the Tropic of Cancer:physiognomy, floristics and diversity in 'lowland rainforests' of Meghalaya, India. Plant Divers, 39: 20-36. DOI:10.1016/j.pld.2016.10.003 |
Shanmughavel P., Zheng Z., Liqing S., Min C., 2001. Floristic structure and biomass distribution of a tropical seasonal rain forest in Xishuangbanna, southwest China. Biomass Bioenergy, 21: 165-175. DOI:10.1016/S0961-9534(01)00023-X |
Smith A.P., 1973. Stratification of temperate and tropical forests. Am. Nat, 107: 671-683. DOI:10.1086/282866 |
Soja R., Starkel L., 2006. Extreme rainfalls in Eastern Himalaya and southern slope of Meghalaya Plateau and their geomorphologic impacts. Geomorphology, 84: 170-180. DOI:10.1016/j.geomorph.2006.01.040 |
Tao S., Guo Q., Li C., Wang Z., Fang J., 2016. Global patterns and determinants of forest canopy height. Ecol, 97: 3265-3270. DOI:10.1002/ecy.1580 |
Tripathi, R.S., Shankar, U., Pandey, H.N., 1995. Present status and strategies for ecorestoration of degraded ecosystems at Cherrapunji. In: Tiwari, B.K., Singh, S.(Eds.), Ecorestoration of Degraded Hills. Kaushal Publications, Shillong, pp. 23-50.
|
Tripathi A.K., Shankar U., 2014. Patterns of species dominance, diversity and dispersion in 'Khasi hill sal' forest ecosystem in northeast India. For. Ecosyst, 1: 23. DOI:10.1186/s40663-014-0023-2 |
Tynsong H., Tiwari B.K., Dkhar M., 2012. Contribution of NTFPs to the cash income of war Khasi community of south Meghalaya, North-East India. For. Stud. China, 14(1): 47-54. DOI:10.1007/s11632-012-0104-7 |
Upadhaya K., 2015. Structure and floristic composition of subtropical broad-leved hunid forest of Cherrapunji in Meghalaya, northeast India. J. Biodivers. Manage. For, 4(4). DOI:10.4172/2327-4417.1000149 |
Van Y.T., Cochard R., 2017. Tree species diversity and utilities in a contracting lowland hillside rainforest fragment in Central Vietnam. For. Ecosyst, 4: 9. DOI:10.1186/s40663-017-0095-x |
Whitmore T.C., 1989. Canopy gaps and the two major groups of forest trees. Ecol, 70: 536-538. DOI:10.2307/1940195 |
Wu, M., Feroz, S.M., Hagihara, A., Xue, L., Huang, Z.L., 2010. Vertical stratification, floristic composition and woody species diversity in a subtropical evergreen broadleaf forest (Dinghushan Nature Reserve, South China). Tropics 19, 9-20.
|
Yamakura T., 1987. An empirical approach to the analysis of forest stratification. Ⅰ. Proposed graphical method derived by using an empirical distribution function. Bot. Mag. Tokyo, 100(2): 109-128. DOI:10.1007/BF02488317 |
Yamakura T., 1988. An empirical approach to the analysis of forest stratification. Ⅱ. Quasi-1/2 power law of tree height in stratified forest communities. Bot. Mag. Tokyo, 101(2): 153-162. DOI:10.1007/BF02488892 |
Zhang Y., Liu C., Tang Y., Yang Y., 2007. Trends in pan evaporation and reference and actual evapotranspiration across the Tibetan Plateau. J. Geophys. Res. Atmos: 112. |
Zhu H., 1997. Ecological and biogeographical studies on the tropical rain forest of south Yunnan, SW China with a special reference to its relation with rainforests of tropical Asia. J. Biogeogr, 24: 647-662. DOI:10.1111/j.1365-2699.1997.tb00075.x |
Zhu H., 2008. Advances in biogeography of the tropical rain forest in southern Yunnan, southwestern China. Trop. Conserv. Sci, 1: 34-42. DOI:10.1177/194008290800100103 |
Zhu H., Wang H., Zhou S.S., 2010. Species diversity, floristic composition and physiognomy changes in rainforest remnant in southern Yunnan, China after 48 years. J. Trop. For. Sci, 22: 49-66. |


