


b. Department of Biology, Samara University, Afar, Ethiopia;
c. Holetta Agricultural Research Center, Holetta, Ethiopia;
d. Department of Environmental and Developmental Studies, Addis Ababa, University, Addis Ababa, Ethiopia
The diverse topography and isolated biogeography of mountains are ideal conditions for harboring biodiversity. Indeed, one-third of terrestrial biodiversity and half of the 34 global diversity hotspots can be found in mountain environments (Vetaas and Grytnes, 2002, Krner, 2004). The complex terrain and steep climatic gradients of mountains, however, make montane species--especially plant species-- sensitive to the impacts of global warming and climate change (Krner, 2004). Thus, understanding the relationship between plant species distribution patterns and environmental variables along elevation gradients remains a central issue for ecologists (Hegazy et al., 2007). Plant species richness and distribution along an elevation gradient may also be influenced by other factors, including management intensity, anthropogenic disturbance, and spatial heterogeneity. Consequently, the patterns of plant species richness and distribution along elevation gradients often vary in ways important for conservationists.
Species distribution along elevation gradients do not follow rigid patterns. Several studies have demonstrated that species richness patterns from the lowest to highest elevations may show a monotonic decrease (Mallen-cooper and Pickering, 2008, Sharma et al., 2009, Trigas et al., 2013), or a monotonic increase (Baruch, 1984); studies have also revealed hump-shaped patterns with a peak in richness at mid-elevations (Acharya et al., 2011, Ren et al., 2012). However, some researchers have shown that species richness is lowest at mid-elevations (Peet, 1978), while others have found no clear relationship between species richness and elevation (Lovett, 1999). Moreover, Currie and Kerr (2008) revealed that broad scale observations are not consistent with hump-shaped (mid-domain effect) patterns. Nevertheless, several studies support the hump-shaped pattern and monotonic decline of species richness along an elevation gradient (Rahbek, 2005). Although elevation is a major variable in species richness, it has been suggested that these patterns of species richness should be discussed in relation to other environmental variables (Grytnes, 2003, Krner, 2004, Rahbek, 2005).
Successful conservation and management of plant diversity requires an explicit exploration of plant species richness patterns and an understanding of the factors that govern these patterns. Although Ethiopia is endowed with very diverse topography and biodiversity, few studies have examined elevational patterns of plant species richness. Studies to date (Aynekulu et al., 2012, Berhanu et al., 2016, Desalegn and Beierkuhnlein, 2010, Woldu et al., 1989) underrepresent the geography as well as the diversity of the country. Furthermore, the elevational patterns of species richness reported in previous studies have shown irregular (Desalegn and Beierkuhnlein, 2010), hump-shaped (Aynekulu et al., 2012), and monotonically decreasing patterns of species richness (Berhanu et al., 2016).
Abune Yosef mountain range (maximum elevation 4284 m above sea level (m a.s.l.)) has a complex landscape. The ecological quality of the mountain range is highly degraded and remnant vegetation is found only in very small patches located in either Ethiopian Orthodox Tewahido church forests or areas inaccessible to farmers (Gebrehiwot et al., 2018). Nevertheless, these areas face severe anthropogenic pressure, including agricultural expansion, which particularly threatens the Afroalpine belt (Gebrehiwot et al., 2018). Temperature and rainfall variability also contribute to the vulnerability of the vegetation remnants of the mountain range. However, to the best of our knowledge, no studies have examined plant species richness patterns on the Abune Yosef mountain range.
Quantitative description of vegetation is considered key to conservation planning and prioritization. In this research paper, our aim is to assess the plant species richness patterns along an elevational gradient in the Abune Yosef mountain range. For this purpose, we first determined whether there are significant differences in floristic composition, diversity, and endemic species richness between key vegetation types in the Abune Yosef mountain range (i.e., Afroalpine grassland, the Dry evergreen Afromontane forest, and Ericaceous forest). Next, we determined whether species richness, diversity, or endemism change along the elevation gradient and vegetation types. Finally, we quantified vascular plant diversity along the Abune Yosef elevation gradient.
2. Materials and methods 2.1. Study areaThe study area is located in Amhara Regional State, North Wollo Zone, Lasta district at a latitude of 12°08′07″ N and longitude 39°15′07″ E (Fig. 1). Its elevation reaches 4284 m a.s.l. The high plateaus of Ethiopia formed 45 million years ago from tertiary uplift followed by volcanism and form basalt layers (Hendickx et al., 2014, Rosqvist, 1990). Enduring volcanic activity resulted in the building up of the high mountains of northern Ethiopia which include a few of the highest peaks such as Abune Yosef (Billi, 2015). The soil type in the high mountain areas, Afroalpine grassland, and Ericaceous belt is dominantly andosols. However, vertisols have also been reported (Gebrehiwot et al., 2018). The region has a bimodal rainfall pattern, with an annual rainfall of 790 mm and monthly minimum and maximum temperature of 7.9 and 24.7 ℃, respectively (Gebrehiwot et al., 2018).

|
| Fig. 1 Map of Lasta district: the red dots depict sample plots |
At an elevational range that extends from 1581 to 4284 m a.s.l. different vegetation types are recognized in the Abune Yosef mountain range (AYMR), viz., Dry evergreen Afromontane forest and grassland complex (DAF) with subtypes, dry single-dominant Afromontane forest of the Ethiopian highlands (DAF/SD) and Afromontane woodland, wooded grassland and grassland (DAF/WG)), Afroalpine grasslands (AA) and Ericaceous belt (EB). Due to ease of access, the lower and middle elevations are prone to anthropogenic disturbances and are converted into agricultural land and settlements.
The lower elevational belt which is a moderately warm zone is found at elevations between 1581 and 2500 m a.s.l., and is Afromontane woodland, wooded grassland and grassland (DAF/WG) (Saavedra and Díaz, 2009). This vegetation type includes the following species: Acacia species such as Acacia abyssinica, Acacia etbaica, Acacia tortilis, Croton macrostachyus, Cordia africana, Euclea racemosa, Otostegia integrifolia, Dodonaea angustifolia and grasses such as Hyparrhenia. The presence of other species (E. racemosa, O. integrifolia, and D. angustifolia) indicate environmental degradation.
Dry single-dominant Afromontane forest of the Ethiopian highlands (DAF/SD) and Ericaceous Belt (EB) are found at an elevation 2500–3500 m a.s.l. Characteristic plant species like Juniperus procera, Olea europaea subsp. Cuspidata and Colutea abyssinica are found commonly in the DAF/SD. In the EB Erica arborea, Myrica salicifolia, Hagenia abyssinica, Hypericum revolutum, Hypericum quartinianum and some Helichrysum species such as H. schimperi are commonly found. Both the DAF/SD and EB are represented by a very small natural vegetation (patches) in the Abi C'agula Ericaceous forest and some church forests such as Yimrehane Kristos Juniperusforests and Neakute Leab DAF/SD in which O. europaea is dominant.
Elevations above 3500 m a.s.l. are considered potential Afroalpine grasslands; however, because much of this land has been converted into agricultural plots, these grasslands may only occur above 3700 m a.s.l. This vegetation type is represented by characteristic plant species such as the genera Alchemilla, Helichrysum, Senecio, Carex, Festuca, and the endemic giant Lobelia (Lobelia rhynchopetalum). Afroalpine vegetation harbors numerous endemic plants. In the AYMR, the Afroalpine ecosystem has been reduced over the last decades and currently only occurs above 3700 m a.s.l. only. Agricultural practices are not uncommon at an elevation of near 3800 m a.s.l. The Afroalpine ecosystem covers only 3700 ha (Gebrehiwot et al., unpublished).
2.2. Data collectionAfter a reconnaissance survey in March–April, 2016, three vegetation patches viz. Afroalpine grassland (AA) (Supplementary Fig. 1A & B), Ericaceous forest (EB) (Supplementary Fig. 1C & D), and Dry evergreen Afromontane forest (DAF) (Supplementary Fig. 1E & F), each with their own particular physiognomy and management systems, were selected for the study (Table 1). The vegetation types are natural (AA and EB) and semi-natural (DAF). Data were collected during December 2017, March 2018, and October 2018. The mountain range vegetation is highly degraded and the natural vegetation cover has been converted to other land use types. Consequently, there is a huge discontinuity in the natural vegetation (Fig. 1), particularly, from 3300 to 3800 m a.s.l. Sample plots were established following transects along an elevation gradient at 100 m intervals within the patches selected. Within each study site, we placed sample plots of 1-m by 1-m, 5-m by 5-m, and 20-m by 20-m, respectively, for herbs, shrubs, and trees. Species cover-abundance in each sample plot was estimated visually in the field and later transformed according to van der Maarel (1979) ordinal transform values (OTV).
| Characteristics | Vegetation types | ||
| DAF/SD | EB | AA | |
| Plots sampled | 15 (17.65%) | 25 (29.41%) | 45 (52.94%) |
| Area (ha) sampled | 0.6 | 1.0 | 0.1 |
| Elevation (m a.s.l.) | |||
| Range | 2571–2973 | 3014–3285 | 3834–4168 |
| Mean | 2740.6 ± 131.5 | 3189.7 ± 71.2 | 3993.2 ± 95.7 |
| Slope range | High | Very high | Medium |
| Disturbance level | Medium | Medium | High |
| Management type | Church forest | aPrivately managed | Community based conservation |
| DAF, Dry evergreen Afromontane forest; EB, Ericaceous forest; AA, Afroalpine grasslands. aEB is managed by a local investor, operating without rules and regulations instituted by the local government. There is little coordination/collaboration between the local investor and the local government. The investor, who pays the salaries of the guards, protects the forest of his own initiative. |
|||
All plant species within the plot were collected, pressed, dried and identified. Plant species identification was performed following the Flora of Ethiopia and Eritrea (FEE) at the National Herbarium (ETH) and through consultation with experts. Voucher specimens have been deposited at ETH.
2.3. Data analysisSpecies richness estimation and rarefaction were computed using vegan package and function estimateR. The influence of elevation on vascular plant species pattern was better determined by running linear models (LMs).
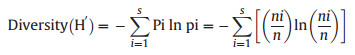
Plant community classification was described and identified by agglomerative hierarchical clustering (AHC) using similarity ratio and Ward's minimum variance clustering methods (Borcard et al., 2018). Association of species and sample plots were described by indicator species (Cáceres and Legendre, 2009). Shannon diversity index (H′) was employed to determine vascular plant species diversity (equations. (1), (2))).
|
(1) |
where s is the number of species, pi is the proportion of individuals or the abundance of the ith species, and ln = log basen; ni is the number of individuals belonging to ith of S species in the sample and n is the total number of individuals in the sample.
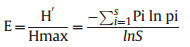
Any base of logarithms may be taken, with log2 and log10 being the most popular choices. The choice of log base must be kept constant when comparing diversity between samples. Values of the index usually lie between 1.5 and 3.5, although in exceptional cases, the value can exceed 4.5. According to Shannon equitability or evenness index (E), evenness is calculated as follows (equation (2)):
|
(2) |
The higher the value of E the more even the species is in their distribution within the quadrat.
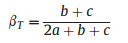
Vascular species turnover (β−diversity) along the elevation gradient were determined following Wilson and Shmida (1984) which is quantified as (equation (3)):
|
(3) |
where βT is Wilson and Shmida's beta turnover/diversity, a is the total number of species that occur in both sites, b represents species occurring exclusively in the second site, and c those found only in the focal site. This diversity index was chosen because it is not influenced by alpha diversity or sample size.
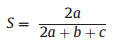
Comparisons of floristic composition were computed following Sørensen's coefficient of similarity (Sørensen, 1948), which was calculated as (equation (4)):
|
(4) |
where a = the species found both in site b and c, b = the species found in site b, and c = the species found in site c. The closer Sørensen's coefficient of similarity to 1 the more similar the sites are. This similarity coefficient was selected because it gives weight to species that exist in both sites. Outliers, seven species that are present in all vegetation types are removed from the analysis.
The plant diversity, endemic richness and vascular plant species richness of the vegetation types were compared using one-way analysis of variance (ANOVA) and Tukey's Honest Significant Difference [HSD] test.
The analysis was done using R packages viz. labdsv, cluster, vegan, mgcv, and ggplot2 (R Core Team, 2018) and IBM SPSS Statistics for Windows (IBM SPSS, 2016).
3. Results 3.1. Elevational richness patterns of vascular species and comparisons between vegetation typesOne hundred ninety-nine vascular plant species belonging to 64 families and 155 genera respectively were recorded in AYMR (Supplementary T1). The most species-rich families include Asteraceae 42 (21.1%), Poaceae 15 (7.5%), Lamiaceae 12 (6.03%) and Fabaceae 11 (5.5%). In contrast, thirty two families were represented by a single species. Trees, shrubs, herbs, and lianas comprise 17 (8.54%), 32 (16.08%), 146 (73.37%) and 4 (2.01%). Of these, 21% are endemic. Although very few species have a wide distribution, most of the species have a very restricted distribution along the elevation gradient. Seven species (3.54%) are distributed in all the vegetation types, 26 species (12.63%) occurred in DAF and EB, 4 species (2.02%) were found in DAF and AA, and 8 (4.04%) were found in DAF and AA. The species accumulation from observed species richness and abundance-based richness estimators are shown in Fig. 2.

|
| Fig. 2 Species richness accumulation curves and 95% confidence intervals for plant communities using two abundance-based estimators |
The pattern of observed species richness, Shannon diversity, and Shannon evenness along the elevation gradient followed a monotonic decline towards higher elevation (R2 = 0.50, P < 0.05, R2 = 0.47, P < 0.05, R2 = 0.06, P < 0.05 respectively) (Fig. 3A, D, & E). Nonparametric estimations of species richness (i.e., Chao1 and ACE) confirmed this pattern.

|
| Fig. 3 Download full-size image |
Vascular plants species richness was lower in the AA than the DAF and EB (P = 0.01) (Fig. 4). Average species richness was 18.46 (SE = 1.05) in DAF, 17.36 (SE = 1.10) in EB, and 9.15 (SE = 0.46) in AA. Similarly, vascular plant species diversity was lower in AA than the DAF and EB (P < 0.05). In contrast, the endemic vascular plants richness was significantly higher in the AA than in the DAF and EB (P < 0.01). The average endemic richness of DAF, EB and AA was 3.13 (SE = 0.4), 2.84 (SE = 0.28) and 3.9 (SE = 0.21) respectively (Fig. 4). Elevation showed a significant impact on the richness, diversity, and endemism of the vascular plants (P < 0.05).

|
| Fig. 4 Average (a) species richness, (b) endemic species richness, and (c) Shannon diversity index in the vegetation types. DAF, Dry evergreen Afromontane forest; EB, Ericaceous forest; AA, Afroalpine grasslands. (ANOVA and Tukey's HSD; P < 0.05) |
The Sørensen's coefficient of similarity revealed that the highest similarity was recorded between the Dry evergreen Afromontane forest and Ericaceous forest (32%), followed by Ericaceous forest and Afroalpine grassland (16%). Only 6% similarity was recorded between the Dry evergreen Afromontane forest and Afroalpine grassland. The species shared between Dry evergreen Afromontane forest and Ericaceous forest, Ericaceous forest and Afroalpine grassland, Dry evergreen Afromontane forest and Afroalpine grassland are 26, 8 and 4 respectively.
3.2. Vascular plant endemism along an elevation gradientThe endemic vascular plants distribution showed a linearly increasing pattern towards higher elevation (Fig. 3F). Higher endemic plant species richness was recorded at about 3000 and 4000 m a.s.l. Surprisingly, Tagetes minuta, Chenopodium murale, and Galinsoga quadriradiata are the only exotic species recorded along the gradient.
3.3. Vascular plant species turnover along elevation gradientThe highest and lowest Wilson and Shmida's β−diversity is 0.27 and 1.0 respectively (Fig. 5). The mean β−diversity was found to be 0.86. Although complete replacement of species composition (β=1) was documented in all of the vegetation types, it was pronounced between the AA grassland and DAF/SD (Fig. 5).

|
| Fig. 5 Species turnover (β−diversity) in Abune Yosef mountain range |
Tree species richness followed a monotonic increase up to 3300 m a.s.l. (Fig. 6). Above this elevation, not even one tree was recorded above this elevation. Maximum tree richness was found at about 3100 m a.s.l. Shrubs followed an almost similar trend as trees (Fig. 6). The shrubs are distributed in all the vegetation types, although Euryops pinifolius was the dominant shrub found in the AA grassland. Maximum shrub richness was recorded at an elevation of about 3100 m a.s.l. Herb plants species richness followed a different pattern from all other growth forms. The herbaceous plant species richness showed an inverted hump-shaped pattern (Fig. 6). Herbaceous species richness was low at the medium elevations, where as at both the lower and higher elevations herbaceous species richness was higher. The lianas followed the same pattern as trees i.e., a monotonic increase up to a mid-elevation and monotonic decline towards higher elevation (Fig. 6).

|
| Fig. 6 Elevation pattern of growth forms |
Five plant communities were identified and described from agglomerative hierarchical cluster analysis (Fig. 7). The communities were named after two indicator species. Species with a significance level of P ≤ 0.05 were chosen for naming plant communities. The synoptic table and P-value of indicator species is shown in Table 2. These communities are described below.

|
| Fig. 7 Plant communities along the elevation gradient |
| C 1 | C 2 | C 3 | C 4 | C 5 | P-value | |
| Euryops pinifolius | 7.24 | 6.92 | 6.67 | 0.00 | 0.00 | 0.001 |
| Kniphofia foliosa | 5.82 | 5.00 | 5.50 | 0.00 | 0.00 | 0.001 |
| Cardamine hirsuta | 4.33 | 3.00 | 5.50 | 0.00 | 0.00 | 0.006 |
| Artemisia abyssinica | 4.00 | 0.00 | 0.00 | 0.00 | 0.00 | 0.74 |
| Senecio farinaceus | 4.00 | 1.00 | 0.00 | 0.00 | 0.00 | 0.77 |
| Ranunculus multifidus | 4.00 | 1.00 | 5.33 | 0.00 | 0.00 | 0.01 |
| Festuca macrophylla | 4.00 | 0.00 | 4.50 | 3.00 | 0.00 | 0.03 |
| Lobelia rhynchopetalum | 4.62 | 6.77 | 6.33 | 0.00 | 0.00 | 0.00 |
| Festuca simensis | 2.50 | 5.00 | 4.67 | 0.00 | 4.00 | 0.17 |
| Epilobium stereophyllum | 1.00 | 4.00 | 0.00 | 0.00 | 0.00 | 0.49 |
| Haplocarpha rueppellii | 3.43 | 4.00 | 2.75 | 0.00 | 0.00 | 0.10 |
| Festuca abyssinica | 4.14 | 4.00 | 5.00 | 0.00 | 0.00 | 0.10 |
| Senecio schultzii | 3.00 | 3.14 | 5.00 | 0.00 | 0.00 | 0.05 |
| Hypericum quartinianum | 0.00 | 0.00 | 9.00 | 3.75 | 0.00 | 0.36 |
| Becium grandiflorum | 0.00 | 0.00 | 7.00 | 4.42 | 0.00 | 0.00 |
| Rumex nervosus | 0.00 | 0.00 | 6.00 | 0.00 | 6.00 | 0.83 |
| Hypoestes forskaolii | 0.00 | 0.00 | 6.00 | 0.00 | 2.67 | 0.00 |
| Olea europaea L. subsp. Cuspidata | 0.00 | 0.00 | 6.00 | 1.00 | 4.00 | 0.00 |
| Erica arborea | 0.00 | 0.00 | 0.00 | 6.29 | 0.00 | 0.00 |
| Vernonia rueppellii | 0.00 | 0.00 | 0.00 | 5.43 | 0.00 | 0.00 |
| Myrica salicifolia | 0.00 | 0.00 | 0.00 | 5.22 | 0.00 | 0.00 |
| Nuxia congesta | 0.00 | 0.00 | 0.00 | 5.20 | 0.00 | 0.01 |
| Hypericum revolutum | 0.00 | 0.00 | 0.00 | 5.08 | 0.00 | 0.00 |
| Hagenia abyssinica | 0.00 | 0.00 | 0.00 | 5.00 | 0.00 | 0.21 |
| Juniperus procera | 0.00 | 0.00 | 0.00 | 4.08 | 7.14 | 0.00 |
| Osyris quadripartita | 0.00 | 0.00 | 0.00 | 1.33 | 6.00 | 0.04 |
| Calpurnia aurea | 0.00 | 0.00 | 0.00 | 0.00 | 5.20 | 0.00 |
| Buddleja polystachya | 0.00 | 0.00 | 0.00 | 4.50 | 5.00 | 0.48 |
| Allophylus abyssinicus | 0.00 | 0.00 | 1.00 | 5.00 | 5.00 | 0.37 |
| Thalictrum schimperianum | 0.00 | 0.00 | 0.00 | 0.00 | 5.00 | 0.48 |
| Asplenium aethiopicum | 0.00 | 0.00 | 0.00 | 0.00 | 5.00 | 0.07 |
| Hypoestes triflora | 0.00 | 0.00 | 0.00 | 0.00 | 4.60 | 0.00 |
Ⅰ. Euryops pinifolius – Kniphofia foliosa community
Community 1 occurs in the Afroalpine vegetation at elevation between 3834 and 4168 m a.s.l. This community consists of 21 plots and 58 species. The shrub layer is dominated by E. pinifolius where as the herbaceous layer is dominated by K. foliosa, Cardamine hirsuta, Artemisia abyssinica, Festuca macrophylla, and Senecio farinaceus.
Ⅱ. Lobelia rhynchopetalum – Festuca simensis community
This community is found at an elevation range between 3904 and 4164 m a.s.l. Similar to community 1, the L. rhynchopetalum-F. simensis community is found in the AA grassland. The community consists of 12 plots and 39 species. The shrub layer is dominated by a thicket of E. pinifolius whereas the herbaceous layer is dominated by F. simensis, Epilobium stereophyllum, Haplocarpha rueppellii, Festuca abyssinca, and Senecio schultzii.
Ⅲ. Becium grandiflorum – Olea europaea L. subsp. cuspidata community
Unlike community 1 and 2, the B. grandiflorum-O. europaea L. subsp. cuspidatacommunity has a wider range which is found in three vegetation type viz. EB, DAF, and AA between 2629 and 4006 m a.s.l. This community comprises 12 plots and 60 species. Whereas, the shrub layer is dominated by B. grandiflorum and Rumex nervosus, the tree layer is dominated by H. quartinianum and O. europaea L. subsp. cuspidata. The herbaceous layer is covered by Hypoestes forskaolii.
Ⅳ. Erica arborea – Vernonia rueppellii community
This community is found at the mid-elevation along the gradient between 3056 and 3275 m a.s.l. The community found in the EB, which has a very steep slope. This community consists of relatively numerous plots (23) and species (68). The tree layer consists of E. arborea, V. rueppellii, M. salicifolia, H. abyssinica, H. revolutum. The shrub layer is dominated by Rosa abyssinica, Asparagus africanus, and Inula confertiflora. A very common fern, Dryopteris schimperiana, was also found in this community. The herbaceous species Scabiosa columbaria is found in the three vegetation types.
Ⅴ. Juniperus procera – Osyris quadripartita community
This community is found in the Ethiopian Orthodox Tewahido church in a DAF/SD vegetation type in which J. procera is the dominant tree. This community is found between 2571 and 2953 m a.s.l. and consists of 13 plots and 100 species. The dominant woody species include O. europaea and Clutia lanceolata as well as J. Procera, Allophylus abyssinicus, Buddleja polystachya, Calpurnia aurea and O. quadripartita. Common herbaceous plants in this community include Achyranthes aspera, Thalictrum schimperianum, and Hypoestes triflora. A very conspicuous herb, Delphinium dasycaulon, was also recorded in this community.
4. Discussion 4.1. Elevational richness patterns of vascular species and comparisons between vegetation typesIn the present study, we showed that vascular plant species richness declines monotonically from the lowest to highest elevations in the Abune Yosef mountain range. We found that Dry evergreen Afromontane forest and Ericaceous forest, which are lower elevation vegetation types, had higher Shannon diversity values than did Afroalpine grassland, which is a higher elevation vegetation type.
Our finding that vascular plant species richness decreases monotonically along an elevation gradient is consistent with previous studies (Mallen-cooper and Pickering, 2008, Sharma et al., 2009, Trigas et al., 2013, Yang et al., 2014, Zhang et al., 2016). However, most research on elevation patterns of species richness have revealed a hump-shaped pattern (Acharya et al., 2011, Aynekulu et al., 2012, Guo et al., 2013, Lee et al., 2013, Manish et al., 2017, Ren et al., 2012). This may be attributed to the favorable mild environmental conditions for plant growth at middle elevation (Zhang et al., 2016) despite the management and disturbance levels along an elevation gradient. The mid-domain effect, which displays this hump-shaped pattern, is highly pronounced in the transition of montane forests to Afroalpine vegetation types (Becker et al., 2007).
Our finding that in Dry evergreen Afromontane forest and Ericaceous forest Shannon diversity is higher than in the Afroalpine grasslands indicates that vascular plant species richness and relative abundance is higher at low elevations than high elevations (Sharma et al., 2009). This finding is consistent with previous work that shows that species richness is negatively correlated with elevation (Sharma et al., 2009).
We also found that Dry evergreen Afromontane forest and Ericaceous forest were the most similar vegetation types. Considering the elevation overlap and geographical affinity between the Dry evergreen Afromontane forest and Ericaceous forest in Ethiopia, in general, and the current study in particular, high similarity is expected. Our results are similar to a floristic comparison on woody species composition of the flora of Ethiopia and Eritrea (Friis et al., 2010).
Previous research has suggested that elevational patterns of plant diversity may be influenced by climate, biotic processes, environmental heterogeneity, and evolutionary history (McCain and Grytnes, 2010). In the Abune Yosef mountain range, higher elevations are cool and wet, whereas lower elevations are hot and dry. Thus, the monotonic decrease in vascular plant richness in the Abune Yosef Mountain range may be explained by local climatic conditions.
However, an additional explanation for the monotonic decline in vascular plant species richness with increasing elevation may be related to management intensification. For example, Dry evergreen Afromontane forest has been managed by the Ethiopian Orthodox Tewahido church for centuries. Ericaceous forest is also managed, although privately. Furthermore, the Ericaceous forest is found in a very steep terrain that is not suitable for human activities such as settlement and agriculture. Conservation of Afroalpine grassland has not been as effective as that of Dry evergreen Afromontane forest and Ericaceous forest. This is likely because Afroalpine grassland conservation has a very short history and is community-based. Consequently, the Afroalpine grasslands are subject to more disturbance, including overgrazing.
4.2. Vascular plant endemism along an elevation gradientVascular plant species endemism pattern along an elevation gradient may or may not correspond to vascular plant species richness pattern. Spatial heterogeneity and extreme microclimates such as moisture and temperature host higher endemic plants and animals. Specialists with a very narrow niche are found in such environments. However, the monotonic decrease of species richness towards higher elevation does not necessarily reflect the monotonic decrease in endemic vascular plant species. In fact, we found that the elevational richness patterns of endemic vascular plants increase linearly from low to high elevations. This linear increase in endemic vascular plant species may be explained by the spatial heterogeneity and extreme microclimates along elevation gradients, which are known to host higher endemic plant and animal species. Specialists with narrow niches are found in such environments.
Our finding is consistent with previous studies that have shown that high numbers of endemic plants occur at high elevations and can be attributed to the isolation of mountain zones just as high species richness at lower elevations can be attributed to evolution and dispersal (Steinbauer et al., 2016, Vetaas and Grytnes, 2002). Furthermore, high numbers of endemic plants at higher elevations (Steinbauer et al., 2016) and mid-elevations (Manish et al., 2017, Trigas et al., 2013, Wang, 2007) have been reported in different continents.
4.3. Vascular plant species turnover along an elevation gradientOur results also show that there is high vascular species turnover between the vegetation types along an elevation gradient. Specifically, we found that beta diversity of the study area is very high. This finding indicates that there is high species diversity in the study area (Ricotta, 2017), in which the vegetation types have almost distinctive species composition. Similar vegetation types and near sites may share similar species composition, which leads to low beta diversity; in contrast, different vegetation types and extreme sites may not share high species composition which would lead to high beta diversity. High beta diversity of extreme elevation pairs has been reported from northern Ethiopia (Aynekulu et al., 2012). Apart from the spatial scale, sites within the same vegetation types could have high beta diversity due to topographic and microclimatic variations. Variables that influence 100% replacement of species composition in the Afroalpine grassland include soil texture, elevation, and aspect. Geographical distance and microclimate have a crucial impact on beta diversity (Mantilla-Contreras et al., 2012, Opedal et al., 2015).
4.4. Elevational richness of growth formsWe found that elevational richness patterns for various growth forms differed. Specifically, tree species richness increased monotonically up to 3300 m a.s.l., and then declined at higher elevations (Fig. 6). Trees are often absent at higher elevation due to several constraints, such as the environment, a regional lack of capable species, or a multitude of disturbances (Krner, 2012). Thus, trees are usually common at lower elevation, although tree species richness can also be affected by anthropogenic disturbances. Our findings are similar to findings from the eastern Himalayas (Acharya et al., 2011), Tibetan Plateau (Mao et al., 2018), Baekdudaegan Mountains (Lee et al., 2013) and Ethiopia (Berhanu et al., 2016).
Although species richness was higher in shrubs than in trees, the elevational richness pattern of shrub species was similar to that of trees, i.e., increased along the elevation gradient, then decreasing after 3300 m (Fig. 6). This could be attributed to the open canopy cover and biotic homogenization (Mori et al., 2018, Zhang et al., 2016). This explanation is supported by reports from mountain forests of northern China (Zhang et al., 2016) and sub-alpine mountainous zone in central Japan (Tsujino and Yumoto, 2013). Higher shrub than tree species richness may also be due to selective cutting of trees for various purposes, including construction, timber, and firewood, together with local climatic variation.
The elevational richness pattern of herb plant species was different than other growth forms. Herbaceous plant species richness along the elevation gradient had an inverted hump shape, with low richness at medium elevations (Fig. 6). The inverted hump-shaped pattern of the herbaceous plant species richness could be attributed to inter-specific competition, which may be the main driver of plant community assembly at the middle elevations (Zhang et al., 2016). Furthermore, our finding indicates that the mountain range is rich in herbaceous plants capable of adapting to extreme environments. The lower elevations (DAF) have relatively lower moisture levels and higher temperatures than the higher elevations (AA), which have very low temperatures and high moisture levels. As perfectly described by Hedberg (1964) the AA grassland is "summer every day and winter every night." The herbaceous plants in the AA grassland have almost completely different life forms from the lower elevation plants. This includes giant rosette, tussock grasses, acaulescent, and cushion plants.
The lianas followed the same pattern as trees, i.e., a monotonic increase up to a mid-elevation and monotonic decline towards higher elevation (Fig. 6). The pattern of liana richness corresponds to the pattern of trees because lianas often climb on trees and rarely on shrubs. Consequently, no liana was recorded in the AA grassland whereas in the DAF and EB very few lianas were recorded.
5. ConclusionVascular plant species richness, diversity, endemism, species turnover and taxonomic richness pattern along elevation gradient was documented for an area in which its floristic composition was not explicitly compiled. As a result, 199 vascular plants were recorded. The pattern of observed species richness, Shannon diversity and Shannon evenness along the elevation gradient followed a monotonic decline towards higher elevation. Similarly, the non-parametric species richness, Chao1 and ACE, showed a monotonic decline towards higher elevation. On the other hand, endemic plants richness showed a linear increase toward higher elevation. Furthermore, tree, liana and shrubs showed monotonic increase up to a certain elevation before declining. Herbs, on the other hand, showed an inverted hump-shaped pattern.
Differences in these elevational patterns of plant richness, diversity, endemism, and growth forms may due to management practices, spatial heterogeneity/topographic diversity, and/or microclimate. The high elevation, Afroalpine grassland, was found to host higher endemic and rare plants while harboring lower species richness. Thus, we recommend that the management intensity of the Afroalpine grassland receive increased attention. The local government and the community should collaborate for the better management of the grassland.
Conflict of interestThe authors declare no conflict of interest.
AcknowledgmentsWe are very grateful for Addis Ababa University office of vice president for research and Technology transfer for funding the thematic research, "Integrated approaches of Molecular Systematics and plant Biodiversity Informatics to Climate Change Mitigation and Monitoring in Ethiopian Mountains". The first author is grateful for the local people for their hospitality and kindness during the field work.
Appendix A. Supplementary dataSupplementary data to this article can be found online at https://doi.org/10.1016/j.pld.2019.06.005.
Acharya B.K., Chettri B., Vijayan L., 2011. Distribution pattern of trees along an elevation gradient of Eastern Himalaya, India. Acta Oecol, 37: 329-336. DOI:10.1016/j.actao.2011.03.005 |
Aynekulu E., Aerts R., Moonen P., Denich M., Gebrehiwot K., Vagen T.-G., Mekuria W., Boehmer H.J., 2012. Altitudinal variation and conservation priorities of vegetation along the Great Rift Valley escarpment, northern Ethiopia. Biodivers. Conserv, 21: 2691-2707. DOI:10.1007/s10531-012-0328-9 |
Baruch, Z., 1984. Ordination and classification of vegetation along an altitudinal gradient in the Venezuelan Paramos. Vegetation 55, 115-126.
|
Becker A., Korner C., Brun J.-J., Guisan A., Tappeiner U., 2007. Ecological and land use studies along elevational gradients. Mt. Res. Dev, 27: 58-65. DOI:10.1659/0276-4741(2007)27[58:EALUSA]2.0.CO;2 |
Berhanu, A., Woldu, Z., Demissew, S., 2016. Elevation patterns of woody taxa richness in the evergreen Afromontane vegetation of Ethiopia. J. For. Res. https://doi.org/10.1007/s11676-016-0350-y.
|
Billi, P., 2015. Geomorphological landscapes of Ethiopia. In: Billi, P. (Ed.), Landscapes and Landforms of Ethiopia, World Geomorphological Landscapes. Springer Science+Business Media, Dordrecht.
|
Borcard, D., Gillet, F., Legendre, P., 2018. Numerical Ecology with R, Second. Springer International Publishing AG.
|
Currie D., Kerr J., 2008. Test of the mid-domain hypothesis:a review of the evidence. Ecol. Monogr, 78: 3-18. DOI:10.1890/06-1302.1 |
Desalegn W., Beierkuhnlein C., 2010. Plant species and growth form richness along altitudinal gradients in the southwest Ethiopian highlands. J. Veg. Sci, 21: 617-626. DOI:10.1111/j.1654-1103.2010.01177.x |
De Cáceres, M., Legendre, P., 2009. Associations between species and groups of sites: indices and statistical inference. Ecology 90, 3566-3574. https://doi.org/10.1890/08-1823.1.
|
Friis, I., Demissew, S., van Breugel, P., 2010. Atlas of the Potential Vegetation of Ethiopia Atlas of the Potential Vegetation of Ethiopia. The Royal Danish Academy of Sciences and Letters, Denmark.
|
Gebrehiwot K., Dessalegn T., Woldu Z., Demissew S., Teferi E., 2018. Soil organic carbon stock in Abune Yosef afroalpine and sub-afroalpine vegetation, northern Ethiopia. Ecol. Process, 7: 6. DOI:10.1186/s13717-018-0117-9 |
Grytnes J.A., 2003. Ecological interpretations of the mid-domain effect. Ecol. Lett, 6: 883-888. DOI:10.1046/j.1461-0248.2003.00511.x |
Guo Q., Kelt D.A., Sun Z., Liu H., Hu L., Ren H., Wen J., 2013. Global variation in elevational diversity patterns. Sci. Rep, 3: 3007. DOI:10.1038/srep03007 |
Hedberg, O., 1964. Features of Afroalpine Plant Ecology. Almqvist & Wiksells Boktryckeri AB, Uppsala.
|
Hegazy A., Lovett-Doust J., Hammouda O., Gomaa N., 2007. Vegetation distribution along the altitudinal gradient in the northwestern Red Sea region. Community Ecol, 8: 151-162. DOI:10.1556/ComEc.8.2007.2.2 |
Hendickx, H., Jacob, M., Frankl, A., Guyassa, E., Nyssen, J., 2014. Quaternary glacial and periglacial processes in the Ethiopian Highlands in relation to the current afro-alpine vegetation. Zeitschrift für Geomorphol. 1-21. https://doi.org/10.1127/0372-8854/2014/0128.
|
IBM SPSS, 2016. IBM SPSS Statistics for Windows. Version 24.0.
|
Körner, C., 2004. Mountain biodiversity, its causes and function. Ambio 13, 11-17.https://doi.org/10.2307/25094582.
|
Krner, C., 2012. Alpine Treelines: Functional Ecology of the Global High Elevation Tree Limits. Springer, Basel.
|
Lee C., Chun J., Song H., Cho H., 2013. Altitudinal patterns of plant species richness on the Baekdudaegan Mountains, South Korea:mid-domain effect, area, climate, and Rapoport's rule. Ecol. Res, 28: 67-79. DOI:10.1007/s11284-012-1001-1 |
Lovett, J.C., 1999. Tanzanian forest tree plot diversity and elevation. J. Trop. Ecol. 15, 689=694.
|
Mallen-cooper, J., Pickering, C.M., 2008. Linear declines in exotic and native plant species richness along an increasing altitudinal gradient in the Snowy Mountains, Australia. Austral Ecol. 33, 684=690. https://doi.org/10.1111/j.1442-9993.2008.01835.x.
|
Manish K., Pandit M.K., Telwala Y., Nautiyal D.C., Koh L.P., Tiwari S., 2017. Elevational plant species richness patterns and their drivers across non-endemics, endemics and growth forms in the Eastern Himalaya. J. Plant Res, 130: 829-844. DOI:10.1007/s10265-017-0946-0 |
Mantilla-Contreras J., Schirmel J., Zerbe S., 2012. Influence of soil and microclimate on species composition and grass encroachment in heath succession. J. Plant Ecol, 5: 249-259. DOI:10.1093/jpe/rtr031 |
Mao L., Chen S., Zhang J., Zhou G., 2018. Altitudinal patterns of maximum plant height on the Tibetan Plateau. J. Plant Ecol, 11: 85-91. DOI:10.1093/jpe/rtw128 |
McCain, C.M., Grytnes, J.-A., 2010. Elevational gradients in species richness. Encycl. Life Sci. https://doi.org/10.1002/9780470015902.a0022548.
|
Mori A.S., Isbell F., Seidl R., 2018. b-Diversity, community assembly, and ecosystem functioning. Trends Ecol. Evol, 33: 549-564. DOI:10.1016/j.tree.2018.04.012 |
Opedal Ø. H., Armbruster W.S., Graae B.J., 2015. Linking small-scale topography with microclimate, plant species diversity and intra-specific trait variation in an alpine landscape. Plant Ecol. Divers, 8: 305-315. DOI:10.1080/17550874.2014.987330 |
Peet, R.K., 1978. Vegetation analysis. Vegetatio 37, 65-78.
|
R Core Team, 2018. R: A Language and Environment for Statistical Computing. R Foundation for Statistical Computing.
|
Rahbek C., 2005. The role of spatial scale and the perception of large-scale speciesrichness patterns. Ecol. Lett, 8: 224-239. DOI:10.1111/j.1461-0248.2004.00701.x |
Ren X., Yang G., Zhu F., Qin X., Wang D., Liu Z., Feng Y., 2012. Plant communities, species richness and life-forms along elevational gradients in Taibai Mountain, China. Afr. J. Agric. Res, 7: 1834-1848. DOI:10.5897/AJAR11.1322 |
Ricotta C., 2017. Of beta diversity, variance, evenness, and dissimilarity. Ecol. Evol, 7: 4835-4843. DOI:10.1002/ece3.2980 |
Rosqvist G., 1990. Quaternary glaciations in Africa. Quat. Sci. Rev, 9: 281-297. DOI:10.1016/0277-3791(90)90023-4 |
Saavedra, D., Díaz, G., 2009. Vegetation and habitats. In: Saavedra, D. (Ed.), The Abune Yosef Massif: Birds and Mammals of a Hidden Jewel of Ethiopia.Centre de Recursos de Biodiversitat Animal, Universitat de Barcelona, Barcelona.
|
Sharma C.M., Suyal S., Gairola S., Ghildiyal S.K., 2009. Species richness and diversity along an altitudinal gradient in moist temperate forest of Garhwal Himalaya. J. Am. Sci, 5: 119-128. |
Sørensen T., 1948. A method of establishing groups of equal amplitude in plant sociology based on similarity of species content and its application to analyses of the vegetation on Danish commons. Det K. Danske Vidensk. Selsk. Biol. Skr, 5: 1-34. |
Steinbauer M.J., Field R., Grytnes J., Trigas P., Ah-peng C., Attorre F., Birks H.J.B., Borges P.A.V., Cardoso P., Chou C., De Sanctis M., De Sequeira M.M., Duarte M.C., Elias R.B., Price J., 2016. Topography-driven isolation, speciation and a global increase of endemism with elevation. Glob. Ecol. Biogeogr, 25: 1097-1107. DOI:10.1111/geb.12469 |
Trigas, P., Panitsa, M., Tsiftsis, S., 2013. Elevational gradient of vascular plant species richness and endemism in crete-the effect of post-isolation mountain uplift on a continental Island system. PLoS One 8, e59425. https://doi.org/10.1371/journal.pone.0059425.
|
Tsujino R., Yumoto T., 2013. Vascular plant species richness along environmental gradients in a cool temperate to sub-alpine mountainous zone in central Japan. J. Plant Res, 126: 203-214. DOI:10.1007/s10265-012-0520-8 |
van der Maarel, E., 1979. Transformation of cover-abundance values in phytosociology and its effects on community similarity. Vegetatio 39, 97-114.
|
Vetaas, O.R., Grytnes, J., 2002. Distribution of vascular plant species richness and endemic richness along the Himalayan elevation gradient in Nepal. Glob. Ecol.Biogeogr. 11, 291e301. https://doi.org/10.1046/j.1466-822X.2002.00297.x.
|
Wang Z., Tang Z., Fang J., 2007. Altitudinal patterns of seed plant richness in the Gaoligong Mountains, south-east Tibet, China. Divers. Distrib, 13: 845-854. DOI:10.1111/j.1472-4642.2007.00335.x |
Wilson M.V., Shmida A., 1984. Measuring beta diversity with presence-absence data. J. Ecol, 72: 1055-1064. DOI:10.2307/2259551 |
Woldu, Z., Feoli, E., Nigatu, L., 1989. Partitioning an elevation gradient of vegetation from southeastern Ethiopia by probabilistic methods. Vegetatio 81, 189-198.
|
Yang, J.C., Hwang, H.S., Lee, H.J., Jung, S.Y., Ji, S.J., Oh, S.H., Lee, Y.M., 2014. Distribution of vascular plants along the altitudinal gradient of Gyebangsan (Mt.)
|
in Korea. J. Asia-Pacific Biodivers. 7, e40-e71. https://doi.org/10.1016/j.japb.2014.03.008.
|
Zhang, W., Huang, D., Wang, R., Liu, J., Du, N., 2016. Altitudinal patterns of species diversity and phylogenetic diversity across temperate mountain forests of northern China. PLoS One 11, 1-13. https://doi.org/10.1371/journal.pone.0159995.
|