


0 引言
软土的高含水量、低渗透性和高压缩特性使其具有显著的蠕变性。王常明、张先伟等[1-2]提出了软土的蠕变模型,并对不同的软土蠕变数据处理方法进行了对比研究,发现了不同处理方法下蠕变结果的差别。一般将软土的变形分为主固结变形与次固结变形两部分:主固结过程是一个排水固结过程,土体被压密,有效应力增加;次固结过程是指土颗粒的重新排列与结合水膜的蠕变。针对次固结的影响因素,国内外的许多学者做了大量的研究。殷宗泽等[3-5]针对载荷对次固结特性的影响做了研究,得出了超固结土的次固结系数随固结压力变化的规律。Mesri等[6]认为最终固结压力是决定次固结系数大小的因素,与加荷比无关。Nash等[7]通过试验得出了次固结系数与固结压力之间的规律。Leioueil等[8]发现了次固结系数随时间的增长而减小的规律。也有许多学者对次固结特性得出了不一致的结论,比如在固结压力增大的条件下得到的次固结系数的变化规律并不相同[9-12]。可见,软土的次固结特性非常复杂。
从目前来看,软土的变形研究还远未达到完善水平,对软土的次固结特性及影响因素的研究是解决软土地基沉降量过大和不均匀沉降等问题的前提,有比较高的工程应用价值。
本文对取自伊通河谷地区的软土进行了一维固结蠕变试验,并对影响次固结的因素进行了分析,提出了伊通软土次固结系数的计算方法。
1 试样与试验方案 1.1 试样基本物理性质原状土样取自于伊通河漫滩,去掉表层0.5 m左右的覆土,取样深度为覆土下0.3~0.5 m,距地表深度为0.8~1.0 m。根据其塑性指数的大小,该土为粉质黏土,为一种河滩沉积型欠固结软土(文中简称“伊通软土”)。其基本物理力学性质指标如表 1所示。
| 天然密度/ (g/cm3) | 干密度/ (g/cm3) | 天然含水率/ % | 孔隙比 | 塑限含水率/ % | 液限含水率/% | 压缩系数/ (MPa)-1 | 饱和度/ % |
| 1.72 | 1.19 | 44.6 | 1.25 | 23.8 | 34.4 | 1.003 | 100 |
试验是在WG型杠杆式固结仪上进行的。试样高度2 cm,表面积30 cm2。采用分级加荷的方式,加荷比为1,从12.5 kPa到1 600.0 kPa,共8级荷载。规定1 d内变形量不大于0.01 mm时视为变形稳定,然后施加下一级固结压力。压缩试验方案为:12.5 kPa→25.0 kPa→50.0 kPa→100.0 kPa→200.0 kPa→400.0 kPa→800.0 kPa→1 600.0 kPa。
2 软土的次固结特性 2.1 蠕变特性图 1为伊通地区软土层双面排水条件下分级加载蠕变曲线,图 2是应变速率与时间双对数曲线。

|
| ε.应变;t.时间。上图为下图的局部放大图。 图 1 伊通软土应变-时间关系曲线 Figure 1 Strain vs. time curves of Yitong soft soil |
|
|
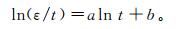
由图 1可见:在固结压力作用下,短时间产生了较大的变形,前60 min变形量达到该级总变形量的90%以上,随后缓慢增长至稳定;随着固结压力的增长,各级固结压力下的总应变随着时间的增长逐渐增至最大。从图 2可以看出,应变速率与时间双对数曲线在各级载荷下具有比较好的线性相关性。各级固结压力下拟合结果见表 2。由表 2的计算结果可以看出, 相关系数(R)均在0.999 00以上。由此可见,伊通软土符合Mitchell的应变速率与时间双对数关系,其拟合方程为
 (1)
(1)

|
| 图 2 伊通软土应变速率与时间双对数关系曲线 Figure 2 Double logarithm curves of strain rate and time of Yitong soft soil |
|
|
| 载荷/kPa | 拟合方程 | 相关系数 |
| 12.5 | ln(ε/t)=-0.899 5ln t-4.278 3 | 0.999 00 |
| 25.0 | ln(ε/t)=-0.948 1ln t-3.426 7 | 1.000 00 |
| 100.0 | ln(ε/t)=-0.968 3ln t-2.396 0 | 0.999 95 |
| 200.0 | ln(ε/t)=-0.974 4ln t-2.001 0 | 0.999 95 |
| 400.0 | ln(ε/t)=-0.979 6ln t-1.689 8 | 1.000 00 |
| 800.0 | ln(ε/t)=-0.984 9ln t-1.444 2 | 1.000 00 |
| 1 600.0 | ln(ε/t)=-0.988 1ln t-1.255 3 | 1.000 00 |
式中,a、b为曲线的拟合参数。实际应用中可以根据拟合方程求得伊通软土在不同固结压力下某一时刻的应变大小。
2.2 应力应变等时曲线为了对伊通软土变形进行进一步研究,将不同固结压力(p)下同一时刻的应变连成曲线,可得到应力-应变等时曲线,如图 3所示。从图 3可以看出:伊通软土的ε-p曲线在固结压力较小(p < 60 kPa)时呈现出线性;p≥60 kPa之后,随着固结压力增大,表现出非线性,曲线斜率逐渐减小,并偏向应力轴。在p < 60 kPa以前,土体原有结构没有被破坏,随着p逐渐增大,孔隙逐渐变小,ε-p基本呈线性关系,软土可以视为黏弹性体;之后随着p继续增大,土体原有结构被破坏,颗粒间接触面积增大,压缩速度越来越慢,ε-p呈非线性,此时软土可视为黏塑性体。

|
| 上图为下图的局部放大图。 图 3 伊通软土应力-应变等时曲线 Figure 3 Isochronous curve of stress-strain of Yitong soft soil |
|
|
根据e-lg t(e为土样孔隙比)曲线会出现反弯点的特点,用Casagrande作图法来确定主次固结的分界点(EOP点),结果如图 4所示。图 5为根据伊通软土一维固结蠕变试验得到的e-lg t曲线,其反映了土体在固结压力作用下的两个过程,可由此划分主固结与次固结阶段。曲线呈反S型,反弯点处即是主固结阶段与次固结阶段的分界点。可以看出伊通软土不同固结压力下的分界点并不相同,伊通软土的分界点为60~100 min。

|
| 图 4 土的一维固结典型e-lg t关系曲线 Figure 4 Typical curves of void ratio versus consolidation time |
|
|

|
| 图 5 伊通软土一维固结e-lg t关系曲线 Figure 5 Curves of one-dimensional e-lg t of Yitong soft soil |
|
|
次固结系数Ca的计算公式为
 (2)
(2) 式中:tp为主固结完成所用时间;tk为次固结系数的计算时间;Δes为tp、tk对应时刻土样孔隙比的差值。
2.4 固结压力对次固结系数的影响次固结系数随固结压力的变化如图 6所示。从图 6可以看出,Ca随着p的增大先迅速增大,达到峰值后逐步减小至稳定:当p从0.0 kPa增至100.0 kPa时,Ca增长了接近3倍,增幅很大;当p超过100.0 kPa再继续增大时,Ca先减小了15%,此后基本保持不变。

|
| 图 6 伊通软土次固结系数-载荷关系曲线 Figure 6 Curves of secondary considation ratio and consolidation pressures of Yitong soft soil |
|
|
通常认为在固结压力小于屈服应力时,土体可视为弹塑性体。分析表明:随着p的增大,土体被压密,孔隙比变化增大,Ca逐渐增大;超过峰值后,随着p增大,原有土体结构破坏,土体压密,土颗粒间接触面积增大,排水困难,速度降低,压缩减慢,则Ca减小;当p继续增大,土体进入稳定蠕变,Ca趋于稳定。这与雷华阳等[9]、李硕等[13]的结论相似。
2.5 次固结系数与压缩指数的关系Walker[14]通过对Leda地区的黏土试验发现,Ca/Cc(Cc为压缩指数)约为0.025。Mesri[15]通过对22种黏土的的试验得出,原状土的Ca/Cc在0.025~0.100之间。
伊通软土的Ca/Cc值大致满足线性关系,其值在0.030~0.043之间,与Mesri[15]得出的结论一致。从图 7可以看出,线性拟合的相关系数R为0.864 6,因此,可以利用Ca/Cc值来大致估算伊通软土的Ca。

|
| 图 7 伊通软土次固结系数与压缩指数的关系曲线 Figure 7 Relationship between secondary considation eoefficient and compression index of Yitong soft soil |
|
|
通过式(2)计算次固结系数时,tk与tp的选取对Ca的大小有很大的影响。从表 3可以看出,不同时段得到的Ca差别较大。在恒定固结压力100 kPa下,得到Ca与tc/tp(tc为次固结结束时间)的关系如图 8所示。
| 时间/min | Ca |
| 30~4 200 | 0.011 9 |
| 30~1 200 | 0.012 7 |
| 1 200~4 200 | 0.009 8 |

|
| 图 8 伊通软土次固结系数与时间的关系曲线 Figure 8 Curves of secondary consolidation coefficient and time under different depths of Yitong soft soil |
|
|
从图 8可以看出:伊通软土的Ca随时间的增加在下降,Ca与tc/tp呈对数关系;Ca的最小值最终达到其最大值的72.3%。分析来看,土体变形随着时间的增加逐渐发展,土体的黏性逐渐得到发展,土体中土颗粒的距离随着变形的发展逐渐减小,土颗粒越来越密实,变形随时间的增长越来越缓慢,即Ca随着时间增加呈对数下降。因此,可以得到两者的对数关系:
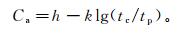 (3)
(3) 式中,h为tc=tp时的次固结系数。
3 结论1) 伊通软土的非线性蠕变性明显,应变速率与时间双对数曲线具有很好的线性相关性。拟合方程相关系数很高,实际应用中可以根据拟合方程求得伊通软土不同固结压力下某一时刻的应变大小。
2) 伊通软土的e-lg t曲线基本上为反S型。次固结系数随着固结压力的增大,先迅速增大,达到峰值后逐步减小至稳定。
3) 伊通软土Ca/Cc值在0.030~0.043之间,大致满足线性关系,线性拟合的相关系数为0.864 6,可以利用Ca/Cc值来大致估算伊通的软土的Ca。
4) 时间对伊通软土次固结系数的影响比较大。随着时间的增长,Ca下降,最终达到最大值的72.3%,且次固结系数随时间的增加均呈对数下降。
| [1] |
张先伟, 王常明, 张淑华. 软土蠕变数据处理方法的对比分析[J].
吉林大学学报(地球科学版), 2010, 40(6): 1401-1408.
Zhang Xianwei, Wang Changming, Zhang Shuhua. Comparative Analysis of Soft Clay Creep Data Processing Method[J]. Journal of Jilin University(Earth Science Edition), 2010, 40(6): 1401-1408. |
| [2] |
王常明, 陈英姿, 张淑华. 软土非线性蠕变压缩模型[J].
吉林大学学报, 2004, 34(4): 420-424.
Wang Changming, Chen Yingzi, Zhang Shuhua. A One-Dimesional Compression Model Considering Nonlinear Creep Characteristics of Marine Soft Soil[J]. Journal of Jilin University(Earth Science Edition), 2004, 34(4): 420-424. |
| [3] |
殷宗泽, 张海波, 朱俊高, 等. 软土的次固结[J].
岩土工程学报, 2003, 25(5): 521-526.
Yin Zongze, Zhang Haibo, Zhu Jungao, et al. Secondary Consolidation of Soft Soil[J]. Chinese Journal of Geotechnical Engineering, 2003, 25(5): 521-526. |
| [4] |
余湘娟, 殷宗泽, 董卫军. 荷载对软土次固结影响的试验研究[J].
岩土工程学报, 2007, 29(6): 913-916.
Yu Xiangjuan, Yin Zongze, Dong Weijun. Influence of Load on Secondary Consolidation Deformation of Soft Soils[J]. Chinese Journal of Geotechnical Engineering, 2007, 29(6): 913-916. |
| [5] | Yin J H, Graham J. Elastic Visco-Plastic Modelling of One-Dimensional Consolidation[J]. Géotechnique, 1996, 46(3): 515-527. DOI:10.1680/geot.1996.46.3.515 |
| [6] | Mesri G, Ajlouni M A, Feng T W, et al. Surcharging of Soft Ground to Reduce Secondary Settlement[C]//Lee C C, Lau C K, Ng C W W, et al. Proceeding of the Third International Conference on Soft Soil Engineering. Hong Kong: Balkema, 2001: 55-65. |
| [7] | Nash D F T, Sills G C, Davison L R. One-Dimen-sional Consolidation Testing for Soft Clay from Bothkennar[J]. Geotechnique, 1992, 42(2): 241-256. DOI:10.1680/geot.1992.42.2.241 |
| [8] | Leroueil S, Kabbaj M, Tavenas F, et al. Stress-Strain-Strain Rate Relation for the Compressibility of Sensitive Natural Clays[J]. Geotechnique, 1985, 35(2): 159-180. DOI:10.1680/geot.1985.35.2.159 |
| [9] |
雷华阳, 肖树芳. 天津软土的次固结变形特性研究[J].
工程地质学报, 2002, 10(4): 385-389.
Lei Huayang, Xiao Shufang. Study on Secondary Consolidation Deformation Characteristics of Soft Soil in Tianjin[J]. Journal of Engineering Geology, 2002, 10(4): 385-389. |
| [10] |
周秋娟, 陈晓平. 软土次固结特性试验研究[J].
岩土力学, 2006, 27(3): 404-408.
Zhou Qiujuan, Chen Xiaoping. Test Study on Properties of Secondary Consolidation of Soft Soil[J]. Rock and Soil Mechanics, 2006, 27(3): 404-408. |
| [11] |
侯晓亮, 赵晓豹, 李晓昭. 南京河西地区软土次固结特性试验研究[J].
地下空间与工程学报, 2009(5): 888-892.
Hou Xiaoliang, Zhao Xiaobao, Li Xiaozhao. Study on Secondary Consolidation Deformation Characteristics of Soft Soil at Hexi Region in Nanjing[J]. Chinese Journal of Underground Space and Engineering, 2009(5): 888-892. |
| [12] |
冯志刚, 朱俊高. 软土次固结变形特性试验研究[J].
水利学报, 2009(5): 583-588.
Feng Zhigang, Zhu Jungao. Experimental Study on Secondary Consolidation Behavior of Soft Soil[J]. Journal of Hydraulic Engineering, 2009(5): 583-588. |
| [13] |
李硕, 王常明, 吴谦, 等. 上海淤泥质黏土固结蠕变过程中结合水与微结构的变化[J].
岩土力学, 2017, 38(10): 2809-2816.
Li Shuo, Wang Changming, Wu Qian, et al. Variations of Bound Water and Microstructure in Consolidation-Creep Process of Shanghai Mucky Clay[J]. Rock and Soil Mechanics, 2017, 38(10): 2809-2816. |
| [14] | Walherl. Undrained Creep in a Sensitive Clay[J]. Geotechnique, 1969, 19(4): 515-529. DOI:10.1680/geot.1969.19.4.515 |
| [15] | Mesri G, Godlewdk P M. Time-and Stress-Com-pressibility Interrelationship[J]. Geotechnical Engineering Division, ASCE, 1977, 103(5): 417-429. |