 2017, Vol. 32
扩展功能
文章信息
- 王永, 李思萱, 李辉, 朱银潮, 崔军, 张赞赞, 张涛
- WANG Yong, LI Si-xuan, LI Hui, ZHU Yin-chao, CUI Jun, ZHANG Zan-zan, ZHANG Tao
- 浙江省宁波市甲状腺癌发病、死亡现况和预测分析
- Current and predicted morbidity and mortality of thyroid cancer in Ningbo
- 疾病监测, 2017, 32(10/11): 845-850
- Disease Surveillance, 2017, 32(10/11): 845-850
- 10.3784/j.issn.1003-9961.2017.10/11.015
-
文章历史
- 收稿日期:2017-08-04


2. 慈溪市疾病预防控制中心, 浙江 慈溪 315300
2. Cixi County Center for Disease Control and Prevention, Cixi 315300, Zhejiang, China
甲状腺癌近年来由于其发病趋势的迅速增长而引起广泛关注[1]。甲状腺癌每年新发病例占所有癌症发病的1%~5%,女性为男性约3倍之多,发病率年龄呈现年轻化,并随年龄的增长而增加,已引起广泛的关注[2]。我国甲状腺癌发病率也呈逐年上升趋势[3],给社会、家庭和个人都带来沉重负担。文献提示,甲状腺癌的发病机制与碘摄入量等因素密切相关[4]。浙江省宁波市作为沿海城市,甲状腺癌发病率水平相对较高。
邓聚龙[5]和刘思峰等[6]提出的灰色系统理论主要通过对“部分”已知信息进行挖掘和提取,实现对系统运行行为、演化规律的正确描述和有效监控。
灰色模型[Grey model一阶一个变量的灰微分方程模型,GM(1, 1)]和Verhulst预测模型为单变量一阶线性模型,是通过研究去寻找和发现事物发展变化的连续或离散的未来时间序列,分析事物发展变化的连续规律[7]。GM(1, 1)模型较为实用,但稳定性有欠缺,缺乏拟合优劣的衡量标准[8-9]。而Verhulst模型适用于“S”形震荡序列[10],常用于人口预测,繁殖预测等,但与其参数特性相关的成果较少[11]。
为了解浙江省宁波市甲状腺癌的发病和死亡水平及流行特征,拟对宁波市甲状腺癌发病与死亡监测数据进行分析。本文采用GM(1, 1)和Verhulst模型对甲状腺癌发病和死亡趋势分别进行预测,并对预测特征做适当比较。
1 资料与方法 1.1 资料来源甲状腺癌发病与死亡资料来源于宁波市疾病预防控制中心(CDC)肿瘤登记报告数据和全死因监测数据,从中抽取国际疾病分类第10次修订(ICD-10),编码为C73的甲状腺病例进行分析。人口资料来源于宁波市公安局。
1.2 质量控制《浙江省卫生监测区统计工作手册》中规范登记工作;各级医疗机构对诊断的新发病例填写发病报告卡,并上报至“浙江省慢性病监测信息管理系统”,经过省、市、县CDC的审核;各级医疗机构每月开展肿瘤发病报告自查,县、市和省CDC每年定期对肿瘤监测工作开展现场质控与督导,现场质控的内容为医院漏报调查、报告卡填写质量以及录入一致性抽查。参照国际癌症登记协会(international agency for research on cancer, IARC)对肿瘤登记的质量要求[12], 对2011-2016年的肿瘤登记资料进行整理与分析。
1.3 统计学分析对甲状腺癌的发病(死亡)率,性别、年龄别及分城乡发病(死亡)率等指标进行计算;采用2010年中国普查人口标化发病(死亡)率(标准化率);检验采用SPSS 18.0软件χ2检验,预测发病率和死亡率采用灰色建模软件,并进行拟合效果的检验。
1.3.1 GM(1,1)灰色模型的建立根据灰色数列预测模型理论建立GM(1,1)模型[5]。设原始数列X(t)={x(1), x(2), …x(n)},对其进行一次累加生成:
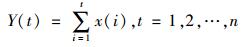
|
(1) |
建立Y(t)的一阶线性微分方程:
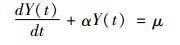
|
(2) |
解该变量分离型微分方程得其特解为:
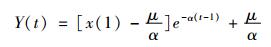
|
(3) |
注:参数α和μ是根据最小二乘法估计,由矩阵运算获得。
1.3.2 灰色Verhulst模型的建立
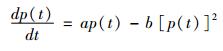
|
这是一个非线性的微分方程,其解是
|
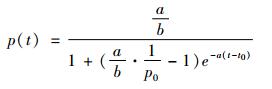
以上公式中t0为起始时间,p0为p(t)在t0时刻的值,即为初始值。
1.3.3 拟合效果的检验确定GM(1, 1)和Verhulst模型的可靠性均用后验差比值和小误差概率检验。计算后验差比值C和小误差概率P:

|
式中,S1为原始数列X(t)的标准差,S2为残差数列ε(t)的标准差。
然后根据后验差比值和小误差概率检验表(表 1)判断该模型的拟合度。
| 预测精度等级 | P值 | C值 |
| 一级(好) | >0.950 | < 0.350 |
| 二级(合格) | >0.800 | < 0.500 |
| 三级(勉强) | >0.700 | < 0.650 |
| 四级(不合格) | ≤0.700 | ≥0.650 |
2011-2016年报告发病率为34.28/10万(标准化率29.75/10万);女性报告发病率为53.47/10万,男性报告发病率为14.96/10万,性别差异有统计学意义(χ2=3 770.983,P=0.001);女性报告发病率标准化率为46.30/10万,男性报告发病标准化率为13.25/10万。
2002-2016年间宁波市甲状腺癌死亡病例为368例,死亡率为0.43/10万(标准化率0.33/10万);女性死亡率为0.43/10万,男性死亡率为0.37/10万,差异无统计学意义(χ2=3.524,P=0.061);女性死亡标准化率为46.30/10万,男性死亡标准化率为13.25/10万,见表 2、3。
| 年份 | 男性 | 女性 | 总计 | |||||||||||
| 人口数 | 病例数 | 粗率 (/10万) |
标准化率 (/10万) |
人口数 | 病例数 | 粗率 (/10万) |
标准化率 (/10万) |
人口数 | 病例数 | 粗率 (/10万) |
标准化率 (/10万) |
|||
| 2011 | 2 871 000 | 233 | 8.12 | 7.10 | 2 870 717 | 728 | 25.36 | 21.77 | 5 741 717 | 961 | 16.74 | 14.38 | ||
| 2012 | 2 880 990 | 296 | 10.27 | 8.94 | 2 889 594 | 1 160 | 40.14 | 34.56 | 5 770 584 | 1 456 | 25.23 | 21.70 | ||
| 2013 | 2 887 266 | 501 | 17.35 | 15.39 | 2 902 029 | 1 699 | 58.55 | 50.67 | 5 789 295 | 2 200 | 38.00 | 32.96 | ||
| 2014 | 2 898 355 | 522 | 18.01 | 15.96 | 2 921 261 | 2 129 | 72.88 | 63.39 | 5 819 616 | 2 651 | 45.55 | 39.69 | ||
| 2015 | 2 910 318 | 546 | 18.76 | 16.79 | 2 941 432 | 1 943 | 66.06 | 57.73 | 5 851 750 | 2 489 | 42.53 | 37.29 | ||
| 2016 | 2 924 695 | 501 | 17.13 | 15.49 | 2 962 985 | 1 691 | 57.07 | 50.08 | 5 887 680 | 2 192 | 37.23 | 32.84 | ||
| 合计 | 17 372 624 | 2 599 | 14.96 | 13.25 | 17 488 018 | 9 350 | 53.47 | 46.30 | 34 860 642 | 11 949 | 34.28 | 29.75 | ||
| 年份 | 男性 | 女性 | 总计 | |||||||||||
| 人口数 | 死亡数 | 粗率 (/10万) |
标准化率 (/10万) |
人口数 | 死亡数 | 粗率 (/10万) |
标准化率 (/10万) |
人口数 | 死亡数 | 粗率 (/10万) |
标准化率 (/10万) |
|||
| 2002 | 2 760 498 | 2 | 0.07 | 0.07 | 2 687 189 | 6 | 0.22 | 0.24 | 5 447 687 | 8 | 0.15 | 0.15 | ||
| 2003 | 2 771 155 | 10 | 0.36 | 0.35 | 2 705 162 | 13 | 0.48 | 0.47 | 5 476 317 | 23 | 0.42 | 0.41 | ||
| 2004 | 2 782 364 | 3 | 0.11 | 0.09 | 2 726 444 | 3 | 0.11 | 0.10 | 5 508 807 | 6 | 0.11 | 0.10 | ||
| 2005 | 2 795 925 | 7 | 0.25 | 0.22 | 2 751 020 | 6 | 0.22 | 0.20 | 5 546 945 | 13 | 0.23 | 0.21 | ||
| 2006 | 2 810 287 | 8 | 0.28 | 0.24 | 2 775 461 | 10 | 0.36 | 0.30 | 5 585 747 | 18 | 0.32 | 0.27 | ||
| 2007 | 2 825 631 | 9 | 0.32 | 0.27 | 2 799 408 | 10 | 0.36 | 0.30 | 5 625 038 | 19 | 0.34 | 0.28 | ||
| 2008 | 2 841 269 | 4 | 0.14 | 0.11 | 2 821 960 | 10 | 0.35 | 0.29 | 5 663 228 | 14 | 0.25 | 0.19 | ||
| 2009 | 2 854 007 | 9 | 0.32 | 0.23 | 2 841 516 | 8 | 0.28 | 0.22 | 5 695 523 | 17 | 0.30 | 0.23 | ||
| 2010 | 2 865 586 | 14 | 0.49 | 0.35 | 2 859 918 | 12 | 0.42 | 0.31 | 5 725 504 | 26 | 0.45 | 0.33 | ||
| 2011 | 2 871 000 | 9 | 0.31 | 0.23 | 2 870 717 | 15 | 0.52 | 0.39 | 5 741 717 | 24 | 0.42 | 0.31 | ||
| 2012 | 2 880 990 | 15 | 0.52 | 0.33 | 2 889 594 | 18 | 0.62 | 0.43 | 5 770 584 | 33 | 0.57 | 0.38 | ||
| 2013 | 2 887 266 | 17 | 0.59 | 0.39 | 2 902 029 | 20 | 0.69 | 0.46 | 5 789 295 | 37 | 0.64 | 0.42 | ||
| 2014 | 2 898 355 | 21 | 0.72 | 0.45 | 2 921 261 | 25 | 0.86 | 0.55 | 5 819 616 | 46 | 0.79 | 0.49 | ||
| 2015 | 2 910 318 | 12 | 0.41 | 0.26 | 2 941 432 | 27 | 0.92 | 0.58 | 5 851 750 | 39 | 0.67 | 0.41 | ||
| 2016 | 2 924 695 | 20 | 0.68 | 0.43 | 2 962 985 | 25 | 0.84 | 0.56 | 5 887 680 | 45 | 0.76 | 0.49 | ||
| 合计 | 42 679 343 | 160 | 0.37 | 0.28 | 42 456 093 | 208 | 0.49 | 0.38 | 8 5135 436 | 368 | 0.43 | 0.33 | ||
按年龄和性别进行甲状腺癌报告发病率和死亡率的分层分析,结果表明甲状腺癌年龄别报告发病率从10~岁组开始缓慢上升,50~岁组达到高峰,之后随年龄增加而下降,85~岁组降至最低,其中30~64岁的报告发病数占84.50%。男性15~岁组以前甲状腺癌的报告发病率较低,15~岁组之后报告发病率呈快速的上升趋势,30~59岁为报告发病的高峰年龄趋于平缓,之后缓慢下降;女性15~岁组以前甲状腺癌的报告发病率也较低,15~岁组之后报告发病率呈明显的上升趋势,35~64岁为报告发病的高峰年龄。各年龄组报告发病率均为女性大于男性。
甲状腺癌的死亡率随年龄的增加而增加,65~岁组以后快速上升,80~岁组以后稍有下降。男性和女性29~岁组以前的甲状腺死亡率均为0。男性在30~岁组以后呈明显上升趋势,60~岁组以后缓慢下降,65~岁组以后又快速上升且高于30~59岁年龄组。女性30~岁组以后呈上升趋势,75~岁组以后达到高峰。总体特征是从50~岁组开始死亡率快速上升,75~岁组达到高峰,见表 4。
| 年龄组(岁) | 报告发病率(/10万) | 死亡率(/10万) | |||||
| 男性 | 女性 | 总计 | 男性 | 女性 | 总计 | ||
| 0~ | 0.00 | 0.00 | 0.00 | 0.00 | 0.00 | 0.00 | |
| 5~ | 0.14 | 0.00 | 0.07 | 0.00 | 0.00 | 0.00 | |
| 10~ | 0.14 | 1.17 | 0.64 | 0.00 | 0.00 | 0.00 | |
| 15~ | 0.92 | 4.84 | 2.83 | 0.00 | 0.00 | 0.00 | |
| 20~ | 4.81 | 16.61 | 10.61 | 0.00 | 0.00 | 0.00 | |
| 25~ | 14.47 | 36.55 | 25.67 | 0.00 | 0.00 | 0.00 | |
| 30~ | 20.88 | 49.56 | 35.64 | 0.03 | 0.03 | 0.03 | |
| 35~ | 22.59 | 62.75 | 43.23 | 0.03 | 0.03 | 0.03 | |
| 40~ | 21.61 | 76.97 | 49.67 | 0.10 | 0.08 | 0.09 | |
| 45~ | 22.11 | 90.16 | 56.11 | 0.23 | 0.15 | 0.19 | |
| 50~ | 24.21 | 106.52 | 65.01 | 0.40 | 0.23 | 0.32 | |
| 55~ | 20.29 | 87.03 | 53.52 | 0.60 | 0.54 | 0.57 | |
| 60~ | 18.20 | 74.42 | 46.55 | 0.54 | 0.88 | 0.71 | |
| 65~ | 16.14 | 50.30 | 33.31 | 1.65 | 1.39 | 1.52 | |
| 70~ | 11.01 | 35.17 | 22.92 | 0.00 | 0.00 | 0.00 | |
| 75~ | 5.96 | 14.30 | 10.18 | 4.52 | 7.40 | 6.01 | |
| 80~ | 5.41 | 7.15 | 6.35 | 3.30 | 4.61 | 4.02 | |
| 85~ | 2.97 | 5.54 | 4.51 | 2.98 | 3.89 | 3.54 | |
| 合计 | 14.96 | 53.47 | 34.28 | 0.37 | 0.49 | 0.43 | |
2011-2016年宁波市甲状腺癌报告发病率城乡差异明显,城市甲状腺癌报告发病率为48.53/10万(男性22.67/10万,女性73.71/10万);农村甲状腺癌报告发病率为25.06/10万(男性10.06/10万,女性40.16/10万)。城市报告发病率是农村1.94倍,差异有统计学意义(χ2=1336.917,P=0.001)。
2002-2016年甲状腺癌死亡率城乡差异并不显著,城市甲状腺癌死亡率为0.41/10万(男性0.33/10万,女性0.48/10万);农村死亡率为0.45/10万(男性0.40/10万,女性0.49/10万)。城市死亡率是农村0.91倍。差异无统计学意义(χ2=0.784,P=0.483),见表 5。
| 地区(性别) | 报告发病率(/10万) | 死亡率(/10万) | |||
| 粗率 | 标准化率 | 粗率 | 标准化率 | ||
| 城市 | |||||
| 男性 | 22.67 | 18.74 | 0.33 | 0.19 | |
| 女性 | 73.71 | 57.07 | 0.48 | 0.31 | |
| 合计 | 48.53 | 38.24 | 0.41 | 0.25 | |
| 农村 | |||||
| 男性 | 10.06 | 7.97 | 0.40 | 0.24 | |
| 女性 | 40.16 | 29.54 | 0.49 | 0.30 | |
| 合计 | 25.06 | 18.74 | 0.45 | 0.27 | |
| 全市 | |||||
| 男性 | 14.96 | 12.25 | 0.37 | 0.22 | |
| 女性 | 53.47 | 40.70 | 0.49 | 0.30 | |
| 合计 | 34.28 | 26.56 | 0.43 | 0.26 | |
依据灰色建模软件的GM(1,1)预测模型预测甲状腺癌的报告发病率,得到预测报告发病率,计算原始标化报告发病率数列的标准差S1=24.640,残差数列的标准差S2=12.981。则后验差比值C(S2/S1)=0.532,小概率误差P=P{|ε(t)~ε | < 0.674 5S1}=1。根据表 1预测拟合度判断标准,属于三级,拟合效果勉强。
依据Verhulst预测模型预测甲状腺癌的报告发病率,得到预测报告发病率,计算原始标化报告发病率数列的标准差S1=24.627,残差数列的标准差S2=8.843。则后验差比值C(S2/S1)=0.364,小概率误差P=1.000。根据表 1预测拟合度判断标准,属于二级,拟合效果合格。用Verhulst模型具有更好的拟合效果,所得预测值与实际值吻合较高。见图 1。

|
| 图 1 2011-2017年宁波市甲状腺癌报告发病率趋势拟合曲线图 Figure 1 Fitted incidence curve of thyroid cancer reported during 2011-2017 in Ningbo |
| |
依据灰色预测软件的GM(1,1)预测模型预测甲状腺癌的死亡率,得到预测死亡率,计算原始标化死亡率数列的标准差S1=0.810,残差数列的标准差S2=0.33。则后验差比值C=0.411,小概率误差P=1.000。根据表 7预测拟合度判断标准,属于二级,拟合效果合格。用Verhulst预测模型预测甲状腺癌的死亡率,得到预测死亡率,计算原始标化死亡率数列的标准差S1=0.815,残差数列的标准差S2=0.362。则后验差比值C(S2/S1)=0.444,小概率误差P=1.000。根据表 1预测拟合度判断标准,属于二级,拟合效果合格。
两种模型都有较好的拟合效果,所得预测值与实际值吻合较高,见图 2。

|
| 图 2 2002-2017年宁波市甲状腺癌死亡率趋势拟合曲线图 Figure 2 Fitted motality curve of thyroid cancer reported during 2002-2017 in Ningbo |
| |
本文结果显示,宁波市甲状腺癌报告发病率(标准化率29.75/10万)水平较高,男性和女性发病均呈现随年龄快速上升后缓慢下降的趋势。城市报告发病水平(标准化率为38.24/10万)和农村的报告发病水平(标准化率18.74/10万)水平较高。宁波市甲状腺癌报告发病水平无论总体还是城市农村,均高于浙江省[1]。宁波市甲状腺癌死亡水平(标准化率0.33/10万)与浙江省基本持平[1]。
宁波市甲状腺癌的发病与死亡存在性别与年龄差异。女性报告发病和死亡水平分别是男性的3.49和1.36倍,与IARC公布的监测结果(性别比约为1:3)[13-14]及全国肿瘤登记发病性别比(1:3.2)[3]较为接近。女性报告发病率从10岁组开始上升,50~岁组达到高峰,与2012年中国肿瘤年报及浙江省的研究结果一致;宁波市男性报告发病年龄(多在25~69岁)比全国(多在50~69岁)低,与浙江省(多在30~69岁)接近。性别差异提示甲状腺癌的报告发病机制可能与性激素有关。年龄特征提示50岁以上人群应作为甲状腺癌的重点筛查对象。另外,宁波市甲状腺癌死亡率随年龄的增长而增加,与全国和浙江省的趋势相一致[1-3]。
文献提示,碘摄入量异常是甲状腺癌发病的重要危险因素之一[15]。宁波市某区调查显示,人群碘营养水平处于超过适宜量状态[16],可能与沿海地区摄入高碘海产品有关。近年沿海地区补碘过多的舆论态势,影响部分居民推崇吃无碘盐的现象发生,也会减少部分人群碘的摄入。而碘摄入过多或不足均可导致甲状腺疾病的报告发病率增加,宁波市甲状腺癌发生率较高可能与此有关。
另外,随着健康意识的加强,人群甲状腺检查的比例逐渐增多,较高的检出率也提高了甲状腺的报告发病水平。报告发病的城乡差异,可能与农村人群受检的概率低于城市人群有关。
根据宁波市甲状腺癌报告发病率数据建立GM(1, 1)预测模型,模型精度勉强(三级),2017年预测值为45.93/10万;建立Verhulst预测模型,模型精度合格(二级),2017年预测值为42.51/10万。两种模型预测值均提示未来宁波市甲状腺癌报告发病率呈上升的趋势。根据宁波市甲状腺癌死亡数据建立GM(1,1)和Verhulst预测模型,模型精度合格(二级),据GM(1, 1)和Verhulst模型拟合得出2017年宁波市甲状腺癌死亡率预测值(分别为0.88/10万和0.87/10万),两者较接近且提示未来宁波市甲状腺癌死亡率呈上升趋势。
总之,卫生部门加强甲状腺癌报告发病和死亡的监测工作,探索宁波市甲状腺癌的发病和死亡流行病学特征及规律,有助于甲状腺癌发病和死亡的预防和控制。
作者贡献:
王永 ORCID:0000-0002-0981-0099
王永:数据收集及分析
李思萱、李辉:数据收集
朱银潮、崔军:统计分析
张赞赞:数据收集及文献查找
张涛:撰写指导
| [1] |
Gong WW, Hu RY, Luo SL, et al. Analysis on incidence and mortality characteristics of thyroid cancer during 2007 to 2011 in Zhejiang province[J]. Zhejiang Journal of Preventive Medicine, 2014, 26(5): 433-437. (in Chinese) 龚巍巍, 胡如英, 罗胜兰, 等. 浙江省2007-2011年甲状腺癌发病及死亡特征分析[J]. 浙江预防医学, 2014, 26(5): 433-437. |
| [2] |
Yang L, Wang N. Advances in epidemiology of thyroid cancer[J]. Chinese Journal of Preventive Medicine, 2014, 48(8): 744-748. (in Chinese) 杨雷, 王宁. 甲状腺癌流行病学研究进展[J]. 中华预防医学杂志, 2014, 48(8): 744-748. |
| [3] |
He J, Chen WQ. 2012 Chinese cancer registry annual report[M]. Beijing: Military Medical Science Academy of the PLA Press, 2012. (in Chinese) 赫捷, 陈万青. 2012中国肿瘤登记年报[M]. 北京: 军事医学科学院出版社, 2012. |
| [4] |
Wu XQ, Chen ZH, Dai L, et al. Analysis of iodine nutritional status of high-risk population in coastal salt-producing areas and coastal nonsalt-producing areas in Xiamen city of Fujian province[J]. Chinese Journal of Endemiology, 2011, 30(6): 611-615. (in Chinese) 伍啸青, 陈志辉, 戴龙, 等. 福建省厦门市沿海产盐区与非产盐区特需人群碘营养状况研究[J]. 中国地方病学杂志, 2011, 30(6): 611-615. |
| [5] |
Deng JL. Grey theoretical basis[M]. Wuhan: Huazhong University of Science and Technology Press, 2002. (in Chinese) 邓聚龙. 灰理论基础[M]. 武汉: 华中科技大学出版社, 2002. |
| [6] |
Liu SF, Yang YJ, Wu LF. Grey system theory and application[M]. 7th ed. Beijing: Science Press, 2014. (in Chinese) 刘思峰, 杨英杰, 吴利丰. 灰色系统理论及其应用[M]. 7版. 北京: 科学出版社, 2014. |
| [7] |
Deng JL. Grey system modeling thought-grey system[M]. Beijing: National Defense Industry Press, 1985: 1-5. (in Chinese) 邓聚龙. 灰色系统建模思想:灰色系统[M]. 北京: 国防工业出版社, 1985: 1-5. |
| [8] |
Liu SF, Zeng B, Liu JF, et al. Several basic models of GM(1, 1) and their applicable bound[J]. Systems Engineering and Electronics, 2014, 36(3): 501-508. (in Chinese) 刘思峰, 曾波, 刘解放, 等. GM(1, 1)模型的几种基本形式及其适用范围研究[J]. 系统工程与电子技术, 2014, 36(3): 501-508. |
| [9] |
Gu LM. To the GM grey model and theory question[J]. Computer Engineering and Applications, 2011, 47(30): 58-63, 93. (in Chinese) 顾乐民. 对GM灰色模型及理论的质疑[J]. 计算机工程与应用, 2011, 47(30): 58-63, 93. DOI:10.3778/j.issn.1002-8331.2011.30.017 |
| [10] |
Cui LZ. Research on grey forecasting technology and its application[D]. Nanjing:Nanjing University of Aeronautics & Astronautics, 2010.(in Chinese) 崔立志. 灰色预测技术及其应用研究[D]. 南京: 南京航空航天大学, 2010. |
| [11] |
Cui J, Liu SF, Zeng B, et al. Parameters characteristics of grey Verhulst prediction model under multiple transformation[J]. Control and Decision, 2013, 28(4): 605-608. (in Chinese) 崔杰, 刘思峰, 曾波, 等. 灰色Verhulst预测模型的数乘特性[J]. 控制与决策, 2013, 28(4): 605-608. |
| [12] |
Yang L, Zheng RS, Wang N, et al. Analysis of incidence and mortality of thyroid cancer in China, 2010[J]. Chinese Journal of Preventive Medicine, 2014, 48(8): 663-668. (in Chinese) 杨雷, 郑荣寿, 王宁, 等. 2010年中国甲状腺癌发病与死亡情况[J]. 中华预防医学杂志, 2014, 48(8): 663-668. |
| [13] |
Curado MP, Edwards B, Shin HR, et al. Cancer incidence in five continents Vol. Ⅸ[M]. Lyon: IARC Scientific Publications, 2009.
|
| [14] |
Sipos JA, Mazzaferri EL. Thyroid cancer epidemiology and prognostic variables[J]. Clin Oncol, 2010, 22(6): 395-404. DOI:10.1016/j.clon.2010.05.004 |
| [15] |
Luo SL, Yu M, Gong WW. Prevalence and risk factors of thyroid cancer[J]. China Preventive Medicine, 2013, 14(4): 317-322. (in Chinese) 罗胜兰, 俞敏, 龚巍巍. 甲状腺癌的流行现况及其危险因素[J]. 中国预防医学杂志, 2013, 14(4): 317-322. |
| [16] |
Jiang YF, Xu LR. Monitoring results of iodine deficiency disorders in Yinzhou district, 2001-2011[J]. Zhejiang Journal of Preventive Medicine, 2012, 24(11): 35-37. (in Chinese) 江一芬, 徐来荣. 鄞州区2001-2011年碘缺乏病监测结果[J]. 浙江预防医学, 2012, 24(11): 35-37. DOI:10.3969/j.issn.1007-0931.2012.11.014 |