 2016, Vol. 59


2 Key Laboratory of Airborne Geophysics and Remote Sensing Geology, Ministry of Land and Resources, Beijing 100083, China
Curie point isotherm or Curie surface for short is first presented in Spector and Grant (1970). Bhattacharyya and Lue (1975) named it as Curie point isotherm surface. Some other experts also give different names, such as Curie depth, Curie point depth, Curie temperature isotherm, depth to Curie temperature isotherm and magnetic layer bottom depth, etc. In fact, Curie point isotherm is the bottom of magnetic layer in upper lithosphere. Magnetic layer is composed of various magnetic rocks and minerals, among which the Curie temperature of ilmenite and pyrrhotite is about 300~350 ℃, magnetite is 585 ℃ and cobalt and nickel bearing iron minerals have high Curie temperature ranging from 760 ℃ to 800 ℃. With increasing burial depth, the temperature increases gradually, the minerals lose their magnetic property when the temperatures rise to Curie point. This assumed boundary which makes the rocks and minerals demagnetization is referred to as Curie point isotherm.
Curie point isotherm is a temperature indicator surface in lithosphere, which shows the distribution of magnetic layer and heat flow in the crust, and provides important information for the study of geotectonic, earthquake, geothermal, mineral and hydrocarbon resources (Wang et al., 1990; Xiong et al., 2001, 2013, 2014; Liu et al., 1999; Tanaka et al., 1999; Chiozzi et al., 2005; Hao et al., 1982; Liu et al., 2012; Francisco et al., 2004; Trifonova et al., 2009; Bansal et al., 2013; Funda et al., 2007). National Aeronautics and Space Administration (NASA) and United States Geological Survey (USGS) conducted “MAGSAT” project since the 1980s. Then “Oersted and CHAMP” and “SWARM” project started in the following few years. These projects greatly improved the study of Curie point isotherm in the world. Experts from United States, Japan, Brazil, India, Southeast Asia and Turkey discussed the relation between Curie depths and geotectonic, geothermal and earthquake (Bouligand et al., 2009; Guimaraes et al., 2014; Rajaram et al., 2009; Tanaka et al., 1999; Dolmaz et al., 2005).
Study of Curie point isotherm in China started in the 1980s. Chongchu Hou, Baoguo Li, Shoupeng Liu and Hua Yang (from the Beijing Computing Center and Airborne Geophysical Survey Team in Ministry of Geology and Mineral Resources) compiled the bottom depth map of magnetic structural layer in China on the scale of 1:12000000. This map calculated the Curie point depth values based on the old aeromagnetic data and was the only published result involved in national research of Curie point isotherm in China. Zhang et al. (2013) simplified the map by using depth contour and discussed the characteristics of Curie point isotherm combining with Chinese geological background. More geologists studied the Curie point depth within a certain area to provide a new insight into geotectonic, geothermal, oil and gas exploration and seismology, such as Xinjiang, Qinghai-Tibet Plateau, Songliao Basin, the South China Sea, the Bohai Sea and the Yellow Sea (Gao et al., 2013; Zhang et al., 2003; Hu et al., 2006; Li et al., 2009; Wu et al., 2010; Liu, 1996; Han, 2008). However, the accuracy of aeromagnetic survey was low because of the limit of science and technology. Moreover, no data covered the west of Qinghai-Tibet Plateau, so the compiled map was incomplete in the 1980s. The calculated Curie point depth values were never compared with heat flow data. Therefore, this research calculated the Curie point depth in Chinese continent and part of China Sea based on the newly compiled aeromagnetic data. We also discussed the relation between Curie point depth and heat flow values.
2 CALCULATING METHOD AND ANALYSISMethods of calculating Curie depths by magnetic data are mainly divided into two types: (1) spectral analysis based on single magnetic anomaly (Vacquier and Affleck, 1942; Bhattacharyya and Leu, 1975); (2) spectral analysis based on statistical analysis of magnetic anomaly (Spector and Grant, 1970). The second type can be subdivided into three methods: (ⅰ) Spectral peak method (Connard et al. 1983; Blakely, 1995; Ross et al., 2006; Ravat et al., 2007; Okubo et al., 1985); (ⅱ) Spectral slope method (Hahn et al., 1974; Agrawal et al., 1992; Shuey et al., 1977); (ⅲ) Power-law correction (Maus et al., 1997; Ravat et al., 2007; Bouligand et al., 2009). We estimated the Curie point depth in this study by using the power spectra of potential fields and their derivatives of different order. This method is based on the equivalent theory proposed by Spector and Grant (1970). The theory indicates that the statistical average value of spectrum of several horizontal and randomly distributed bodied equals the magnetic field of individual magnetic body. This method is discussed in detail in Hou (1989) and will not be elaborated in this study. Many experts used spectral analysis based on statistical analysis of magnetic anomaly to calculate Curie depth and achieved reliable results (Connard et al., 1983; Blakely, 1988; Okubo et al., 1985; Tanaka et al., 1999; Hu et al., 2006; Li et al., 2009).
Aeromagnetic survey covered nearly whole Chinese continent and part of China Sea by the end of 2011. The experts measured and explained 568 survey areas with different scale (1:1000000~1:5000). The newly compiled aeromagnetic ∆T image with reduction to the pole integrated 409 survey areas, including 143 high precision aeromagnetic data and 266 moderate precision ones. The covered area of this map is nearly 9796000 km2. Calculation of Curie point depth is based on the aeromagnetic data. We completed data processing and mapping by Geoprobe MAGER software which was developed by China Aero Geophysical Survey and Remote Sensing Center for Land and Resources (AGRS). Calculation steps are as follows:
(1) We prepared the magnetic data with reduction to the pole by using varied dips at any latitudes. The grid is 5 km×5 km.
(2) Choosing reasonable window size and slide distance according to the aeromagnetic feature. The square window could be overlapped when moving horizontally and vertically. The width of the window is 4~6 times the expected top depth. Therefore, we determined the window size is 100 km×100 km in this study after model test.
(3) Calculating the radially averaged power spectrum for each window.
(4) Determining the depth to top (Zτ), centroid (Zo) and bottom (Zb) of the vertical prism by power spectral method. The bottom depth is referred to as Curie depth in the center of the window.
(5) Calculating after moving the window 50 km along the survey line and survey point. Repeating step (1) and (2) until gain the results of whole area. Consequently, we get 8004 Curie point depths.
(6) Compiling the map of Curie point isotherm in China, as shown in Fig. 1.

|
Fig. 1 Curie point isotherm map of China |
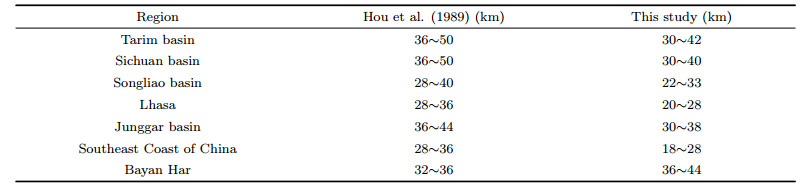
Hou et al., (1989) compiled the bottom depth map of magnetic structural layer, which was the earliest published result involved in national research of Curie point isotherm in China. This map covered nearly whole Chinese continent except western Qinghai-Tibet plateau. Comparison of calculated Curie point depths from two works is shown in Table 1. The results indicate that the distribution of Curie point isotherm in two images have common features, such as Tarim Basin, Sichuan Basin, Songliao Basin and Junggar Basin are characterized by depression of Curie point isotherm, whereas the depths are shallower in Southeast Coast and Lhasa. There is a certain difference in some areas. For instance, although the two maps present depression in Bayan Har region, the depth values are shallower in this study. However, the new calculated values are commonly 6~10 km shallower than the old map. This may be caused by two reasons, one is the difference of aeromagnetic data, this study is based on the newly compiled aeromagnetic ∆T image with reduction to the pole on the scale of 1:1000000. The other is the difference of data processing methods; Hou et al., (1989) processed the magnetic data before calculation of Curie depth by reduction to the pole with zonation in the east of China, but the zonation never did for the data in the west of China. Magnetic data are processed with reduction to the pole by using varied dips at any latitudes in this study.
|
|
Table 1 Comparison of Curie point depth |
Characteristics of Curie point depth clearly show the deep structure and geothermal gradient of lithosphere. Generally, the Curie point isotherm is depressed in stable craton, whereas it is characterized by regional uplift in active orogenic belt and igneous rocks province.
3.1 Depression of Curie Point IsothermThe depression of Curie point isotherm could be delineated with 30 km depth contour line in Curie depth map, these areas are consistent with stable blocks in China, such as Tarim basin, North China basin area, Yangtze basin area, Junggar basin, Qaidam basin, Hoh Xil-Bayan Har area, Songliao basin, Erlian basin, Bayan hot -Wuwei-Chaoshui basin and Pearl River estuary-Southeast Hainan basin. The Curie depths range from 28 to 45 km (Fig. 1). These depressions are located in stable basement areas and covered by more than ten thousands meters thick sedimentary unit. They are featured by low heat flow values.
(1) Tarim basin
The Curie point isotherm in Tarim basin is characterized by depression. The depth values range from 22 to 42 km, mostly range from 30 to 40 km. However, the mantle is uplifted under the Tarim basin as revealed by Junggar-Tianshan-Tarim geoscience transect. The top depth of the mantle is about 40~50 km and the velocity is 6.36 km·s-1 in the crust, which is consistent with the thickness and velocity of known cratons (Gao et al., 2002). According to the feature of Curie point isotherm, two uplifts and three depressions are divided in Tarim basin. Two uplifts are Aksu-Kuruktag belt and south Kalpin-Taklimakan belt with the depth ranging from 22 to 26 km. Three depressions are Khotan region, 40 degree northern latitude region and Kuqa region with depth ranging from 34 to 42 km.
The Curie depths clearly reflect the tectonic units in Tarim basin (Fig. 2). Two uplifts of Curie point isotherm correspond to northern Tarim uplift and Central Tarim uplift belt. Three depressions of Curie point isotherm correspond to southwest depression, northern depression belt and Kuqa depression in Tarim basin. South Kalpin-Taklimakan uplift is the largest belt with shallow Curie depth in central Tarim basin. This belt is similar with gravity and magnetic anomalies belt in central Tarim, which separates the Tarim Curie point isotherm depression into southern and northern segment. Gao et al. (2002) suggested the Moho surface in central Tarim is also featured by uplift with the depth of 40±2 km based on the seismic data. According to the drilling data, this belt is a concealed igneous rocks belt that developed Jinningian metamorphic volcanic rocks and intrusive rocks (Wan, 2011). Wu et al., (2006) indicated that this gravity and magnetic anomalies belt is a Jinningian collision zone which jointed two blocks of southern and northern Tarim. The uplift of Curie point isotherm might be caused by residual thermal of concealed igneous rock belt.

|
Fig. 2 Curie point isotherm of Tarim basin (Tectonic units from Li et al. 2010) |
(2) North China basin area
This area contains Ordos basin, Qinshui basin, Bohai Bay basin and south of North China basin. The Curie point isotherm is characterized by local depression and uplift alternately with the depth ranging from 18~37 km. The top of mantle under North China Plain is about 29~38 km according to Harqin Banner-Sui County Geoscience transect (Fig. 3). Therefore, the Curie point isotherm is close to the Moho in the south of Shijiazhuang, and may extend 1~6 km under Moho in some place. This result suggests that the top of mantle or crust-mantle boundary may be magnetic.

|
Fig. 3 Curie point isotherm of Kalaqinqi-Sui County geoscience transect |
The Curie depths change rapidly in North China basin area and are shallower than the depth of Tarim basin and Yangtze basin area (Fig. 4). These features reveal complicated geothermal structure that was caused by intense deformation (asthenosphere uplifting and lithosphere thinning) in North China block since Mesozoic.

|
Fig. 4 Curie point isotherm of North China basin area |
There are two depressions of Curie point isotherm in the central and north of Ordos basin with depth ranging from 28 to 36 km. The depth of uplift area surrounding the depression is 20 to 26 km. From seismic survey data, the Moho depth is about 39 to 46 km, but there is no low velocity layer in the crust with an average velocity of 6.3 km·s-1. These features indicate that the Ordos block is stable and weakly deformed (Deng et al., 2007). The Curie depths are commonly shallower than the Moho depths in Ordos basin. Qinshui basin is featured by NS depression of Curie point isotherm with depth ranging from 28 to 36 km. The Curie depths of Bohai Bay-south of North China basin vary in a wide range of 18~30 km. However, the depth is generally deep in this area except Liaodong Bay in the north of Bohai Bay basin. The Curie depths change rapidly in the plain region, and become shallow from west to east. The Curie point isotherm of Hehuai plain (east of Taihang Mtn. and west of Tanlu fault) is characterized by uplift and depression alternately with depth ranging from 23 to 34 km.
A large area of metamorphic basement and igneous rock outcropped in the north of North China block, western Shandong-Shandong Peninsula and Tanlu fault zone. The frequent magmatic activities made the increasing of geothermal gradient, which cause the uplift of Curie point isotherm with depth ranging from 18 to 23 km.
(3) Yangtze basin area
This area consists of Sichuan basin, Jianghan basin, south Yellow Sea-northern Jiangsu basin and YoujiangShiwan Mtn. basin. The Curie point isotherm in Yangtze basin area is also featured by depression with the depth ranging from 25 to 40 km.
Sichuan basin is a very important petroliferous basin in the west of China. The crust thickness is 42~43 km with average velocity of 6.15 km·s-1. The velocity is up to 8.15~8.20 km·s-1 at the top of upper mantle. These features are similar with Ordos basin and Tarim basin, which show typical structure of craton’s crust (Jia et al., 2014). Two depressions are distributed in Sichuan basin with depth ranging from 28 to 40 km. They are Ya’an-Mianyang depression area and west of Hunan and Hubei-southwest of Guizhou depression area, which are separated by Huaying Mtn. fault. The fault starts at Wanyuan, and passes through Da County to Yibin in the south. A large number of basalt outcropped in the Huaying Mtn. area, which suggests the Huaying Mtn. fault was a deep structure cutting through the sima and provided channel for magmatic activities. Therefore, the Curie point isotherm is characterized by a relative uplift with depth of 29~32 km between two depressions. Longmen Mtn. fault zone located in the west of Sichuan basin is one of the most active seismic zones in the world. The Curie point isotherm of this fault is also characterized by local uplift within a large area of depression. The Curie depth of Jianghan basin is much shallower than that of Sichuan basin. The values range from 26 to 33 km. Both basins are featured by depression with small variation, and the uplifts are locally distributed in Guiyang-Weixin and Xuanhan-Langzhong area. The Guiyang-Weixin area is a NW-trending uplift with depth of 22~26 km, whereas the latter is irregular planar distribution with depth ranging from 24 to 26 km.
The Curie depth is changed rapidly in Lower Yangtze and Xuefeng Mtn. area. Most of them are uplift and depression alternately in the shape of irregular block or belt. The depth of south Yellow Sea-north Jiangsu basin and Youjiang-Shiwan Mtn. basin is ranging from 25 to 36 km, whereas the depth is shallower in Nanjing and Xuefeng Mtn.-Nanchang area with the value of 18~24 km.
(4) Hoh Xil-Bayan Har depression area
Hoh Xil-Bayan Har fold belt is located in the northeast of Qinghai-Tibet Plateau, north to Kunlun Mtn., south to Jinsha river, west to Parmirs and east to Longmen Mtn.. This area could be easily distinguished in Chinese geological map, because of widely distributed Triassic sediment and rare magmatic activities. The thickness of Triassic sedimentary rocks is up to 10000 meters. Jia et al., (2014) suggest that the crust thickness is about 53~57 km and the average velocity is 6.23 km·s-1 for Songpan-Garzê area. The Curie point isotherm presents a long depression belt narrowing westward. The Curie depth is the deepest with values ranging from 30 to 44 km in Qinghai-Tibet Plateau. There is only one NE-trending uplift belt distributed along Garzê-Banma with width of 200 km. The Curie depth of this belt is 20~25 km.
(5) Junggar basin
Junggar basin is a large sedimentary basin developed from Cambrian crystalline basement and Carboniferous fold basement (He, 2005). The center of Junggar basin is characterized by depression of Curie point isotherm with depth of 28~38 km. There are three uplifts with depth ranging from 20 to 28 km surrounding the depression. They are northern Junggar uplift, Chepaizi uplift and eastern Junggar uplift. The Curie depth is generally depressed in Junggar basin, but it is shallower than Tarim basin and Sichuan basin. According to the seismic data, Moho depths in the basin vary in a range of 44~56 km and deepening on the both side. Therefore, the Moho is uplifted in central part of Junggar basin (Xiong et al., 2010). Moreover, heat flow values are low in this area, which indicate Junggar basin is a typical “cold basin”.
(6) Qidam basin
Qaidam basin is located in a special geographical position under the joint action of Indian, Siberia and Pacific plates. Therefore, Qilian, east Kunlun and Alkin tectonic systems are developed surrounding the Qaidam crystalline basement. Cenozoic sediments are well developed in the basin with the thickness up to 12 km (Lu et al., 2011). Thus the Curie depths range from 26 to 40 km. The Moho of Qaidam basin is featured by sloping with depth deepening from 52 to 75 km.
(7) Songliao basin
This basin is formed in a stable condition with great thickness of sedimentary cover. Although Mesozoic magmatism is active and frequent, the igneous rocks are only distributed in local place with small scale. The Cuire point isotherm is characterized by depression with depth range from 26 to 32 km. But an uplift belt extends along Changchun-Harbin-Suihua where a large number of Variscan granite outcropped. Therefore, the magmatism and radioactive heat release caused the uplift of Curie point isotherm with depth 21~26 km. Daqing area is a local uplift in depression in central part of Songliao basin, the depth is 24~26 km. According to the Manchuria-Suifenhe geoscience transect, the Moho is uplifted in Songliao basin with depth of 30~40 km. The average velocity of curst is 6.15~6.4 km·s-1.
(8) Erlian basin
This basin is similarly formed in a stable tectonic background and covered by thick sedimentary rocks. The magmatic activities are frequent in Mesozoic. The Curie depths always become shallow when the area suffered intense magmatism. Therefore, the shape of Curie point isotherm is closely related to volcanism and other geothermal activities. In the northeast and mid-west of Erlian basin, the Curie depth is shallow with the values of 19~24 km because of intense magmatism, whereas the southern and western part is 25~30 km.
(9) Bayan Hot-Wuwei-Chaoshui basin
These basins are located in the east of Hexi Corridor. They formed in a relatively stable environment with weak magmatism. The Curie point isotherm is featured by depression with depth of 25~33 km. The depth is deep in mid-south and north of this area, the values is 26~33 km. In the middle of this area, there is an EW-trending uplift belt with width about 50 km, the depth is 25 km.
(10) Pearl river estuary-Southeast Hainan basin
The basin is developed in stable tectonic background and covered by thick sedimentary rocks. The magmatic activities were frequent and produced large quantities of granites. Therefore, the Curie point isotherm is characterized by uplift. The strike of Curie point isotherm is similar with magnetic anomalies, which could be divided into two parts. The distribution of Curie depth is consistent with the tectonic structure in this basin. For instance, Zhu I depression and southeast Hainan basin are also featured by the depression of Curie point isotherm, the depth is 26~36 km.
3.2 Uplift of Curie Point IsothermThe uplift of Curie point isotherm could be delineated with the 26 km depth contour line in Curie depth map; these areas are consistent with orogenic system, such as Mtn. area of northeast and northwest China, Qinling-Dabie area, west Kunlun-Tibet-Sanjiang-Kangdian area and southeast coast of China. The Curie depth is characterized by irregular planar and banded shapes with values of 20~26 km. These areas suffered intense magmatic activities and have high heat flow values.
(1) Mtn. area of northeast China
This area consists of Great Khingan Mtn., Zhangguangcai Mtn., Yanshan Mtn. and east Shandong and south Liaoning. The Curie depth is characterized by uplift with values ranging from 18 to 24 km, in local areas up to 25~26 km. Deep exploration data show that these areas have low velocity and low resistivity layer in the crust. The layer’s depth is consistent with Curie depth. These evidences suggest high temperature mineralized water and magma chamber may exist in the crust, which caused the rocks demagnetizing and partial remelting. Geological data show a large area of granites of different stages distributed in this area. Therefore, radioactive heat release is possible reason for uplifting of Curie point isotherm.
(2) Mtn. area of Northwest China
This area includes Altai Mnt., Tianshan Mnt., Altun Mnt., Beishan Mnt., East Kunlun and Qilian Mnt. The Curie point isotherm is featured by uplift with depth of 19~24 km. These areas outcrop a large area of metamorphic rocks and suffer multi-stage magmatism, which caused high geothermal gradient and shallow Curie depth (or thinning of magnetic layer). However, the Curie depths are deepening in local basins and depressions with the values of 25~32 km, such as Jiuquan basin, Yining basin, Yanji depression, Kumux depression and Hala Lake-Sugan Lake depression.
(3) Qinling-Dabie area
This area is located in the east of central orogenic belt which is the continent-continent collision orogenic belt between North China block and Yangtze block. Dabie tectonic belt is a typical subduction-to-collision orogen, which preserved a large number of compressional and extensional structures. Therefore, the Curie depths show great variation. The crust has thinner thickness ranging from 29 to 40 km with an average of 34 km (Gao et al., 1999). The Curie depth is shallowest from Luonan to Hong0an with depth of 19~24 km, the depths deepen to 25~29 km in the east of Hong0an and west of Luonan and reach deepest of 30~33 km in Xi’an. The Curie depth is deepening from south to north in Hefei basin.
(4) West Kunlun-Tibet-Sanjiang-Kangdian area
From the Curie point isotherm map, large areas of uplift lie in the south of the north margin of Western Kunlun-Bairuobu Co-Xijir Ulan-Yushu-Kangding-Leibo-Zhaotong-Guangnan, which include Western Kunlun, Tibet, Sanjiang and Xikang Yunnan area. These areas developed the largest and continuous ophiolite belts and several plate suture zones. Imbricate structure is widely distributed in the crust of this area, which is the result of the subduction, collision and compression of the Indian plate toward the Eurasian plate and forming the foreland fold belt. Meanwhile, Mesozoic and Cenozoic magmatism is active and causes the increasing of geothermal gradient and demagnetization of rocks. Therefore, the Curie point isotherm is characterized by uplift with depth ranging from 18 to 27 km, in local area is 28~30 km, rarely up to 32 km.
The Curie depth is different within different areas. For example, the Western Kunlun area is characterized by uplift and depression alternately, the depths of uplift range from 20 to 25 km, whereas the depths are 26~30 km in depressions. Tibet area has the shallowest Curie depths with values of 18~30 km. Yarlung Zangbo river drainage basin and Lhasa block are featured by an EW-trending uplift in the south of Tibet. There are three uplifts with depth of 18~23 km in the mid-south of Tibet. They are Garzê in the west, Shenza in center and Nagqu in the east. The most famous geothermal fields (Yambajan and Nagqu) are located in the center of eastern uplift. From the inversion results, the Curie depths are generally about 20 km and rarely more than 25 km, except in the Zanda Zong-Tingri deression and the Qiangtang basin where it is 26 km to 33 km. The results indicate that the crustal temperature in Tibet is higher than that in the periphery blocks. The Curie depths are 20~33 km and rarely shallower than 18~24 km in Sanjiang drainage basin and Xikang Yunnan upfaulted zone of western Yangtze block, whereas the depths of Zoige block and Sichuan block are more than 30 km in the north of Yangtze block. Southern Sichuan and northern Yunnan in upper Yangtze is a stable block, but the Curie depth is shallow, in local areas is 20 km. This is probably due to the increase of geothermal temperature caused by magmatic activity during the Hercynian and later tectonic movement. The Curie depth is generally shallow in fold belt. The depth of Yushu-Yidun fold belt and the Jinsha River fold belt is 20~25 km, whereas the Yarlung Zangbo belt is deeper than that of the former two, about 26~30 km. Chuxiong and Simao basin are covered by thick sedimentary rocks, the Curie depth is 26~33 km. Panxi rift starts at Kangding, passes through south of Xichang and Huili, to Yuanmou, it is characterized by uplift of Curie point isotherm with the strike of NS-trending. Both sides of uplift are the depressions of Curie depth, the Chuxiong basin is on the west side, and the Sichuan basin on the east. Distribution of Curie depth indicates that the heat source material below the Panxi rift is still rich. Generally, the strikes of Curie depth are NS, NW and NWW from east to west, which is consistent with the tectonic framework in this area.
(5) Southeast Coast of China
This area lies in the east of Shanghai-Hangzhou-Qianshan-Rucheng-Beihai, where there was frequent tectonic and magmatic activity in the Mesozoic. Therefore, Mesozoic granites and volcanic rocks are widely outcropped in this area. At present, the crust is cooling and becomes stable, the crystallization and magnetism transferred to below the crust. On the surface are distributed many convective and residual heat-type lowmoderate temperature hot springs. The Curie point isotherm shows great variation with irregular shape. The depths are mainly ranging from 19 to 30 km, mostly 20~26 km. Seismic data suggest that the Curie depth is shallower than the Moho depth (30~32 km), only in local areas the depth coincides with the Moho, such as Quanzhou and Shantou.
4 CURIE POINT ISOTHERM AND HEAT FLOWHeat flow is a comprehensive parameter representing the heat status of upper crust and important for temperature calculation in deep. The measurement of heat flow in China started in 1970s, Wang et al., (1990) and Hu et al., (2001) published second and third edition of compiled heat flow data in Chinese continent. By the end of 1999, there were 862 heat flow data measured in Chinese continent. Later, dozens of new data got from Sichuan, Jianghan, Tarim and Bohai basins, and the number increased to 921. We collected 816 heat flow data from the second and third edition of the compiled heat flow data, the distribution of these data are shown in Fig. 5. The data are mostly concentrated in Southeast Coast and North China, rare in northwest, southwest and northeast of China. These data is inadequate to constrain the geothermal status of the crust. As a temperature boundary within the crust and the upper mantle, the Curie point isotherm is closely related to the heat flow, and the two complement each other, which is important for the study of the lithosphere’s structure.

|
Fig. 5 Distribution of heat flow data in China (heat flow data from Wang et al. 1990 and Hu et al, 2001) |
In 2011, a new version of heat flow map was compiled by the Institute of Geology and Geophysics, Chinese Academy of Sciences (Wang et al., 2012). The high heat flow values are distributed in Tibet-Sanjiang area, Southeast coast, North China and Songliao basin, whereas low data lie in Inner Mongolia-Khingan area, Tarim basin, Junggar basin, Qaidam basin and Yangtze basin area (Fig. 6). The distribution of heat flow has close relation with the Curie depth, high values of heat flow commonly correspond with uplift of Curie point isotherm, such as Tibet, Sanjiang and southeast coast areas; whereas low heat flow values correspond with depression of Curie point isotherm in Tarim basin, Junggar basin, Qaidam basin and Yangtze basin area, etc. Heat flow data in North China and Songliao basin are higher than the ones in Tarim basin and Yangtze basin area, so the Curie depths in North China and Songliao basin are shallower than that in Tarim basin and Yangtze basin area.

|
Fig. 6 Heat flow map of China (modified after Wang et al., 2012) |
In order to study the relation of heat flow and Curie depth, we classified the heat flow values with different intervals (Fig. 7). There are 99 heat flow data ranging from 0 to 40 mW·m-2, which are mainly distributed in Junggar basin, Tarim basin, Qiadam basin, Sichuan basin and Beijing-Tianjin-Hebei area. These areas are characterized by depression of Curie depth, and part of them lie in uplift and its edge. For the 50~60 mW·m-2 dataset, the 138 data are commonly distributed in Junggar basin, Tarim basin, Ordos basin, Sichuan basin and North China basin. There are 204 data of 60~70 mW·m-2 located in east coast, Fen Wei rift, Kang Dian rift and east Shandong and south Liaoning, where Curie depths are shallow. There are 138 data within the range of 70~80 mW·m-2. These data are mainly distributed in east coast, Qinling-Dabie, east Shandong and south Liaoning and Beijing-Tianjin-Hebei Region. These areas lie in the uplift of Curie point isotherm and its gradient.

|
Fig. 7 Relationship between Curie point depth and heat flow |
There are 102 heat flow data more than 80 mW·m-2, they are closely related to uplift of Curie depth, such as east coast, south Tibet-Sanjiang and east of Liaoning. Above all, with the increase of heat flow values, they are concentrated toward east coast, south Tibet-Sanjiang, Qinling-Dabie and east of Liaoning. These areas are featured by uplift of Curie point isotherm and are important prospects for geothermal exploration and development.
We collected the Curie depths according to the position of heat flow data and conducted correlation analysis between heat flow value, geothermal gradient and Curie depth. The correlation coefficients are -0.153 and -0.051 respectively. Therefore, the Curie depth is not a simple linear relation with heat flow and geothermal gradient. However, as shown in Fig. 8 and Fig. 9, geothermal gradient and heat flow values decrease significantly with the deepening of Curie depth. The heat flow data are all less than 100 mW·m-2 when the depths are more than 30 km. However, heat flow data show great variation in shallow Curie depth ( < 30 km), because the Curie depth corresponds to the thermal state of the deep crust, but the heat flow is controlled by many factors. Similarly, the geothermal gradients are less than 50 K·km-1 when the depths are more than 30 km.

|
Fig. 8 Scatter diagram of Curie point depths and heat flow values |

|
Fig. 9 Scatter diagram of Curie point depths and geothermal gradient |
The Curie point isotherm of stable blocks is characterized by depression with depth of 28~45 km, such as Junggar basin, Tarim basin, Qaidam basin, Yangtze basin area, North China basin area, Songliao basin, Erlian basin and Hoh Xil-Bayan Har area. Among them the Curie depths of Tarim basin and Yangtze basin show obvious depression with values ranging from 28 to 42 km, which correspond to the feature of rigid basement. Hoh Xil-Bayan Har area shows NWW trending depression of Curie point isotherm with depth of 30~45 km, because of thick sedimentary cover and less tectonic and magmatic activity. The feature of North China basin area is complex, because it suffered strong deformation that caused upwelling of the asthenosphere and the thinning of the lithosphere. Therefore, the depths of North China basin area are distinctly shallower than Tarim basin and Yangtze basin area, the depths range from 18~37 km. the Songliao basin has a relatively high heat flow values, so the Curie depth is shallow ranging from 26~32 km.
The Curie point isotherm of fold belts is characterized by uplift with depth of 20~26 km, such as Northeast Mtn. area, Northwest Mtn. area, Qinling-Dabie, Western Kunlun-Tibet-Sanjiang-Kang Dian area and Southeast Coast. These areas have intense tectonic and magmatic activity and high heat flow values. In the northeast Mtn. area, large areas of granites are distributed in the periphery of Songliao basin, indicating that the tectonic and magmatic activities in this area are very active. The seismic data show that there are low resistivity and low velocity layers in the crust, which might be caused by high temperature brine or magma chamber. Therefore, magmatic activity may be the main reason for the uplift of the Curie point isotherm in the northeast Mtn. area; the depths are about 18~26 km. The western Kunlun-Tibet-Sanjiang-Kang Dian area is the largest uplift zone of Curie point isotherm in China, showing a series of geothermal anomalies caused by the collision between the Indian plate and the Eurasian plate.
We analyzed the correlation between Curie depth and 816 heat flow data, the result indicated the Curie depths have weak negative correlation with heat flow and geothermal gradient, but they are not a simple linear correlation. The geothermal gradient and heat flow were significantly decreased with the increasing of Curie depths. When the Curie depth reached more than 30 km, the heat flow values were less than 100 mW·m-2 and the geothermal gradients were less than 50 K·km-1.
ACKNOWLEDGMENTSThis work has collected many valuable data of previous studies, and the compilation of the Curie point isotherm map is based on 30 years’ work of China Aero Geophysical Survey and Remote Sensing Center for Land and Resources. This study was supported by the National Project of Surveys and Assessment for Geology and Mineral Resources of China (1212011087009) and National Program of High Technology Research and Development of China (2013AA063905) and Project from Key Laboratory of Airborne Geophysics and Remote Sensing Geology, Ministry of Land and Resources (2016YFL05). Thanks to anonymous reviewers for their valuable comments.
| [] | Agrawal P K, Thakur N K, Negi J G. 1992. MAGSAT data and Curie-depth below Deccan flood basalts (India). Pure and Applied Geophysics , 138 (1) : 61-75. DOI:10.1007/BF00876714 |
| [] | Bansal A R, Anand S P, Rajaram M, et al. 2013. Depth to the bottom of magnetic sources (DBMS) from aeromagnetic data of Central India using modified centroid method for fractal distribution of sources. Tectonophysics , 603 : 155-161. DOI:10.1016/j.tecto.2013.05.024 |
| [] | Bhattacharyya B K, Leu L K. 1975. Analysis of magnetic anomalies over Yellowstone National Park:Mapping of Curie point isothermal surface for geothermal reconnaissance. J. Geophys. Res. , 80 : 4461-4465. DOI:10.1029/JB080i032p04461 |
| [] | Bilim F. 2007. Investigations into the tectonic lineaments and thermal structure of Kutahya-Denizli region, western Anatolia, from using aeromagnetic, gravity and seismological data. Physics of the Earth and Planetary Interiors , 165 (3-4) : 135-146. DOI:10.1016/j.pepi.2007.08.007 |
| [] | Blakely R J. 1988. Curie temperature isotherm analysis and tectonic implications of aeromagnetic data from Nevada. J. Geophys. Res. , 93 (B10) : 11817-11832. DOI:10.1029/JB093iB10p11817 |
| [] | Bouligand C, Glen J M G, Blakely R J. 2009. Mapping Curie temperature depth in the western United States with a fractal model for crustal magnetization. J. Geophys. Res. , 114 : B11104. DOI:10.1029/2009JB006494 |
| [] | Chiozzi P, Matsushima J, Okubo Y, et al. 2005. Curie point depth from spectral analysis of magnetic data in centralsouthern Europe. Physics of the Earth and Planetary Interiors , 152 (4) : 267-276. DOI:10.1016/j.pepi.2005.04.005 |
| [] | Connard G, Couch R, Gemperle M. 1983. Analysis of aeromagnetic measurements from the Cascade Range in central Oregon. Geophysics , 48 (3) : 376-390. DOI:10.1190/1.1441476 |
| [] | Deng J F, Wei W B, Qiu R Z, et al. 2007. The Three Dimensional Structure of Lithosphere and its Evolution in North China (in Chinese)[M]. Beijing: Geological Publishing House . |
| [] | Dolmaz M N, Hisarli Z M, Ustamer T, et al. 2005. Curie point depths based on spectrum analysis of aeromagnetic data, west Anatolian extensional province, Turkey. Pure and Applied Geophysics , 162 (3) : 571-590. DOI:10.1007/s00024-004-2622-2 |
| [] | Gao G M, Kang G F, Bai C H, et al. 2013. Distribution of the crustal magnetic anomaly and geological structure in Xinjiang, China. Journal of Asian Earth Sciences , 77 : 12-20. DOI:10.1016/j.jseaes.2013.08.014 |
| [] | Gao R, Xiao X C, Kao H, et al. 2002. Summary of deep seismic probing of the lithospheric structure across the West Kunlun-Tarim-Tianshan. Geological Bulletin of China (in Chinese) , 21 (1) : 11-18. |
| [] | Gao S, Zhang B R, Jin Z M, et al. 1999. Lower crustal delamination in the Qinling-Dabie orogenic belt. Science China Earth Sciences , 42 (4) : 423-433. |
| [] | Guimaraes S N P, Ravat D, Hamza V M. 2014. Combined use of the centroid and matched filtering spectral magnetic methods in determining thermomagnetic characteristics of the crust in the structural provinces of Central Brazil. Tectonophysics , 624-625 : 87-99. DOI:10.1016/j.tecto.2014.01.025 |
| [] | Hahn A, Kind E G, Mishra D C. 1976. Depth estimation of magnetic sources by means of Fourier amplitude spectra. Geophys. Prospect. , 24 (2) : 287-308. DOI:10.1111/gpr.1976.24.issue-2 |
| [] | Han B. 2008. Geophysical field and deep tectonic features of East China Sea[Ph. D. thesis] (in Chinese). Qingdao:Institute of Oceanology, Chinese Academy of Sciences. |
| [] | Hao S J, Gao H G, Wang C H. 1982. Isothermal surface of Curie temperature around the Beijing area and its relation to earthquakes. Acta Geophysica Sinica (in Chinese) , 25 (3) : 264-269. |
| [] | He D F, Zhai G M, Kuang J, et al. 2005. Distribution and tectonic features of paleo-uplifts in the Junggar basin. Chinese Journal of Geology (in Chinese) , 40 (2) : 248-261. |
| [] | Hou C C. 1989. Method for calculating and compiling the map of Curie point surface. Computing Techniques for Geophysical and Geochemical Exploration (in Chinese) , 11 (4) : 306-311. |
| [] | Hu S B, He L J, Wang J Y. 2001. Compilation of heat flow data in the China continental area (3rd edition). Chinese J. Geophys. (in Chinese) , 44 (5) : 611-626. |
| [] | Hu X Z, Xu M J, Xie X A, et al. 2006. A characteristic analysis of aeromagnetic anomalies and Curie point isotherms in Northeast China. Chinese J. Geophys. (in Chinese) , 49 (6) : 1674-1681. |
| [] | Jia S X, Liu B J, Xu C F, et al. 2014. The crustal structures of the central Longmenshan along and its margins as related to the seismotectonics of the 2008 Wenchuan Earthquake. Science China Earth Sciences , 57 (4) : 777-790. DOI:10.1007/s11430-013-4744-9 |
| [] | Li C F, Chen B, Zhou Z Y. 2009. Deep crustal structures of eastern China and adjacent seas revealed by magnetic data. Science China Series D:Earth Sciences , 52 (7) : 984-993. DOI:10.1007/s11430-009-0096-x |
| [] | Li P L, Feng J H, Fan T L, et al. 2010. Tarim Basin Sedimentary Structure and Reservoir (in Chinese)[M]. Beijing: Geological Publishing House . |
| [] | Liu G X, Zhang X, He W M, et al. 1996. Research on curie iso-geothermal surface in Bohai Sea and its adjacent region. Seismology and Geology (in Chinese) , 18 (4) : 398-402. |
| [] | Liu S H, Shen N H. 1999. Some problems about interpretation of lithospheric curie isothermal surface. Journal of Changchun University of Science and Technology (in Chinese) , 29 (4) : 373-376. |
| [] | Liu Y Z, Li L C, Zhou X M, et al. 2012. Application of regional aeromagnetic data in predicting the northern regional geothermal field in Songliao Basin. Chinese J. Geophys. (in Chinese) , 55 (3) : 1063-1069. DOI:10.6038/j.issn.0001-5733.2012.03.037 |
| [] | Lu B F, Zhang Y Q, Yang S Y. 2011. Characteristics of structural system and its implication for formation dynamics in Qaidam basin. Geological Review (in Chinese) , 57 (2) : 167-174. |
| [] | Maus S, Gordon D, Fairhead D. 1997. Curie-temperature depth estimation using a self-similar magnetization model. Geophys. J. Int. , 129 (1) : 163-168. DOI:10.1111/gji.1997.129.issue-1 |
| [] | Okubo Y, Graf R J, Hansen R O, et al. 1985. Curie point depths of the Island of Kyushu and surrounding areas, Japan. Geophysics , 50 (3) : 481-494. DOI:10.1190/1.1441926 |
| [] | Rajaram M, Anand S P, Hemant K, et al. 2009. Curie isotherm map of Indian subcontinent from satellite and aeromagnetic data. Earth and Planetary Science Letters , 281 (3-4) : 147-158. DOI:10.1016/j.epsl.2009.02.013 |
| [] | Ravat D, Pignatelli A, Nicolosi I, et al. 2007. A study of spectral methods of estimating the depth to the bottom of magnetic sources from near-surface magnetic anomaly data. Geophys. J. Int. , 169 (2) : 421-434. DOI:10.1111/gji.2007.169.issue-2 |
| [] | Ross H E, Blakely R J, Zobak M D. 2004. Testing the utilization of aeromagnetic data for the determination of Curieisotherm depth.//American Geophysical Union, Fall Meeting 2004. AGU. |
| [] | Ruiz F, Introcaso A. 2004. Curie point depths beneath Precordillera Cuyana and Sierras Pampeanas obtained from spectral analysis of magnetic anomalies. Gondwana Research , 7 (4) : 1133-1142. DOI:10.1016/S1342-937X(05)71089-3 |
| [] | Shuey R T, Schellinger D K, Tripp A C, et al. 1977. Curie depth determination from aeromagnetic spectra. Geophysical Journal International , 50 (1) : 75-101. DOI:10.1111/j.1365-246X.1977.tb01325.x |
| [] | Spector A, Grant F S. 1970. Statistical models for interpreting aeromagnetic data. Geophysics , 35 (2) : 293-302. DOI:10.1190/1.1440092 |
| [] | Tanaka A, Okubo Y, Matsubayashi O. 1999. Curie point depth based on spectrum analysis of the magnetic anomaly data in East and Southeast Asia. Tectonophysics , 306 (3-4) : 461-470. DOI:10.1016/S0040-1951(99)00072-4 |
| [] | Trifonova P, Zhelev Z, Petrova T, et al. 2009. Curie point depths of Bulgarian territory inferred from geomagnetic observations and its correlation with regional thermal structure and seismicity. Tectonophysics , 473 (3-4) : 362-374. DOI:10.1016/j.tecto.2009.03.014 |
| [] | Vacquier V, Affleck J. 1941. A computation of the average depth to the bottom of the earth's magnetic crust, based on a statistical study of local magnetic anomalies. EOS , 22 (2) : 446-450. |
| [] | Wan T F. 2011. The Tectonics of China Data, Maps and Evolution (in Chinese)[M]. Beijing: Geological Publishing House . |
| [] | Wang J Y, Huang S P. 1990. Heat flow data compilation of Chinese continent (2nd edition). Seismology and Geology (in Chinese) , 12 (4) : 351-363. |
| [] | Wang J Y, Hu S B, Pang Z H, et al. 2012. Estimate of geothermal resources potential for hot dry rock in the continental area of China. Science & Technology Review (in Chinese) , 30 (32) : 25-31. |
| [] | Wu G Y, Li Y J, Wang G L, et al. 2006. Volcanic Rocks of Jinningian Oceanic Islands in the Bachu Area, Western Xinjiang. Geoscience (in Chinese) , 20 (3) : 361-369. |
| [] | Wu Z C, Gao J Y, Zhao L H, et al. 2010. Characteristic of magnetic anomalies and curie point depth at northern continental margin of the South China Sea. Earth Science (in Chinese) , 35 (6) : 1060-1068. |
| [] | Xiong S Q, Zhou F H, Yao Z X. 2001. Aeromagnetic Survey in Central and Western Qinghal-Tibet Plateau (in Chinese)[M]. Beijing: Geological Publishing House . |
| [] | Xiong S Q, Fan Z G, Zhang H R, et al. 2013. Aeromagnetic Series Map of China's Land and Its Specification (1:5000000)(in Chinese)[M]. Beijing: Geological Publishing House . |
| [] | Xiong S Q, Ding Y Y, Li Z K. 2014. Characteristics of China continent magnetic basement depth. Chinese J. Geophys.(in Chinese) , 57 (12) : 3981-3993. DOI:10.6038/cjg20141211 |
| [] | Xiong X S, Gao R, Li Q S, et al. 2010. The Moho depth of northwest China revealed by seismic detection. Acta Geoscientica Sinica (in Chinese) , 31 (1) : 23-31. |
| [] | Zhang C D. 2013. Research on Development of Gravity Magnetic and Time Domain Electromagnetic Method (in Chinese)[M]. Wuhan: China University of Geoscience Press . |
| [] | Zhang X, Zhao L. 2003. Curie surface and aeromagnetic anomaly in Qinghai-Tibet Plateau. Journal of Geodesy and Geodynamics (in Chinese) , 23 (4) : 14-20. |