 2016, Vol. 59


2 College of Geoscience and Surveying Engineering, China University of Mining & Technology(Beijing), Beijing 100083, China;
3 Henan Polytechnic University, Jiaozuo Henan 454000, China
Coalfield seismic exploration has been used for tectonic identification and prediction of coal seams in the past ten years (Fang et al., 1997). A series of systematic theories and technologies have allowed seismic techniques to become the most direct and effective geophysical method for exploring geological conditions. However, there are still many problems faced by seismic techniques as predicting small faults or material composition, micro-scale structure or fluid interaction. Because of the lack of knowledge about coal elasticity, it becomes almost impossible to forecast the coal and gas outburst (Wang et al., 2014) or to substantially improve CBM (coalbed methane) drainage (Hou et al., 2012). Although drilling and well logging are successfully applied in identifying fluid, lithology, coal seam structure, coal quality, gas content, permeability, and so on (Zhao et al., 2008; Zhang, 2009), they are confined to a single borehole. Though joint inversion of well logging and seismic data is the most feasible approach to realize the regional evaluation of micro structure and other physical properties of coal seams, it’s necessary to understand the relationship between the elastic properties and physical properties of coal before inversion of seismic attributes. And ultrasonic experiments on coal can provide the most reliable and direct information to help seismic inversion, in spite of the frequency difference between the ultrasonic and seismic frequency band (Chen et al., 2009).
Ultrasonic testing of coal generally includes two categories, the single phase solid test (dry sample test) and the multiphase coupling test (fluid-saturated sample test). As coal mechanical strength is generally weak, compared with other sedimentary rocks, for example, shale, sandstone and limestone, especially in the water-saturated state, it is difficult to prepare coal samples with standard size and shape needed in ultrasonic experiment, such as cylinder. Moreover, a lot of researches were denoted to ultrasonic measurement of dry coal samples. For example, ultrasonic testing of rock cores from Carboniferous and Permian coal strata of five mining areas in China were done mainly with samples of shale and sandstone by Meng et al. (2008). It was found that there were good linear correlations between rock density and velocity of S-and P-wave; compared with surrounding sedimentary rock, coal cores show low velocity and density. Coal samples from Qinshui basin were measured under different confining pressures by Zhou (2012) in dry state. They observed P-and S-wave velocities increased with confining pressure and finally trended to a stable velocity as the confining pressure reached up to 10 MPa. In addition, they also found that the ultrasonic velocity varied with different azimuth, with the maximum and minimum velocities parallel and perpendicular to the fracture alignment, respectively. Guo et al. (1998) and Yan (2006) observed a similar behavior of coal P-wave velocity. Lü (1995) tested deformed coals and found that the deformed coals have obvious lower P-wave velocities than undeformed coal. By fabricating raw coal into a physical model containing aligned fractures and measuring ultrasonic velocities, Zhao et al. (2006) found that the P-and S-wave velocities and attenuations show azimuthal anisotropy, and the attenuation anisotropy of P-wave was stronger than the S-wave’s.
Krzesinska (1997) analyzed the chemical composition of outburst and non-outburst coals and measured ultrasonic P-waves. It was observed that the outburst-prone coal had higher ash content and density, but lower ultrasonic velocity. He inferred mineral impurities cause defects in the skeleton of outburst-prone coals and result in the decrease of their mechanical strength, which may make coal body outburst easily under combined effects of stress and gas pressure. Through ultrasonic laboratory measurement of coal samples with four levels of metamorphism under different pressure conditions, Morcote et al. (2010) obtained similar conclusions as Zhao et al. (2006) and Wang et al. (2012). It’s worth noting that velocities and elastic moduli increase with confining pressure bellow 5 MPa, and there is almost no difference of elasticity when exceeding this pressure, which may be closely related to the closure of compliant pores and fractures. Through conducting triaxial stress tests, ultrasonic tests and X-ray scanning on coal samples, Cai et al. (2014) analyzed crack extension characteristics and their influence on permeability, and found that P-wave velocity anisotropy varied with pressure and fracture evolution.
However, all these above experiments and analysis compared coal samples with conventional sedimentary rocks, such as shale and sandstones. As special fossil and mechanically weak sediment, coal elasticity is mainly related to composition and metamorphism, instead of density, cracks, and confining pressure only. Because the time and space distribution of coal occurrence in China are fairly wide and coal seams show stronger heterogeneity, the quantity of coal samples and metamorphic level in these ultrasonic experiments is not enough, and it’s difficult to conclude any comprehensive understanding of China coals. So, we have systematically collected 25 coal samples and conducted ultrasonic measurements on 8 samples under room temperature and pressure conditions for six levels of metamorphism from five mining areas in China. Some meaningful phenomena have been observed (Wang et al., 2012, 2013; Xu et al., 2014), however, the research still has the following drawbacks.
(1) The conclusions obtained need more experimental support from more coal samples with different metamorphism.
(2) Since the first arrivals of S-waves are submerged in the P-waves and various converted waves, there may be non-negligible errors in the calculations of velocity and quality factor of S-waves as the new method (Zhang et al., 2013) was not applied in the previous measurements.
(3) Due to the existence of coal bedding, cleats and fractures, there may be a certain degree of errors when picking up first arrival and calculating quality factor of P-waves. Therefore, we have additionally sampled and prepared five kinds of raw coal samples with different metamorphism from Huainan, Pingdingshan, Hebi and Jiaozuo coal fields in China. Total 30 coal samples (including the original 8 samples), belonging to 6 metamorphism degrees, were collected and tested with ultrasonic wave under room temperature and pressure. And then analyses have been done based on the characteristics of velocity and attenuation of both P-and S-waves, including their correlations with density, metamorphism, elastic moduli and anisotropy.
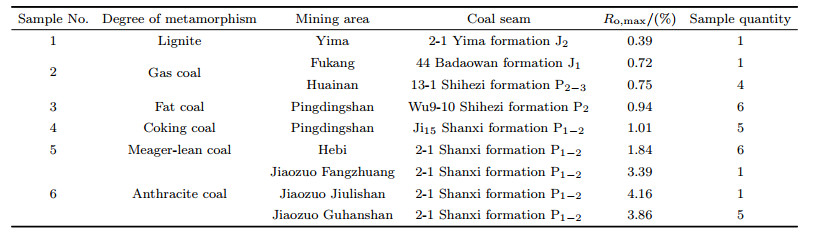
2 ULTRASONIC MEASUREMENTS 2.1 SamplesConsidering the coal’s fragility and sample size required by ultrasonic measurements, coal samples were cut and polished into 6 cm×6 cm×6 cm cubes so that they can couple well with ultrasonic transducers according to recommendations of the international society for rock mechanics (ISRM) (Ulusay, 2007). Every face of the cube was marked with three directions: strike, dip, and vertical to beddings, during underground sampling (GB/474-2008, a Chinese national standard), as illustrated in Fig. 1. A total of thirty samples from eight different coal mining areas are shown in Table 1 with Ro, max (coal vitrinite maximum reflectance), a common measurement representing the degree of coalification and metamorphism (Yu, 2000; Li et al., 2006; GB/T212-2008).

|
Fig. 1 Standard processed coal samples |
|
|
Table 1 Sample information |
Ultrasonic measurements have been done at room temperature (298 K) and a standard atmospheric pressure (1 atm) with the pulse transmission technique recommended by ISRM in 1978 (described in He, 2003; Wu, 2000). The system is composed of a pulse signal generator, ultrasonic transducer, amplifier, counter and oscilloscope, as shown in Fig. 2. Detailed specific test conditions are as follows.

|
Fig. 2 Block diagram of acoustic digital pulse testing system |
(1) Test frequency
We chose a low frequency for ultrasonic testing to avoid strong attenuation. Because sampling and ultra sonic testing have been conducted intermittently across 6 years, different ultrasonic frequencies were adopted in different experimental periods. In the previous experiment on 8 samples, the P-wave transducer was set to 100 kHz and S-wave to 250 kHz; and P-and S-wave frequencies were set to 250 kHz in the remaining 22 samples.
(2) Water condition
In the process of coal samples’ collecting and processing, the original content of free water, bound water and crystal water in raw coal was inevitably alerted. Because coal elasticity is affected by moisture and fluid to some extent (Lwin, 2011), the influence of the saturation state of the coal samples on their elasticity was not considered in the experiment. Consistent moisture conditions were ensured by exposing samples to natural air conditions for 7 days, then soaking in water for 24 hours, and then drying them in air for 5 hours.
(3) Load conditions
To maintain the consistency of loading conditions and ensure good coupling for all the samples, a clamp holder was used to attach the transducers to both ends of every sample at the same pressure. The pressure imposed on the holders was set to 10 kPa, taking into account the low hardness of coal samples.
(4) S-wave measurements
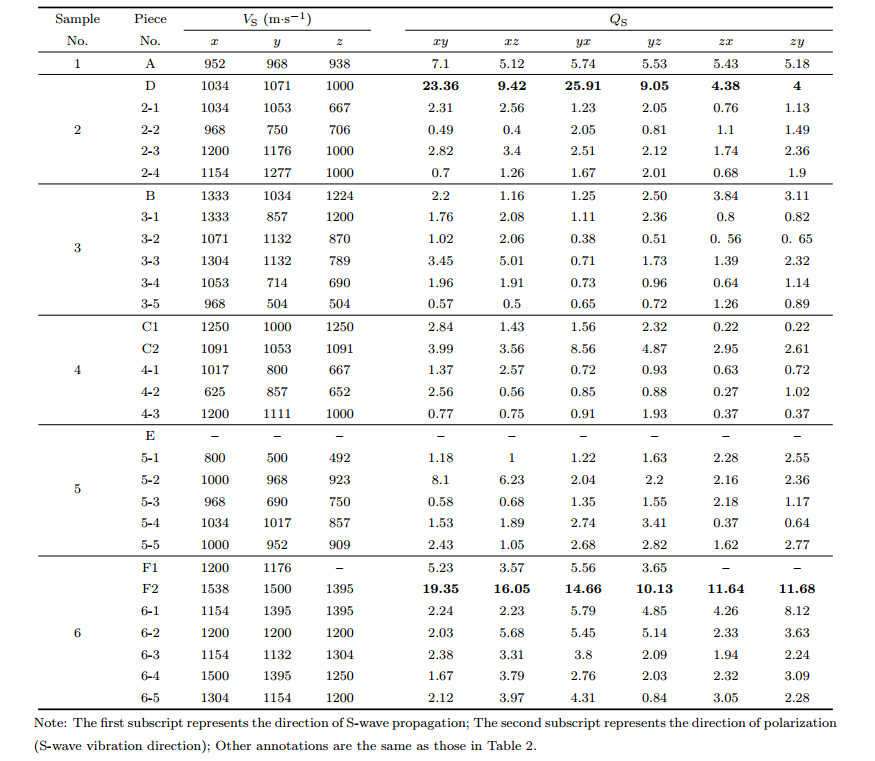
The signals in two orthogonal receiving transducers may contain not only transmission shear waves, but also SP-waves, multiples and various other converted waves. First arrivals of S-waves were interpreted empirically from the transmitted waveforms in the previous experiments of Wang et al.(2012, 2013) and Xu et al. (2014). In this experiment, to obtain more accurate first arrivals of shear waveform, S-waves were respectively simulated and recorded in two orthogonal polarization directions by two sensors. Then first arrivals could be filtered and picked out according to the polarization difference between P-and S-wave with the help of a designed broadband filter (Zhang et al., 2013). After gaining purer transmitted S-wave waveforms, calculation precision of the velocity and quality factor (Q) could be improved.
2.3 Testing Results and Elastic Modulus CalculationVelocity was still calculated with the method described by Wang et al. (2012). However, different from the previous experiment (Xu et al., 2014), in which the quality factor was estimated by using spectral ratio method (Tonn, 1991; Sun et al., 1988, ), Q values of all these 30 samples were uniformly calculated with the amplitude attenuation method (Hao et al., 2009). Calculated results of P-wave velocity (VP) and quality factor (QP) are shown in Table 2; and calculated results of S-wave velocity (VS) and quality factor (QS) are shown in Table 3. Among them, the samples marked as A, B, C1, C2, D, E, F1, F2 are the same ones used in earlier experiments (Wang et al., 2012, 2013; Xu et al., 2014). According to GB/T6949-1998, the density is apparent density, and is also called bulk density in seismology.
|
|
Table 2 VP and QP |

|
|
Table 3 VS and QS |
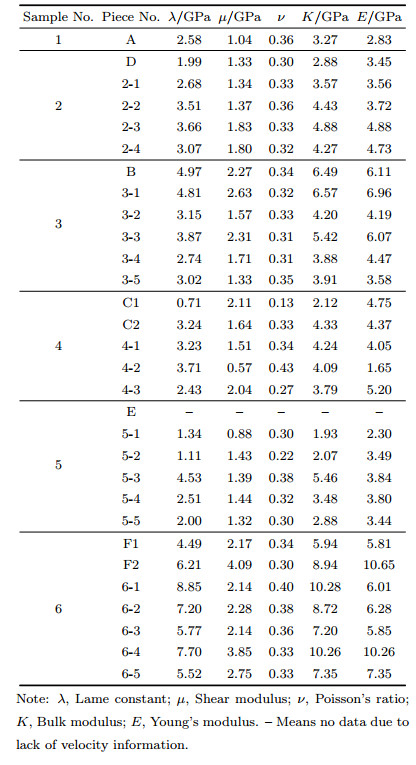
From the known density (ρ), VP and VS in the three directions, five elastic parameters in each direction, including Lame constant (λ), shear modulus (µ), Poisson’s ratio (ν), bulk modulus (K) and Young’s modulus (E) can be calculated (Chen, 2009; Hu, 1989). In this paper, most of the analysis on elastic parameters is given priority to those in the direction perpendicular to beddings (hereinafter referred to as the vertical direction), since P-wave is mainly used in current coalfield seismic exploration. The calculation results of elastic parameters in the vertical direction are shown in Table 4, and the other two directions are respectively attached in Appendix Tables 1 and 2.
|
|
Table 4 Calculated results of five dynamic elastic parameters for raw coal in the direction perpendicular to the beddings |

According to Table 2 to Table 4, it can be found that there are great differences among P-and S-wave elastic parameters, even for the same level of metamorphism. Although the density difference is generally less than 10%, the velocity difference can be up to more than 30%, which demonstrates that bulk density is not the main or only influence factor on coal velocity. Sedimentation, metamorphism and existence of fractures beddings and cleats can also affect coal’s elastic moduli. Therefore, the following analyses and discussions will be given to the relations between coal compositions, metamorphism and elastic moduli, as needed by coalfield seismic inversion.
3.1 Velocity and Its Anisotropy 3.1.1 Relationship between velocity and densitySince it is essential to apply a basic transformation formula about density and P-wave velocity in the vertical direction during joint inversion of well logging and seismic data, a more precise conversion formula– Wang formula (1), V=180309ρ− 580.82 (Wang et al., 2012), had been given through the previous ultrasonic experiment of 8 samples, compared with the conventional Gardner formula (Gardner et al., 1974). However, according to the experimental results of 30 samples shown in Table 2 and Fig. 3a, there is not a simple linear correlation between vertical P-wave velocity and density, although vertical P-wave velocity trends to increase with density on the whole. It’s worth noting that Wang formula (1) describes the relation between density and mean values of the vertical P-wave velocity for samples which have the same level of metamorphism. In practice, due to the difference of composition and micro structure among coal samples at the same metamorphism, a certain degree of local variation exists in general linear trend. Moreover, vertical P-wave velocity estimated by Gardner formula is much less than the actual value for each sample and its error is still much greater than Wang formula (1).

|
Fig. 3 (a) Relation of P-wave velocity in vertical direction and apparent density; (b) The relationship between the vertical P-wave impedance and velocity |
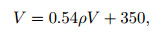
As P-wave impedance is mostly used in joint inversion of well logging and seismic data, it is significant to analyze relationships between the vertical P-wave velocity and impedance. Fig. 3b shows a good linear correlation between the vertical P-wave impedance and velocity. Just as Lindseth formula (Lindseth, 1979), a more precise fitting formula, which describes the relation between the vertical P-wave velocity and density with fitting accuracy up to 95%, can be written as
|
(1) |
in which, V is the vertical P-wave velocity, unit m·s−1; ρ is apparent density, also known as bulk density, unit g·cm−3. The formula will be more suitable for coals with different metamorphism in China.
After averaging velocity and impedance of different samples with same metamorphism, it can still be concluded that the P-wave impedance generally decreases from the strike, dip to the vertical direction successively. And the velocities of P-and S-waves also show similar characteristics, which is identical with Wang et al. (2012).
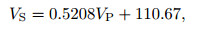
3.1.2 Relationship between VP and VSS-wave velocity (VS) is an important parameter in the elastic inversion. In the cases that lack dipole logging, or conversion formula of P-wave velocity (VP) versus S-wave velocity (VS) statistically deduced by ultrasonic measurements, Castagna formula (Castagna et al., 1994) is frequently used in sedimentary rocks and widely accepted in the oil industry. Fig. 4 shows that there is a good linear relationship between vertical VP and VS, and Wang formula (2), VS=0.3775VP + 264.03 (Wang et al., 2012), has a higher accuracy than Castagna formula. However, considering the increased sample number and the better correlation coefficient of 93%, it is suggested that Wang formula (2) should be replaced by
|
(2) |
in which VP represents P-wave velocity, unit m·s−1; and VS represents S-wave velocity, unit m·s−1.

|
Fig. 4 Relationship between VP and VS in vertical direction |
Because the application of velocity in current seismic exploration is limited mostly to the vertical direction, the relationships between VP and VS in the other two directions will not be discussed.
3.1.3 Velocity anisotropyAfter averaging S-wave velocities at two orthogonal polarizing directions for the same samples, and using the vertical velocity as the dominator, i.e. setting velocity anisotropy factor equal to (v −v⊥)/v⊥ × 100% (v represents strike or dip velocity, v⊥ is the vertical one), there will be obvious differences among the three directional velocities as illustrated in Fig. 5. It can be seen that the velocities in three directions show anisotropy for most samples. And in general, the strike velocity is the largest and the vertical velocity is the smallest. So the following statistical characteristics can be concluded: (1) P-and S-wave velocities of most samples in strike and dip direction are larger than the vertical; (2) Velocity anisotropies in the strike and dip show a wider range from –40% to 120%, of which, the average VP anisotropy is larger than VS. That is to say, VP has a more pronounced anisotropy anomaly, which may be useful for coal seam identification.

|
Fig. 5 The velocity differences of each sample in three directions |
In coalfield seismic exploration, water and gas saturation or destruction of coal structure can all cause inelasticity. Therefore, it is critical to analyze the quality factor to understand the attenuation of seismic waves in coal. According to the comparison between different samples in Tables 2 and 3, it can be deduced that the quality factor of coal is generally low, far lower than conventional sedimentary rock, such as shale and sandstone (Nie et al., 2007), which indicates that there is more obvious viscoelasticity in coal. From Fig. 6, it can be found that the P-wave quality factor (QP) is usually less than 1, and S-wave quality factor (QS) is generally larger than P-wave. This behavior is also observed by Zhao et al. (2006), but it is inconsistent with Q obtained by the spectral ratio method in our previous experiments (Xu et al., 2014). This inconsistency, mainly attributed to the abnormal data with bold font in Tables 2 and 3, can be explained by considering the difference of frequency used in ultrasonic testing and the difference of method used for calculating attenuation since the quality factor is frequency dependent (Futterman, 1962). Considering the improvement of waveform extraction and the fact that shear wave mainly propagates along the skekton of solid, it can be believed that the results in this experiment are more precise than the previous one.

|
Fig. 6 Quality factors of P-and S-waves in the vertical direction |
So, in order to eliminate the attenuation difference caused by different frequencies, only the experimental data of 250 kHz were analyzed in the following sections.
3.2.1 Relationship between quality factor and velocityIn multi-wave data processing and inversion, a priori information about velocity and quality factor is important in the process of attenuation compensation and spectral broadening. Therefore, establishing a relationship between wave velocity and quality factor is beneficial for coalfield multi-component seismic exploration. The relationship between QP/QS and VP/VS in the vertical direction is shown in Fig. 7a. The data does not show a hyperbolic relation such as 4/QS ≈ 3γ2/QP (referred as Wang formula (3) in the following, where γ=VP/VS) derived by Wang (Wang et al., 2009). The S-wave quality factor predicted by Wang formula (3) is significantly lower than the corresponding measured value, as shown in Fig. 7b. Considering the actual temperature and pressure conditions in-situ and the frequency dependence of the quality factor, we could speculate that the relationship of P-and S-wave quality factors observed in this ultrasonic experiment may not be applicable to field seismic exploration.

|
Fig. 7 (a) Relationship between QP/QS and VP/VS in the vertical direction; (b) The comparison of theoretical estimated values (Wang et al., 2009) and actual measured values |
The experimental results show that the quality factor also has anisotropy. The quality factor in strike is close to the one in dip direction, but the vertical quality factor is relatively small for most samples, which illustrates that ultrasonic waves attenuate more along vertical stratification. The Q anisotropy is larger than the velocity anisotropy for most samples, as shown in Fig. 8. This phenomenon was also found in previous lab tests (Xu et al., 2014).

|
Fig. 8 The quality factor anisotropy |
According to Table 4 and comparison of modulus between different directions, illustrated in Fig. 9, the following characteristics of coal elasticity can be summarized: (1) The elastic moduli of coal are all relatively small compared to other sedimentary rocks, such as shale, sandstone or limestone, which may be related to their weak mechanical strength; (2) All moduli in the strike direction are close to those in dip, but the vertical moduli are significantly lower; (3) Except for the Poisson’s ratio, elastic moduli increase with density and metamorphism, but, there is no obvious monotonic relation; (4) The Poisson’s ratio of coal is usually about 0.3, and some are less than 0.2. That may be caused by tectonic damage and fractures. All the five elastic parameters, such as Lame constant (λ), shear modulus (µ), Poisson’s ratio (λ), bulk modulus (K) and Young’s modulus (E) were calculated with P-and S-wave velocities. And their anisotropy will not be discussed in this paper.

|
Fig. 9 Moduli versus Bulk density. (a) Poisson’s ratio; (b) Elasticity moduli |
In the evaluation of coalbed methane resource and coal metamorphism, maximum vitrinite reflectance (Ro, max) is one of the main indicators. Coal and methane resource exploration and development would benefit greatly if Ro, max can be quantitatively predicted with seismic inversion. So, the relationships between maximum vitrinite reflectance and elastic parameters were discussed in Wang et al. (2013) and Xu et al. (2014). On the basis of this experiment with more samples, regression analyses have been also done for Ro, max versus elastic moduli in three directions, and versus vertical impedance, as shown in Fig. 10. Linear relationships between Ro, max and µ, E are fitted with correlation coefficients greater than 90%. However, the tendency of Ro, max increasing with elastic moduli may not be so simple since there is a lack of samples with moderate metamorphism, i.e. Ro, max from 2 to 3.5.

|
Fig. 10 (a) Ro, max versus elasticity moduli; (b) Ro, max versus the vertical impedance |
Further regression analyses have been done for the relationships between Ro, max and the mean values of QP, QS in three directions, which show strong positive correlations in accordance with Xu et al. (2014).
4 DISCUSSIONS AND CONCLUSIONS 4.1 DiscussionsAccording to the above analysis in this paper, it should be mentioned that there are some inconsistence between this lab test and the previous, such as the relation of quality factor versus velocity, correlation between QP and QS in the vertical direction (Xu et al., 2014), and inconsistencies with the formula introduced by Wang et al. (2009). As a strongly heterogeneous medium, with different sedimentary and metamorphic environment and tectonic history, more samples testing is always profitable to improve accuracy of the conclusions given in this paper.
In order to promote the application of seismic inversion technology in coalfield, some elastic parameters of coal, which can be predicted in seismic inversion, have been associated with coal physical and geological properties. And some meaningful characteristics have been summarized to provide some physical insights for seismic inversion. But considering the difference between ultrasonic and seismic frequency, and the difference between lab and in-situ temperature and pressure, characteristics summarized in this experiment are still preliminary and require continuous corrections (Chen et al., 2013), especially temperature and pressure corrections.
4.2 ConclusionsAccording to the ultrasonic testing and analysis of more coal samples compared with the previous lab tests (Wang et al., 2012, 2013, 2014; Xu et al., 2014), the following conclusions are worth highlighting.
(1) Larger errors are generated if the Gardener formula is used for describing the relationship between vertical P-wave velocity and density in China during coal seismic inversion, compared with the statistical Formula (1) given in this paper.
(2) In elastic wave inversion, Formula (2) will have higher accuracy in the case of lack of in-situ S-wave velocity.
(3) VP and VS decline along strike, dip and vertical directions, respectively, and the horizontal velocity is far greater than the vertical one. VP anisotropy is higher than VS, and is usually larger than 10%, which does not meet the criteria for a weakly anisotropic medium given by Thomsen (1986). Therefore, it should be careful to apply the weak anisotropy approximations.
(4) QP and QS of coal are both anisotropic and are generally larger than the velocity anisotropy. Since QS is generally larger than QP, it could be an advantage if S-waves be used in coal seam seismic exploration.
(5) Coal elastic moduli are lower than other conventional sedimentary rocks under normal temperature and pressure. The common five moduli, Poisson’s ratio (ν), Lame constant (λ), shear modulus (µ), bulk modulus (K) and Young’s modulus (E), decrease respectively in strike, dip and vertical directions.
(6) Good correlations exist between Ro, max and bulk density, vertical P-and S-wave impedance, shear modulus and Young’s modulus. Therefore, it’s possible to predict coal metamorphism quantitatively by using seismic inversion.
Appendix|
|
Appendix Table 1 Calculated results of five dynamic elastic parameters for raw coal in the direction of strike |
|
|
Appendix Table 2 Calculated results of five dynamic elastic parameters for raw coal in the direction of dip |
This work was supported by the National Natural Science Foundation of China (41425017, 41374131, 41574126, 41504107), and the equipment development project of Chinese Academy of Sciences-"multi-phase elastic wave measuring system of oil and gas reservoir rocks under the conditions of high temperature and pressure" (YZ201207). Prof. Wei J X, of China University of Petroleum (Beijing) is thanked for providing technical support for the ultrasonic measurements. Research faculty Wang W P and Dr. Jesse Havens in Colorado School of Mines Rock Physics Lab, and an anonymous geophysical reviewer should be thanked for their corrections in English writing. Prof. Mike Batzle should be given more respect and thank for his long time help and advisory to our Multi-Wave and Multi-Component research group in Chinese Academy of Sciences.
| [] | Cai Y D, Liu D M, Mathews J P, et al. 2014. Permeability evolution in fractured coal-Combining triaxial confinement with X-ray computed tomography, acoustic emission and ultrasonic techniques. International Journal of Coal Geology , 122 : 91-104. DOI:10.1016/j.coal.2013.12.012 |
| [] | Castagna J P, Smith S W. 1994. Comparison of AVO indicators:A modeling study. Geophysics , 59 (12) : 1849-1855. DOI:10.1190/1.1443572 |
| [] | Chen X P, Huo Q M, Lin J D, et al. 2013. The inverse correlations between methane content and elastic parameters of coal-bed methane reservoirs. Geophysics , 78 (4) : D237-D248. DOI:10.1190/geo2012-0352.1 |
| [] | Chen Y, Huang T, Liu E R. 2009. Rock Physics (in Chinese)[M]. Hefei: Press of University of Science and Technology of China . |
| [] | Fang Z, Shi Z Z, Zhao P. 1997. Challenge and opportunity to coalfield seismic prospecting in China. Journal of China Coal Society (in Chinese) , 22 (S) : 94-97. |
| [] | Futterman W I. 1962. Dispersive body waves. Journal of Geophysical Research , 67 (13) : 5279-5291. DOI:10.1029/JZ067i013p05279 |
| [] | Gardner G H F, Gardner L W, Gregory A R. 1974. Formation velocity and density-the diagnostic basics for stratigraphic traps. Geophysics , 39 (6) : 770-780. DOI:10.1190/1.1440465 |
| [] | Guo D Y, Han D X, Feng Z L. 1998. Experimental research on wave velocity of deformed coal characteristics under the ambient pressure. Coal Science and Technology (in Chinese) , 26 (4) : 21-23. |
| [] | Hao Z B, Qin J X, Wu X Y. 2009. Overview of research on the seismic wave quality factor (Q). Progress in Geophys. (in Chinese) , 24 (2) : 375-381. |
| [] | He Y J, Ma X K. 2003. Modern Physics Experiments (in Chinese)[M]. Beijing: Tsinghua University Press . |
| [] | Hou Q L, Li H J, Fan J J, et al. 2012. Structure and coalbed methane occurrence in tectonically deformed coals. Science China:Earth Sciences , 55 (11) : 1755-1763. DOI:10.1007/s11430-012-4493-1 |
| [] | Hu D S. 1989. The Dynamics of the Elastic Wave (in Chinese)[M]. Beijing: Geology Press . |
| [] | Krzesinska M. 1997. Ultrasonic studies of outburst-prone coals. International Journal of Rock Mechanics and Mining Sciences , 34 (1) : 167-171. DOI:10.1016/S1365-1609(97)80045-7 |
| [] | Li WH, Bai X F, Yang J H, et al. 2006. Correspondence between mean maximum reflectance of vitrinite and classification of bituminous coals. Journal of China Coal Society (in Chinese) , 31 (3) : 342-345. |
| [] | Lindseth R O. 1979. Synthetic Sonic Logsa process for stratigraphic interpretation. Geophysics , 44 (1) : 3-26. DOI:10.1190/1.1440922 |
| [] | Lü S L. 1995. Theoretical basis of predicting coal structure with ultrasonic measuring instrument in hole. Journal of Jiaozuo Mining Institute (in Chinese) , 14 (1) : 54-59. |
| [] | Meng Z P, Liu C Q, He X H, et al. 2008. Experimental research on acoustic wave velocity of coal measures rocks and its influencing factors. Journal of Mining and Safety Engineering (in Chinese) , 25 (4) : 390-394. |
| [] | Morcote A, Mavko G, Prasad M. 2010. Dynamic elastic properties of coal. Geophysics , 75 (6) : E227-E234. DOI:10.1190/1.3508874 |
| [] | Nie B S, He X Q, Li X C, et al. 2007. Research on attenuation characteristic of sound wave in coal or rock body. Journal of Coal Science and Engineering (China) , 13 (2) : 154-158. |
| [] | Sun J Z, Zhao H R, Zhang K Y. 1988. Supersonic methods for determining the Q value of material. Oil Geophysical Prospecting (in Chinese) , 23 (6) : 699-708. |
| [] | Thomsen L. 1986. Weak elastic anisotropy. Geophysics , 51 (10) : 1954-1966. DOI:10.1190/1.1442051 |
| [] | Tonn R. 1991. The determination of the seismic quality factor Q from VSP data:A comparison of different computational methods. Geophysical Prospecting , 39 (1) : 1-27. DOI:10.1111/gpr.1991.39.issue-1 |
| [] | Ulusay R, Hudson J A. 2007. The complete ISRM suggested methods for rock characterization, testing and monitoring:1974-2006[M]. Springer International Publishing AG . |
| [] | Wang Y, Lu J, Shi Y, et al. 2009. PS-wave Q estimation based on the P-wave Q values. Journal of Geophysics and Engineering , 6 (4) : 386-389. DOI:10.1088/1742-2132/6/4/006 |
| [] | Wang Y, Xu X K, Zhang Y G. 2012. Characteristics of P-wave and S-wave velocities and their relationships with density of six metamorphic kinds of coals. Chinese J. Geophys. (in Chinese) , 55 (11) : 3754-3761. DOI:10.6038/j.issn.0001-5733.2012.11.022 |
| [] | Wang Y, Zhang Y, Xu X. 2013. Relationship between the maximum vitrinite reflectance and the elastic parameters of coal:A lab ultrasonic measurement of 6 metamorphic kinds of coals. Chinese J. Geophys. (in Chinese) , 56 (6) : 2116-2122. DOI:10.6038/cjg20130631 |
| [] | Wang Y, Xu X K, Yang D Y. 2014. Ultrasonic elastic characteristics of five kinds of metamorphic deformed coals under room temperature and pressure conditions. Science China:Earth Sciences , 57 (9) : 2208-2216. DOI:10.1007/s11430-014-4922-4 |
| [] | Wu X Y. 2000. Study on acoustic wave and related property in petroleum fluid[Ph. D. thesis] (in Chinese). Beijing:Institute of Geology and Geophysics, Chinese Academy of Sciences. |
| [] | Xu X K, Wang Y, Meng Z P. 2014. Quality factor characteristics of six metamorphic kinds of coals. Chinese J. Geophys.(in Chinese) , 57 (2) : 644-650. DOI:10.6038/cjg20140227 |
| [] | Yan L H. 2006. Relationship study between characteristics and strength of coal and rock wave velocity in Yangzhuang Mine. Coal Science and Technology (in Chinese) , 34 (6) : 57-60. |
| [] | Yu J S. 2000. Chemistry of Coal (in Chinese)[M]. Beijing: Metallurgical Industry Press . |
| [] | Zhang J L, Wang Y, Zhang Y G. 2013. Application of shear wave polarization method in ultrasonic measurement of coal samples. Journal of China Coal Society (in Chinese) , 38 (7) : 1220-1226. |
| [] | Zhang S Y. 2009. Actualities and progresses of coalbed methane geophysical logging technologies. Well Logging Technology(in Chinese) , 33 (1) : 9-15. |
| [] | Zhang Z, Qin Y, Wang G X, et al. 2013. Numerical description of coalbed methane desorption stages based on isothermal adsorption experiment. Science China:Earth Sciences , 56 (6) : 1029-1036. DOI:10.1007/s11430-013-4597-2 |
| [] | Zhao B Z, Zheng Y G, Wu Z Y. 2008. An elementary introduction to CBM logging technology. Coal Geology of China(in Chinese) , 20 (12) : 32-33. |
| [] | Zhao Q, Hao S L. 2006. Anisotropy test instance of ultrasonic velocity and attenuation of coal sample. Progress in Geophysics (in Chinese) , 21 (2) : 531-534. |
| [] | Zhou F. 2012. Experiment of influence of fractures on coal/rock acoustic velocity:with Carboniferous seams of Qinshui basin as example. Coal Geology and Exploration (in Chinese) , 40 (2) : 71-74. |