 2016, Vol. 59


2. NCPC Key Lab of Geophysical Exploration, China University of Petroleum, Beijing 102249, China;
3. Exploration and Development Research Institute of Daqing Oilfield Company Ltd., Daqing Heilongjiang 163712, China
Seismic frequency-dependent amplitude variations versus offset (AVO) is a technique proposed following the development of rock physics studies. The key of the method is to interpret the frequency-dependent abnormal seismic reflections in terms of rock physics. The basic assumption is that frequency-dependent elastic modulus leads to frequency-dependent reflection coefficients within the seismic b and width. The development of the frequency-dependent AVO relies on the improvement of rock physics methods. Currently,the rock physics models used in the method include the multi-scale equant porosity model proposed by Chapman (2003) and Chapman et al. (2003) ,the patch-saturated model proposed by White (1975) , and those models developed by Johnson (2001) ,Carcione et al. (2003) ,Carcione and Picotti (2006) and Quintal et al. (2007) based on the White model.
According to these rock physics models,Chapman and Liu (2005) ,Chapman et al. (2005,2006) and Liu et al. (2006) researched the applications of the frequency-dependent AVO on reservoir fluid identification. Quintal et al. (2007) ,Ren et al. (2009a,2009b) and Teng et al. (2013) classified frequency-dependent AVO based on forward modeling and the White model. Liu et al. (2011) investigated the frequency-dependent AVO according to the Biot's theory and Zhao et al. (2014) researched the issue from the theory of attenuation and viscoelasticity. Chen (2009) summarized the development of the frequency-dependent AVO method and prospected further applications of this technique. Xuan et al. (2010) ,Liu (2011) ,Cheng et al. (2012) and Lu (2013) discussed the applications of the method on the identification of reservoir fluids.
In spite of these progresses of the frequency-dependent AVO technique in fluids identification,deep mechanism of the frequency-dependent seismic reflections deserves further investigation. Current studies usually use conventional Zoeppritz equations that are based on the single interface model while have not considered the effects of layered structures. Liu et al. (2006) found that seismic reflections from oil- and gas-bearing reservoirs do not show the abnormal high amplitude at low-frequency. This may be due to tuning and interferences of the b and width-limited seismic reflections that lead to the frequency-dependency of the complicated waveforms (Gao et al., 2003,2006; Li et al., 2012,2013) . Thus,both the effects of attenuation and dispersion and the effect of layered structure need to be considered in the study of the frequency-dependent AVO.
As shown in Fig. 1,we compute frequency-dependent AVO responses based on the generalized propagator matrix method (Carcione,2001; Guo,2008; Guo et al. 2014) . Compared with traditional methods,the advantages of the proposed method include: First,based on the propagator matrix method,both the effects of dispersion and attenuation associated with lithology and the effects of thin bed and interbed associated with layered structures,as well as anisotropy can be considered in the calculation of frequency-dependent AVO responses.

|
Fig.1 Comparisons between conventional and improved workflows for frequency-dependent AVO |
Second,the method realizes the seamless link between the rock physics modeling and the calculation for frequency-dependent reflection coefficients. The propagator matrix method implements the calculation in the frequency domain and deals with complex modulus,thus the output frequency-dependent complex modulus from the rock physics model can be input straightforwardly to the propagator matrix method, and therefore dispersion and attenuation related to lithology can be accurately considered. By contrast,traditional Zoeppritz method is based on elastic assumption, and can only deal with the real part of the complex modulus while ignoring imaginary parts of the complex modulus.Third,the proposed method is able to consider dispersion and attenuation resulting from various mechanisms in the same model. For example,in an interbedded structure,s and stone may represent velocity dispersion and attenuation described by the Chapman's fluid-squirt model,while shale may show inelasticity and anisotropy described by the Carcione's theory. This considers the common feature of rock physics models for inelastic medium where the strain-stress relations are constructed in the frequency domain and the outputs of the models are complex frequency-dependent modulus. In contrast,it is difficult for the conventional methods for the calculation of reflection coefficients or the theories for seismic modeling to consider different mechanisms of dispersion and attenuation in the same model.
Fourth,the spectra of reflected waves can be calculated by multiplying the frequency-dependent reflection coefficients with the wavelet spectrum, and the synthetics can be obtained by implementing inverse Fourier transform on the reflection spectra.
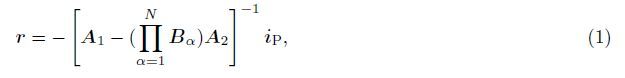
2 AVO THEORY OF THE INTERBEDFor the models of layered and interbedded structures in Fig. 2,reflection coefficients are not only associated with incidence angle,elastic parameters,but also with the frequency of incident waves,the thickness of reservoir layer and interbedded structures according to the theories of Kennett (1983) ,Rokhlin and Wang (1992) ,Ursin and Stovas (2002) and Liu and Schmitt (2003) . Meanwhile,inelasticity of the layer also contributes to dispersion and attenuation of seismic reflections. Generalized propagator matrix method considers these effects in the calculation of reflection coefficients (Carcione,2001) . For incident P wave,the vector of reflection and transmission coefficients r = [RPP,RPS,TPP,TPS]T can be computed by

|
(a) A layer of sandstone with finite thickness (b) An interbedded sandstone-shale layer. Fig.2 Layered model for seismic reflection |
Figure 2 illustrates that the interbed may consist of s and stone and shale that represent dispersion and attenuation due to different mechanisms. In this study,we describe the fluid-saturated s and stone using multi-scale fracture model (Chapman,2003 and Chapman et al., 2003) and model the shale using viscoelastic anisotropic theory (Carcione,1997) .
3.1 Multi-scale Fracture Model for S and stoneIn the multi-scale fracture rock physics model,fluids-squirt between pores and fractures leads to dispersion and attenuation of seismic waves. The complex and frequency-dependent modulus is represented as

Elastic tensor Cijkl is obtained by introducing disturbance Cijkl1 to isotropic elastic background Cijkliso:

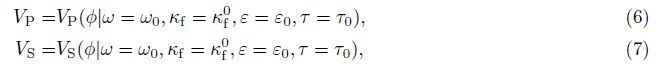

Then,for an arbitrary frequency ω,time scale τ,porosity φ,fracture density ",fluid bulk modulus κf,the anisotropic tensor for dispersion and attenuation can be represented by

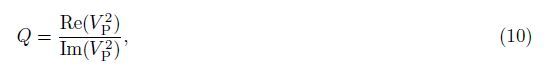
Figure 3 shows the calculated results based on the rock physics model where P wave velocities and attenuation factors vary with frequency for gas and water-saturated situations. Within the seismic b and width,dispersion of the P wave velocity results in the frequency-dependence of the reflection coefficients, and the frequency-dependent attenuation further complicates seismic reflections. In Fig. 3,the quality factor Q of P wave is given by

|
Fig.3 Predictions of the Chapman's multi-scale equant porosity model for water and gas saturated (a) P wave velocities; (b) P wave attenuation factors. |
According to the rock physics model,S wave shows no velocity dispersion and ignorable attenuation.
The properties used in the model include that P- and S wave velocities are 2790 m·s-1 and 1463 m·s-1,densities for gas- and water-saturated s and stone are 2080 kg·m-3 and 2060 kg·m-3. Other parameters associated with multi-scale factures include that crack density for micro-cracks is εc = 0,porosity φ = 0.1,fracture density εf = 0.05, and the velocity and density are 1710 m·s-1 and 1100 kg·m-3 for water, and 620 m·s-1 and 65 kg·m-3 for gas. Time scale parameter is τ = 4 × 10⁻⁶ s.
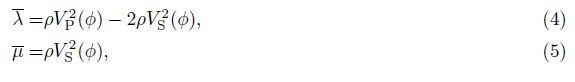
3.2 Viscoelastic Anisotropic Model for ShaleOn the basis of the St and ard linear solid model and Boltzmann theory, Carcione (1997) calculated VTI (Transverse isotropy with a vertical axis) anisotropic complex modulus p11,p33, p55, and p13,
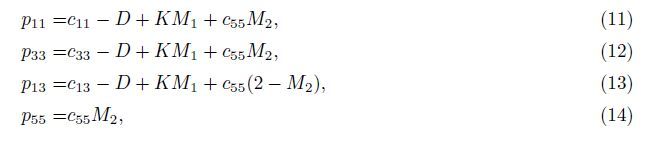

From Eq. (11) to (14) ,the complex Zener modulus is
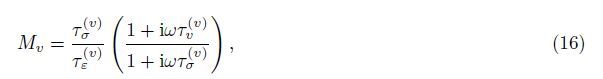
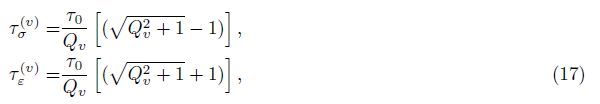
Figure 4 is the computed P- and S wave and corresponding attenuation factors that vary with the frequency. We can observe dispersion and attenuation within the seismic b and width which lead to the frequency-dependent reflection coefficients. The properties of shale used in the model include that vertical velocities are VP = 2743 m·s-1 and VS=1394 m·s-1,density is ρ = 2060 kg·m-3,anisotropy parameters are ε = 0.2,γ = 0.3,δ = -0.1, and P- and S wave quality factors are QP = 20 and QS = 10.

|
Fig.4 (a) P wave velocity of shale; (b) S wave velocity of shale; (c) Attenuation factors of P and S waves for shale |
Then,we calculate the frequency-dependent AVO responses from the inelastic thin bed and interbed in Fig. 2, and analyze the frequency-dependent features associated with layered structure,attenuation and dispersion.
4.1 Frequency-Dependent AVO Responses from Thin S and LayerFirst,we consider the thin s and model shown in Fig. 2a,where the dispersion and attenuation are displayed in Fig. 3. We compute and compare seismic AVO responses from elastic and inelastic s and stones, and from the s and stones with varied layer thickness and layered structure. According to the improved method in Fig. 1,we obtain the calculation results shown in Fig. 5.

|
Fig.5 Real parts of PP reflection coefficients (middle) , stacked amplitudes (left) , and AVO curves for 10 Hz and 40 Hz (right) (a) Shale-elastic sandstone interface; (b) Shale-anelastic sandstone interface; (c) Thin layer of anelastic sandstone. |
As shown in Fig. 5a,for thick and elastic s and stone layer,reflection model can be represented as a single interface, and the reflection coefficients represent no frequency-dependence that means reflection coefficients at all frequencies show the same trends (middle) . Accordingly,the amplitudes stacked from 0 to 60° do not vary with the frequency (left) . At the same time,AVO curves at 10 Hz and 40 Hz are overlapped (right) .
In Fig. 5b,if the thick s and stone represents dispersion and attenuation shown in Fig. 3 due to the presence of fluids saturated within pores and fractures,corresponding reflection coefficients vary with frequency (middle) . The stacked amplitudes 0 to 60° have high amplitudes at low frequency (left) . Meanwhile,AVO curves at 10 Hz and 40 Hz separate (right) .
In Fig. 5c,for a s and stone layer that has a thickness of 15 m and represents dispersion and attenuation shown in Fig. 3,the reflection coefficients illustrate complicated frequency-dependence (middle) . The stacked amplitudes 0 to 60° show a trend of increase followed by decrease with frequency (left) . Thus,for the thin layer,oil and gas reservoir do not necessarily show the abnormity of high amplitudes at low frequency. The variations in reflection amplitudes are also associated with the layered structures. These results in Fig. 5c may offer an interpretation for the observations of Liu et al. (2006) .According to the workflow in Fig. 1,the spectra of reflected waves can be calculated by multiplying the frequency-dependent reflection coefficients with the spectrum of wavelet, and the reflected waveforms can be further obtained by implementing inverse Fourier transformation to the reflection spectra. Fig. 6 illustrates the reflection spectra computed from Fig. 5 and Fig. 7 shows corresponding waveforms. Fig. 8 shows the Ricker wavelet that has a dominant frequency of 20 Hz. Comparing Fig. 6a and Fig. 6b, and Fig. 7a and Fig. 7b,we can observe that attenuation and dispersion lead to the decrease in reflection amplitudes, and alter corresponding AVO features. Meanwhile,Fig. 6c and Fig. 7c show the impact of thin layer structure on reflection amplitudes and AVO features,which are quite different from the model of the thick layer and single interface.

|
Fig.6 Spectra of PP waves corresponding to Fig. 5 |

|
Fig.7 Waveforms corresponding to Fig. 6 |

|
Fig.8 Ricker wavelet with a dominant frequency of 20 Hz (a) Waveform in time domain; (b) Spectrum in frequency domain. |
The interbedded model of s and stone and shale is shown in Fig. 2b. The overlying and underlying shale is elastic,while the interbedded layer is inelastic due to the saturation of oil and gas. The reservoir s and stone in the interbed is described by the multi-scale fracture model in Fig. 3, and the source shale represents viscoelasticity and anisotropy illustrated in Fig. 4. Total thickness of the interbed is 40 m where single s and stone layer has a thickness of 2 m and shale layer 3 m,corresponding to 40% s and content.
Figure 9a illustrates the frequency-dependent PP reflection coefficients of the inelastic interbed. Fig. 9b indicates the case for the high frequency elastic limit. For the Ricker wavelet of 40 Hz dominant frequency,the calculated reflection spectra are shown in Fig. 10a and 10b. By comparing Fig. 10a and 10b,we can observe that the inelasticity leads to the decrease in reflection amplitudes,especially at the high frequency. Corresponding to the spectra in Fig. 10,similar AVO features can also be observed in the reflected waveforms shown in Fig. 11.

|
Fig.9 Frequency-dependent AVO of PP wave (a) Anelastic; (b) Elastic. |

|
Fig.10 Spectra of PP wave (a) Anelastic; (b) Elastic. |

|
Fig.11 Waveforms of PP reflections (a) Anelastic; (b) Elastic. |
Accordingly,Fig. 12 shows the reflection coefficients of the mode-converted PS waves,Fig. 13 illustrates corresponding reflection spectra for the Ricker wavelet with a dominant frequency of 40 Hz, and Fig. 14 shows corresponding waveforms. The effects of the inelasticity on reflected amplitudes and AVO features can be observed in these Figures.

|
Fig.12 Frequency-dependent AVO of PS wave (a) Anelastic; (b) Elastic. |

|
Fig.13 Spectra of PS wave (a) Anelastic; (b) Elastic. |

|
Fig.14 Waveforms of PS reflections (a) Anelastic; (b) Elastic. |
We have investigated the frequency-dependent AVO responses,considering both the effect of frequency and attenuation associated with lithology, and interbed related to stratified structure.
The method realized a seamless link between the rock physics modeling and the calculation for reflection coefficients. We use the features of the propagator matrix method that implements calculations in frequency domain and copes with frequency variables,which makes it possible to treat the predicted frequency-dependent complex modulus by the rock physics model directly as the inputs for the calculation of reflection coefficients. While conventional methods usually only consider real parts of the complex modulus and neglect the imaginary parts that are also associated with dispersion and attenuation. Another advantage of the improved method is to consider distinct mechanism of dispersion and attenuation because anelasticity of rocks predicted by different models are all described by the frequency-dependent complex stiffnesses.
Results of numerical stimulations indicate that both inelasticity and layered structure contribute to the frequency-dependence of seismic AVO. In the presence of thin layer,fluid-saturated reservoir does not present low-frequency anomalies. The amplitudes of reflections may increase and then decrease with frequency. For the interbed model,dispersion and attenuation also lead to obvious variations in the frequency-dependent reflection coefficients,spectra, and AVO features for both PP and PS wave. Finally,we have improved the algorithm for the calculation of frequency-dependent AVO responses which may help for the modeling and analysis of seismic reflections in the presence of dispersion,attenuation and layered structure.
6 ACKNOWLEDGMENTSThis work was supported by the National Natural Science Foundation of China (41404090,41430322 and U1262208) .
| [1] | Carcione J M. 1997. Reflection and transmission of qP-qS plane waves at a plane boundary between viscoelastic transversely isotropic media. Geophys. J. Int., 129(3): 669-680. |
| [2] | Carcione J M. 2001. AVO effects of a hydrocarbon source-rock layer. Geophysics, 66(2): 419-427. |
| [3] | Carcione J M, Helle H B, Pham N H. 2003. White's model for wave propagation in partially saturated rocks. Comparison with poroelastic numerical experiments. Geophysics, 68(4): 1389-1398. |
| [4] | Carcione J M, Picotti S. 2006. P-wave seismic attenuation by slow-wave diffusion: Effects of inhomogeneous rock properties. Geophysics, 71(3): O1-O8. |
| [5] | Chapman M. 2003. Frequency-dependent anisotropy due to meso-scale fractures in the presence of equant porosity. Geophys. Prospect., 51(5): 369-379. |
| [6] | Chapman M, Liu E R. 2005. The effect of abnormally high reservoir attenuation on AVO analysis.//75th Ann. Internat Mtg., Soc. Exp. Geophys. Expanded Abstracts, 277-280. |
| [7] | Chapman M, Liu E R, Li X Y. 2005. The influence of abnormally high reservoir attenuation on the AVO signature. The Leading Edge, 24(11): 1120-1125. |
| [8] | Chapman M, Liu E R, Li X Y. 2006. The influence of fluid-sensitive dispersion and attenuation on AVO analysis. Geophys. J. Int., 167(1): 89-105. |
| [9] | Chapman M, Maultzsch S, Liu E R, et al. 2003. The effect of fluid saturation in an anisotropic multi-scale equant porosity model. J. Appl. Geophys., 54(3-4): 191-202. |
| [10] | Chen X H, Tian L X, Huang R. 2009. Research progressing on frequency dependent AVO analysis. Marine Origin Petroleum Geology (in Chinese), 14(4): 60-66. |
| [11] | Cheng B J, Xu T J, Li S G. 2012. Research and application of frequency dependent AVO analysis for gas recognition. Chinese J. Geophys. (in Chinese), 55(2): 608-613, doi: 10.6038/j.issn.0001-5733.2012.02.023. |
| [12] | Gao J H, Chen W C, Li Y M, et al. 2003. Generalized S transform and seismic response analysis of thin interbeds. Chinese J. Geophys. (in Chinese), 46(4): 526-532. |
| [13] | Gao J H, Wan T, Chen W C, et al. 2006. Three parameter wavelet and its applications to seismic data processing. Chinese J. Geophys. (in Chinese), 49(6): 1802-1812. |
| [14] | Guo Z Q. 2008. Wave field modeling in viscoelastic anisotropic media and reservoir information study [Ph. D. thesis] (in Chinese). Changchun. Jilin University. |
| [15] | Guo Z Q, Li X Y, Liu C. 2014. An AVO inversion method in the frequency domain based on a layered model-A Bakken Shale case study. J. Geophys. Eng., 11(2): 025001. |
| [16] | Guo Z Q, Liu C, Feng X, et al. 2009. Reflection characteristics of thin reservoirs and its AVO attributes analysis. Geophys. Prospect. Petro. (in Chinese), 48(5): 453-458. |
| [17] | Johnson D L. 2001. Theory of frequency dependent acoustics in patchy-saturated porous media. J. Acoust. Soc. Am., 110: 682-694. |
| [18] | Kennett B L. 1983. Seismic Wave Propagation in Stratified Media. Cambridge, U. K.: Cambridge Univ. Press. |
| [19] | Li X Y, Chen S M, Wang J M, et al. 2012. Forward modeling studies on the time-frequency characteristics of thin layers. Chinese J. Geophys. (in Chinese), 55(10): 3410-3419, doi: 10.6038/j.issn.0001-5733.2012.10.024. |
| [20] | Li X Y, Wen H J, Chen S M, et al. 2013. Forward modeling studies on the time-frequency characteristics of isopachous thin interbedding. Chinese J. Geophys. (in Chinese), 56(3): 1033-1042, doi: 10.6038/cjg20130331. |
| [21] | Liu E R, Chapman M, Loizou N, et al. 2006. Applications of spectral decomposition for AVO analyses in the west of Shetland.//76th Ann. Internat Mtg., Soc. Exp. Geophys. Expanded Abstracts, 279-283. |
| [22] | Liu F. 2011. Application of frequency division AVO analysis in the exploration of gas hydrate [Master thesis] (in Chinese). Beijing: Chinese Academy of Sciences. |
| [23] | Liu X, Xu D, Wang Y. 2011. Frequency-dependent P-wave reflection coefficients for a double porosity reservoir.//73rd EAGE Conference & Exhibition, Extended Abstracts, P002. |
| [24] | Liu Y B, Schmitt D R. 2003. Amplitude and AVO responses of a single thin bed. Geophysics, 68(4): 1161-1168. |
| [25] | Lu S Q. 2013. Application of prestack frequency-division AVO analysis method in Luojia area. Geophys. Prospect. Petro. (in Chinese), 52(2): 151-156. |
| [26] | Quintal B, Schmalholz S M, Podladchikov Y Y, et al. 2007. Seismic low-frequency anomalies in multiple reflections from thinly layered poroelastic reservoirs.//77th Ann. Internat Mtg., Soc. Exp. Geophys. Expanded Abstracts, 1690-1695. |
| [27] | Quintal B. 2012. Frequency-dependent attenuation as a potential indicator of oil saturation. J. Appl. Geophys., 82: 119-128. |
| [28] | Ren H T, Goloshubin G, Hilterman F J. 2009a. Poroelastic analysis of amplitude-versus-frequency variations. Geophysics, 74(6): N41-N48. |
| [29] | Ren H T, Goloshubin G, Hilterman F J. 2009b. Poroelastic analysis of permeability effects in thinly layered porous media. Geophysics, 74(6): N49-N54. |
| [30] | Rokhlin S I, Wang Y J. 1992. Equivalent boundary conditions for thin orthotropic layer between two solids: Reflection, refraction, and interface waves. J. Acoust. Soc. Am., 91(4): 1875-1887. |
| [31] | Teng L, Yang X C, Cheng J B, et al. 2013. The frequency-angle-depended reflection of P wave in fluid-saturated porous rock.//83rd Ann. Internat Mtg., Soc. Exp. Geophys. Expanded Abstracts, 467-472. |
| [32] | Ursin B, Stovas A. 2002. Reflection and transmission responses of a layered isotropic viscoelastic medium. Geophysics, 67(1): 307-323. |
| [33] | White J E. 1975. Computed seismic speeds and attenuation in rocks with partial gas saturation. Geophysics, 40: 224-232. |
| [34] | Xuan Y H, Qin C G, Wang R L, et al. 2010. Application of frequency division AVO technique in gas bearing analysis in Fanyu natural gas area, Pearl River Mouth Basin. Oil Geophysical Prospecting (in Chinese), 45(1): 79-84. |
| [35] | Zhao H X, Gao J H, Liu F Q. 2014. Frequency-dependent reflection coefficients in diffusive-viscous media. Geophysics, 79(3): T143-T155. |