2. Chinese Academy of Geological Sciences, Beijing 100037, China;
3. Key Laboratory of Computational Geodynamics, Chinese Academy of Sciences, Beijng, 100049, China
The basic tenet of plate tectonics,i.e.,rigid-body movements of large plate of lithosphere,fails to apply to continental interiors[1]. The rheology of the continental lithosphere,with a relatively weak layer,has significant difference comparing with the oceanic lithosphere[1, 2]. Since 1970s many researchers have done a lot of research on the rheology of the lithosphere,especially to the strength of the lithosphere[3, 4, 5, 6, 7]. Based on the rheological structure,many researchers analyzed the mechanical behavior of the lithosphere. For instance,Chen and Molar discussed the relationship between the strength and focal depth in the Tibetan plateau,which indicates an aseismic lower crust with a relatively low plastic strength[8]. Royden et al. presented that the low-viscosity plays an important role in understanding of the orogenic belts[9]. Meissner and Mooney proposed that the weak lower continental crust provided a condition for delamination,uplift and escape[10]. All these results indicate that it is necessary to investigate the rheological structure for understanding the deformation process of the continental lithosphere.
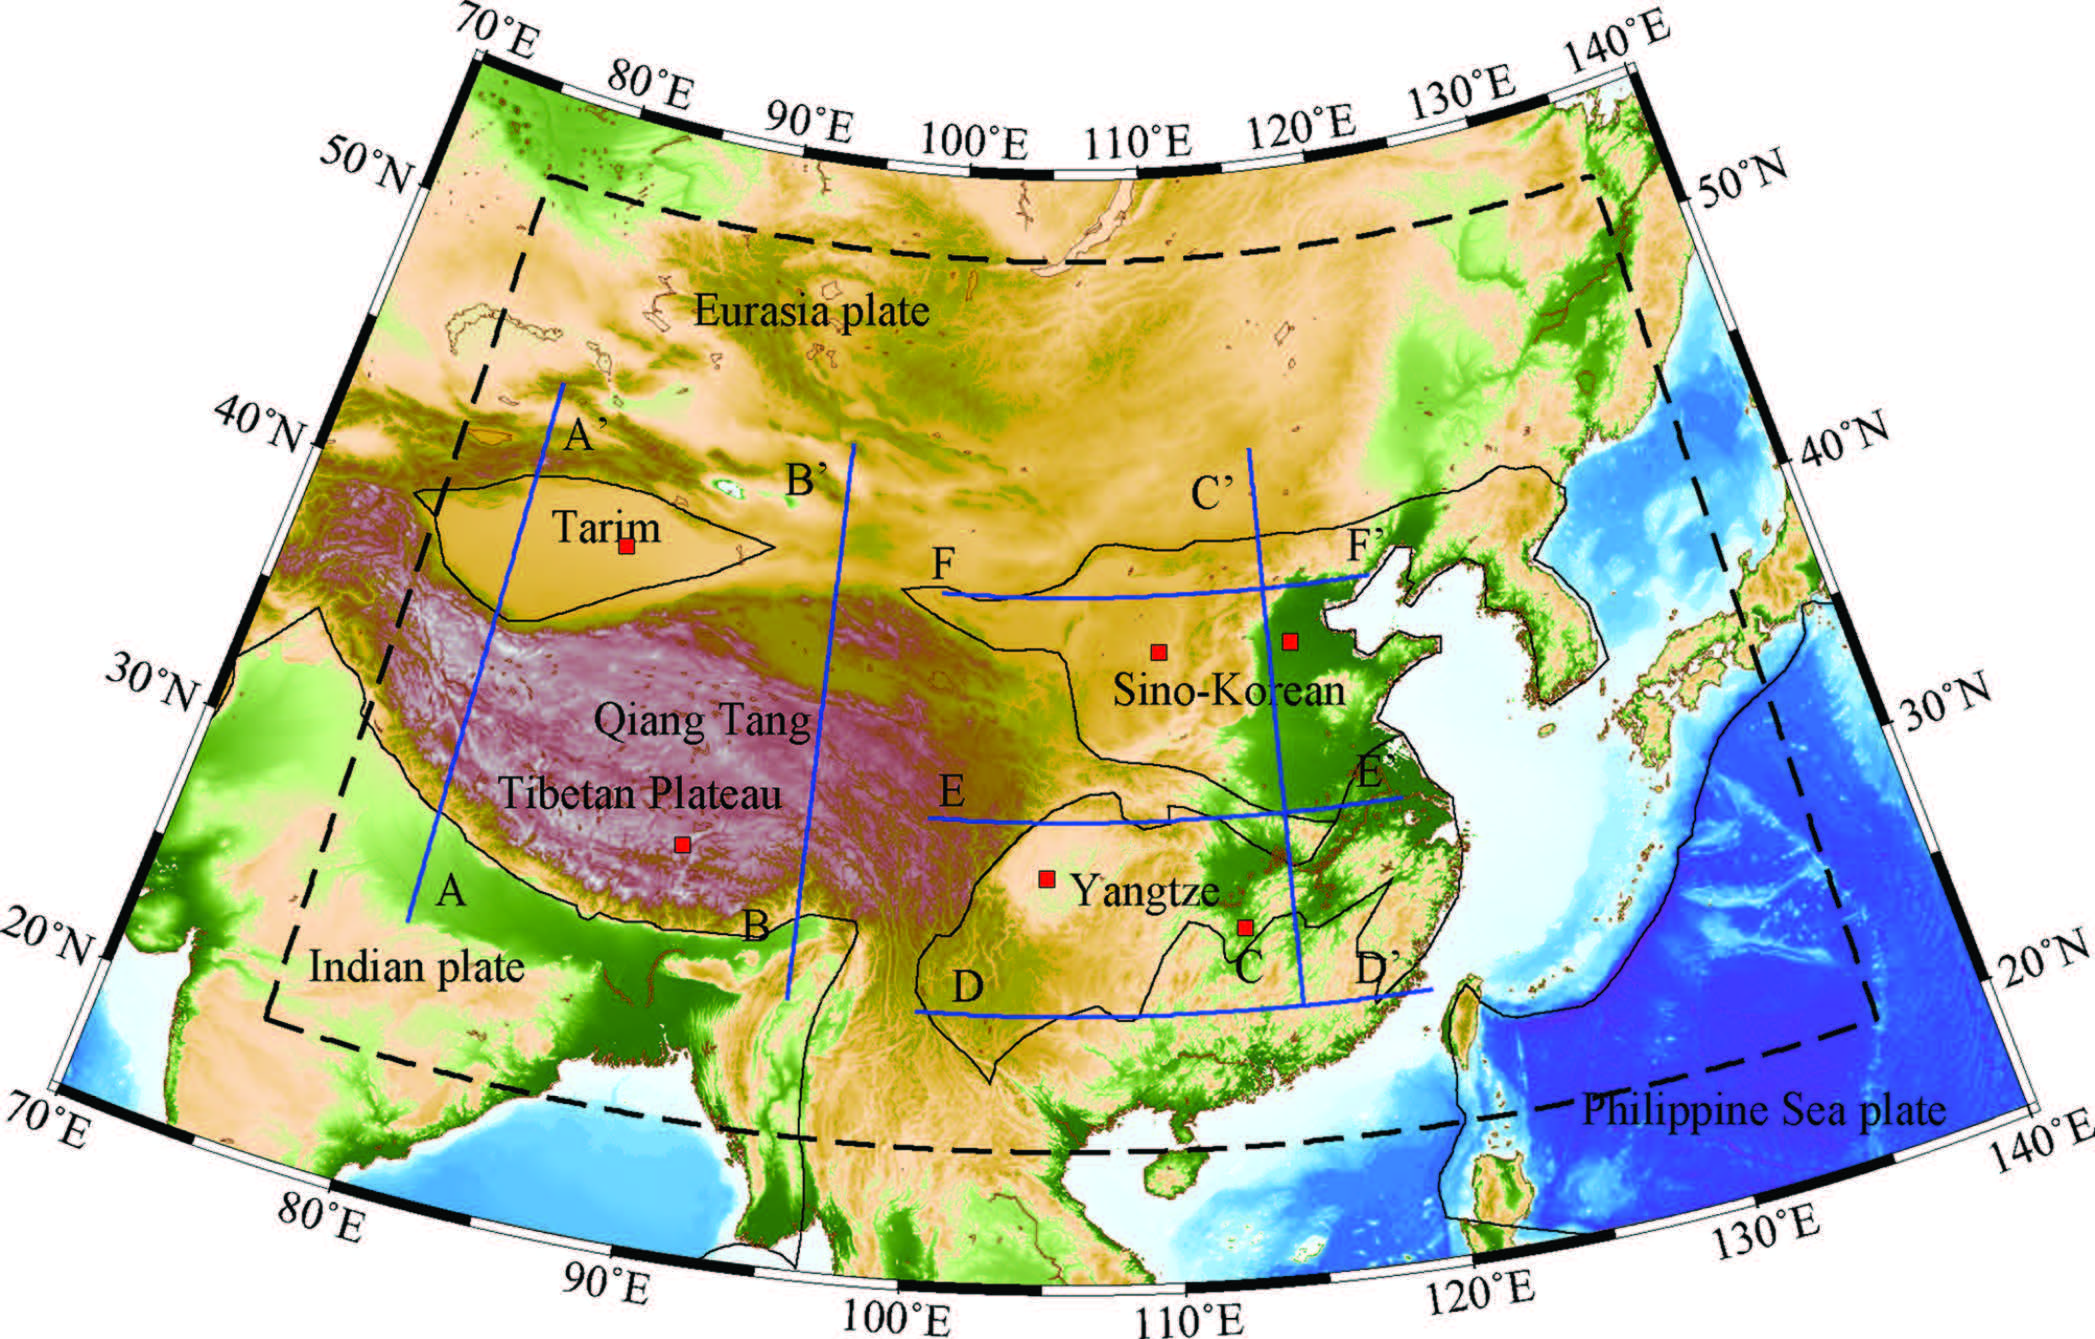
The Chinese continent and its adjacent regions are located in the southeast of Eurasia plate. North of them is the Siberian block. And the other three sides are the Pacific Ocean plate,Philippine Sea plate and Indian plate,respectively. The blocks formed in the Precambrian are mainly the China-Korea,Yangtze and Tarim cratons[11]. Many typical characteristics of continental lithosphere are formed in this region,such as Tibetan plateau (Fig.1). A large amount of work has been done on the rheological structure of the lithosphere in Chinese continent or some blocks of it[9, 12, 13, 14, 15]. However,most of the work on the rheological structure is based on the 1D or 2D model or limited to a small scale. It is hard to study the interaction among different blocks using these models. Thus,3D rheological structure is needed to study the 3D deformation of continental lithosphere.
|
Fig.1 Tectonics features in Chinese continent and adjacent regions The black dashed line shows the research region in this paper. The profiles labeled as AA0,BB0,CC0,DD0,EE0 and FF0 are shown in Fig.4 and Fig.7. The red squares indicate the sites location for Fig.2,Fig.5 and Fig.8. |
In this study,we collect much more data to construct a 3D rheological structure of the Chinese continent and its adjacent region. With the newly available thermal parameters and seismic-thermal constraints,we calculate the 3D thermal structure of continental lithosphere beneath China[16]. Based on the thermal structure and strain rates derived from GPS observation and the stratigraphic composition,we calculate the rheological structure of the continental lithosphere. This 3D rheological structure of the lithosphere provides a useful reference to explain some geodynamic processes.
2 LITHOSPHERIC STRENGTHStrength and viscosity are the basic parameters for lithospheric rheology. Generally,the strength of the lithosphere is limited by three deformation mechanisms: frictional strength,fracture strength and creep strength (plastic strength)[2].
2.1 Frictional StrengthBased on a lot of experimental data,Byerlee concluded that shear stress and normal stress σn are closely approximated by the linear law during frictional sliding. Now,this rule has been called Byerlee’s law[17]:


If the rocks under consideration are not pervasively jointed or if the length scale between the joints is large,then the strength of the rock mass may be limited by the compressive fracture strength[2]. This fracture mechanism is based on experimental evidence at high confining pressure and temperature. If the temperature is less than 800°C,it can be estimated as a function of depth (or pressure),temperature and sample scale[14, 19, 20, 21]

| Table 1 Brittle fracture parameters for some representative rocks (large-scale rock samples) in the lithosphere[14, 19, 20] |
When the temperature is sufficiently high,creep is the dominant deformation mechanism. The creep strength is a strong function of temperature,strain rate and rock properties. It is commonly described by a power law relation between strain rate and differential stress[4, 6, 22]:


At a certain temperature and pressure,one of these three deformation mechanisms would become the dominant one. By calculating each of them,we will select the smallest value as the strength of the lithosphere:


Temperature is an important impact factor on the rheological strength. At present,in Chinese continent,a lot of research on temperature has been carried out by solving the 1D or 2D static heat conduction equation based on the surface heat flow[13, 23, 24, 25, 26, 27]. However,the 1D or 2D model neglects the temperature effect of lateral heat conduction and can not consider the lateral heterogeneity of thermal parameters. Furthermore,when the temperature is extrapolated according to the surface heat flow,the error increases gradually with increasing depth because there is seldom thermal constraint in deep lithosphere.
In this study,based on the Crust2.0 and topography data,a 3D finite element model was constructed beneath Chinese continental lithosphere in the spherical coordinate system. The upper mantle temperature derived from seismic velocity provides a new thermal constraint for the lithosphere[28, 29]. An and Shi calculated the temperature of upper mantle beneath Chinese continent and its adjacent regions based on this method[30, 31]. In this model,we select the temperature at 100 km depth from their result as the bottom boundary conditions. And the average annual temperature from 195 meteorological stations is given as the constraint of surface boundary. Considering the lateral heterogeneity of thermal parameters,we calculate the 3D thermal structure of the continental lithosphere beneath China and adjacent regions with 3D static heat conductive equation. The results were compared with the surface heat flow observations. They indicated that the fitting error is less than 20% for 89% of the total data[16]. The uncertainty of the measured surface heat flow is less than 20% after correlation[32]. This thermal structure is used to calculate the rheological structure in this study.
3.2 Strain RateConstant strain rate was always used to calculate the creep strength in the early times[2, 6, 33]. Recently,with the development of geodesy,many GPS observational data in China were collected[34, 35, 36]. Strain rate computed by GPS data provides a good constraint for creep strength[37, 38]. As the first order approximation,we assume that the lithospheric blocks move coherently and they have the same strain rate in the vertically direction. Zhu and Shi derived the strain rate from GPS observation in Chinese continent and neighboring regions[35, 36]. In this model,we adopt this result as the constraints in calculating creep strength.
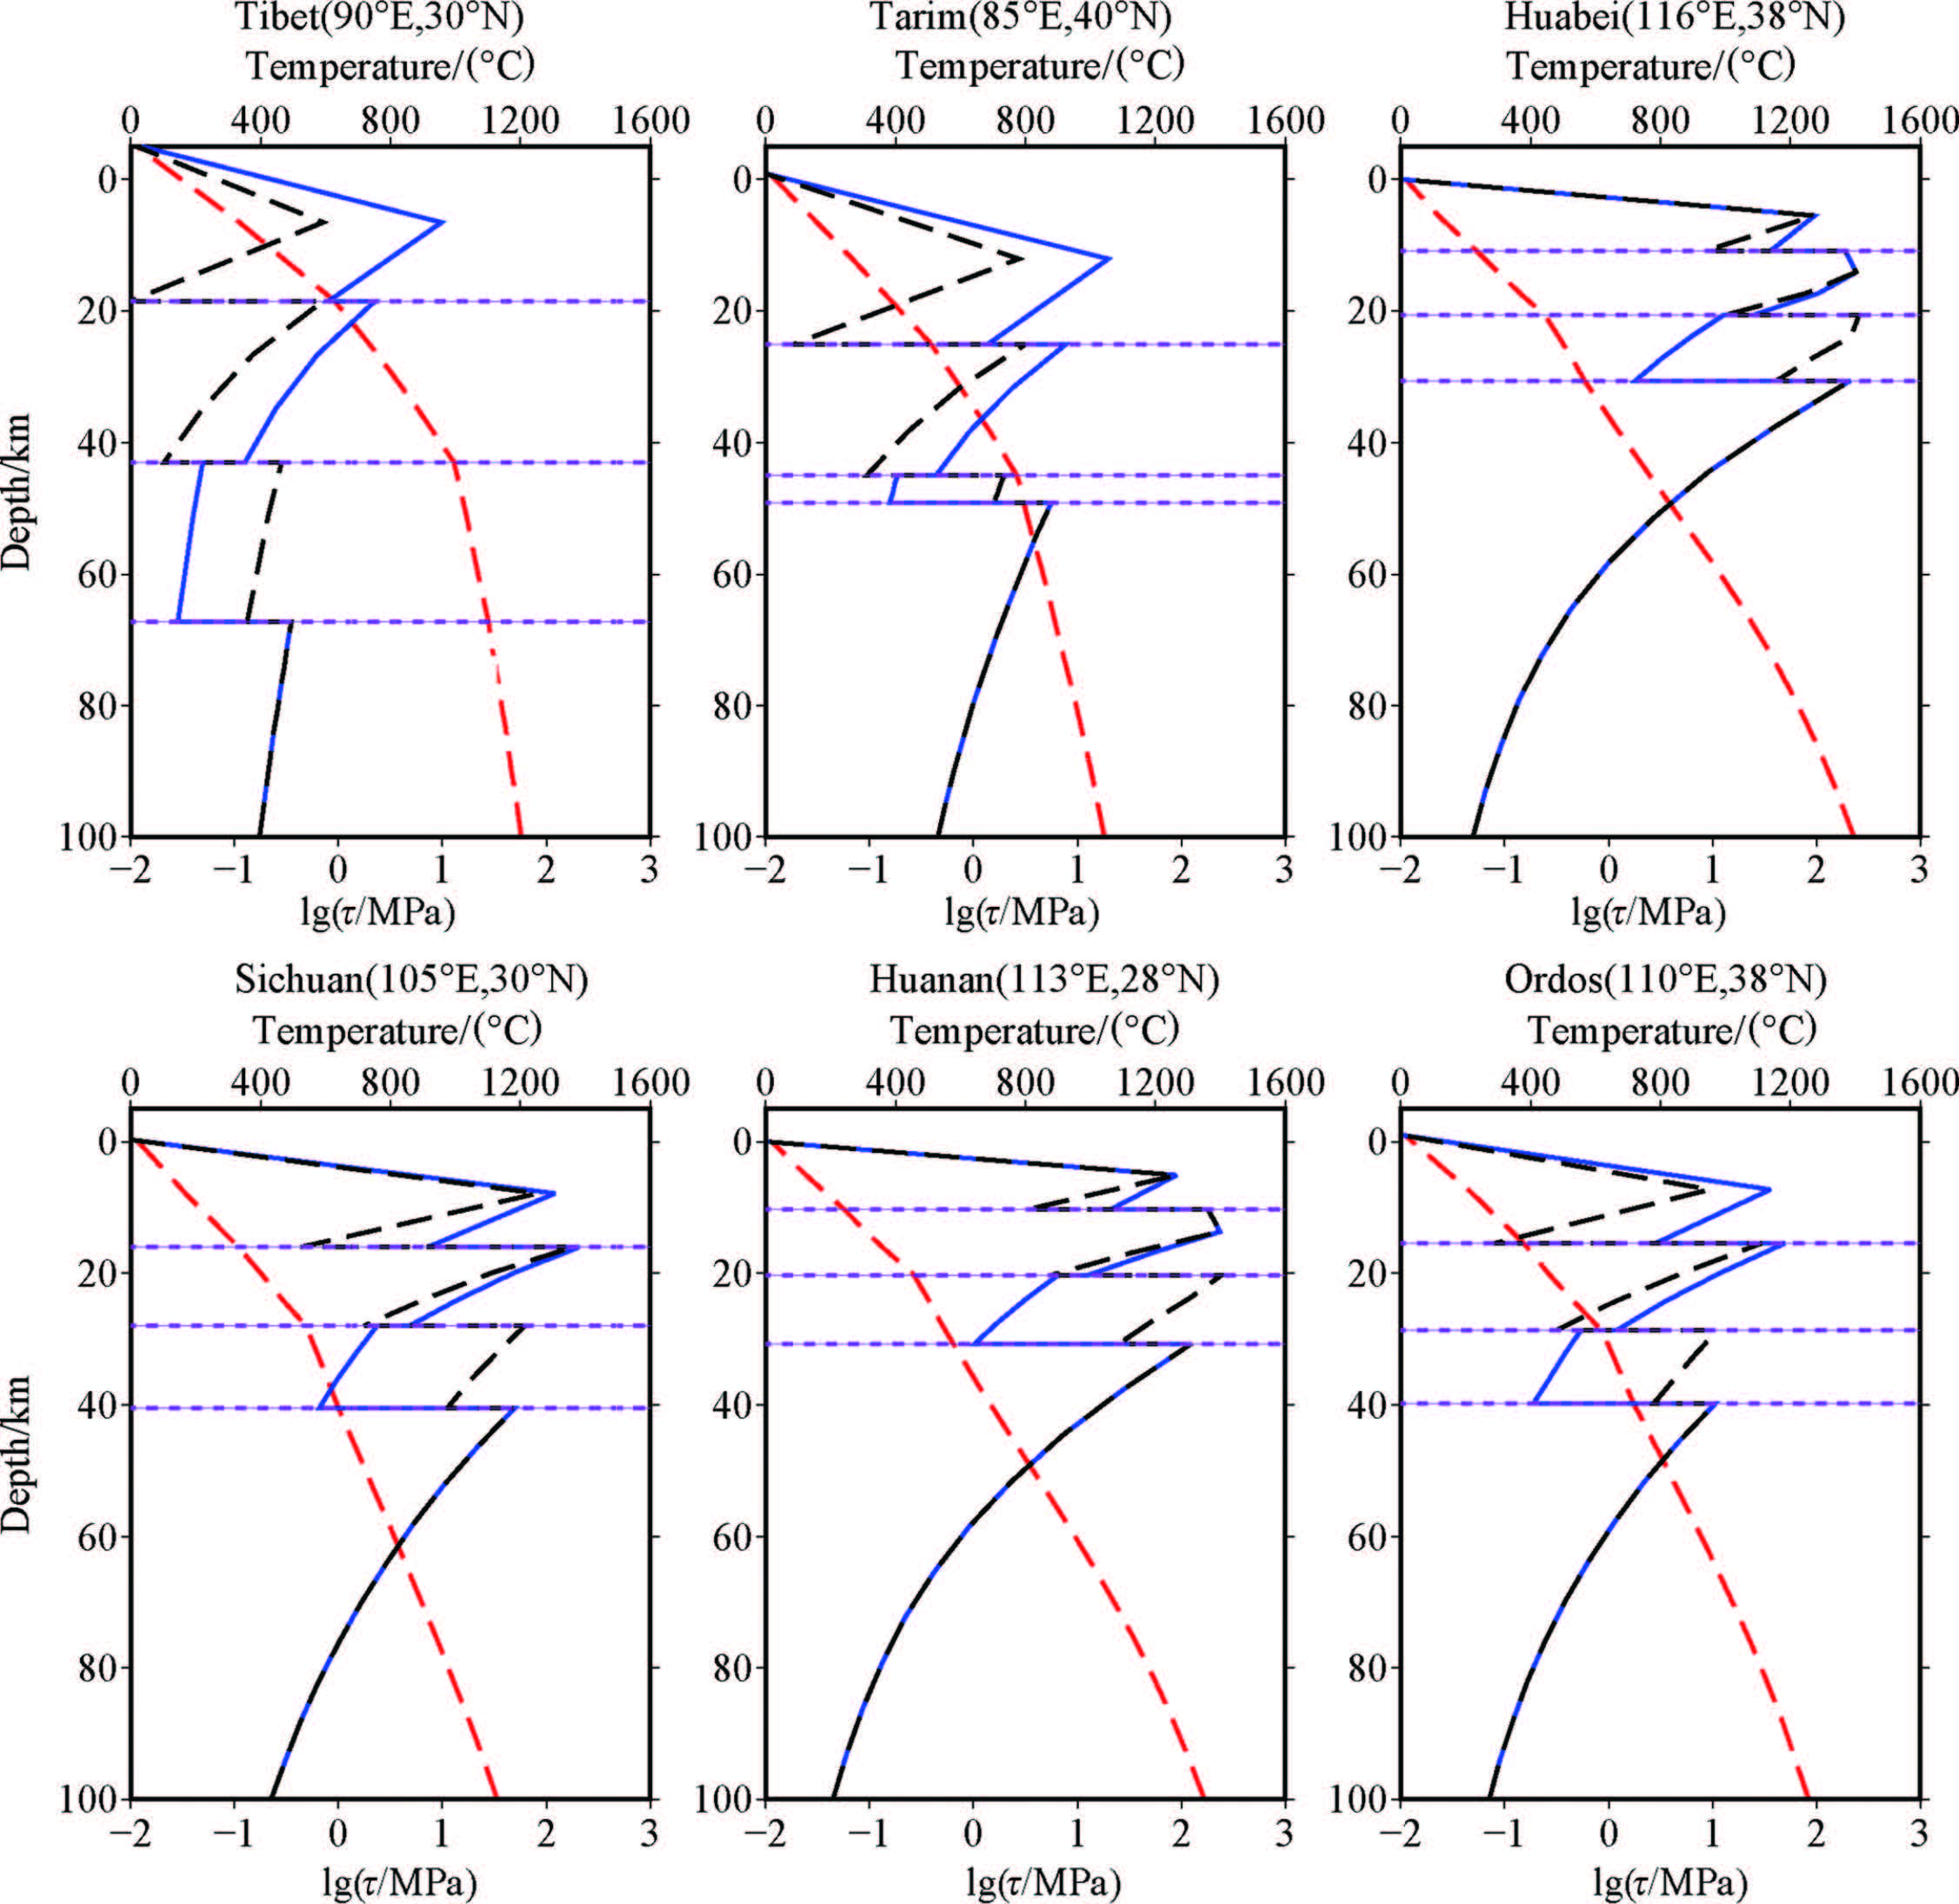
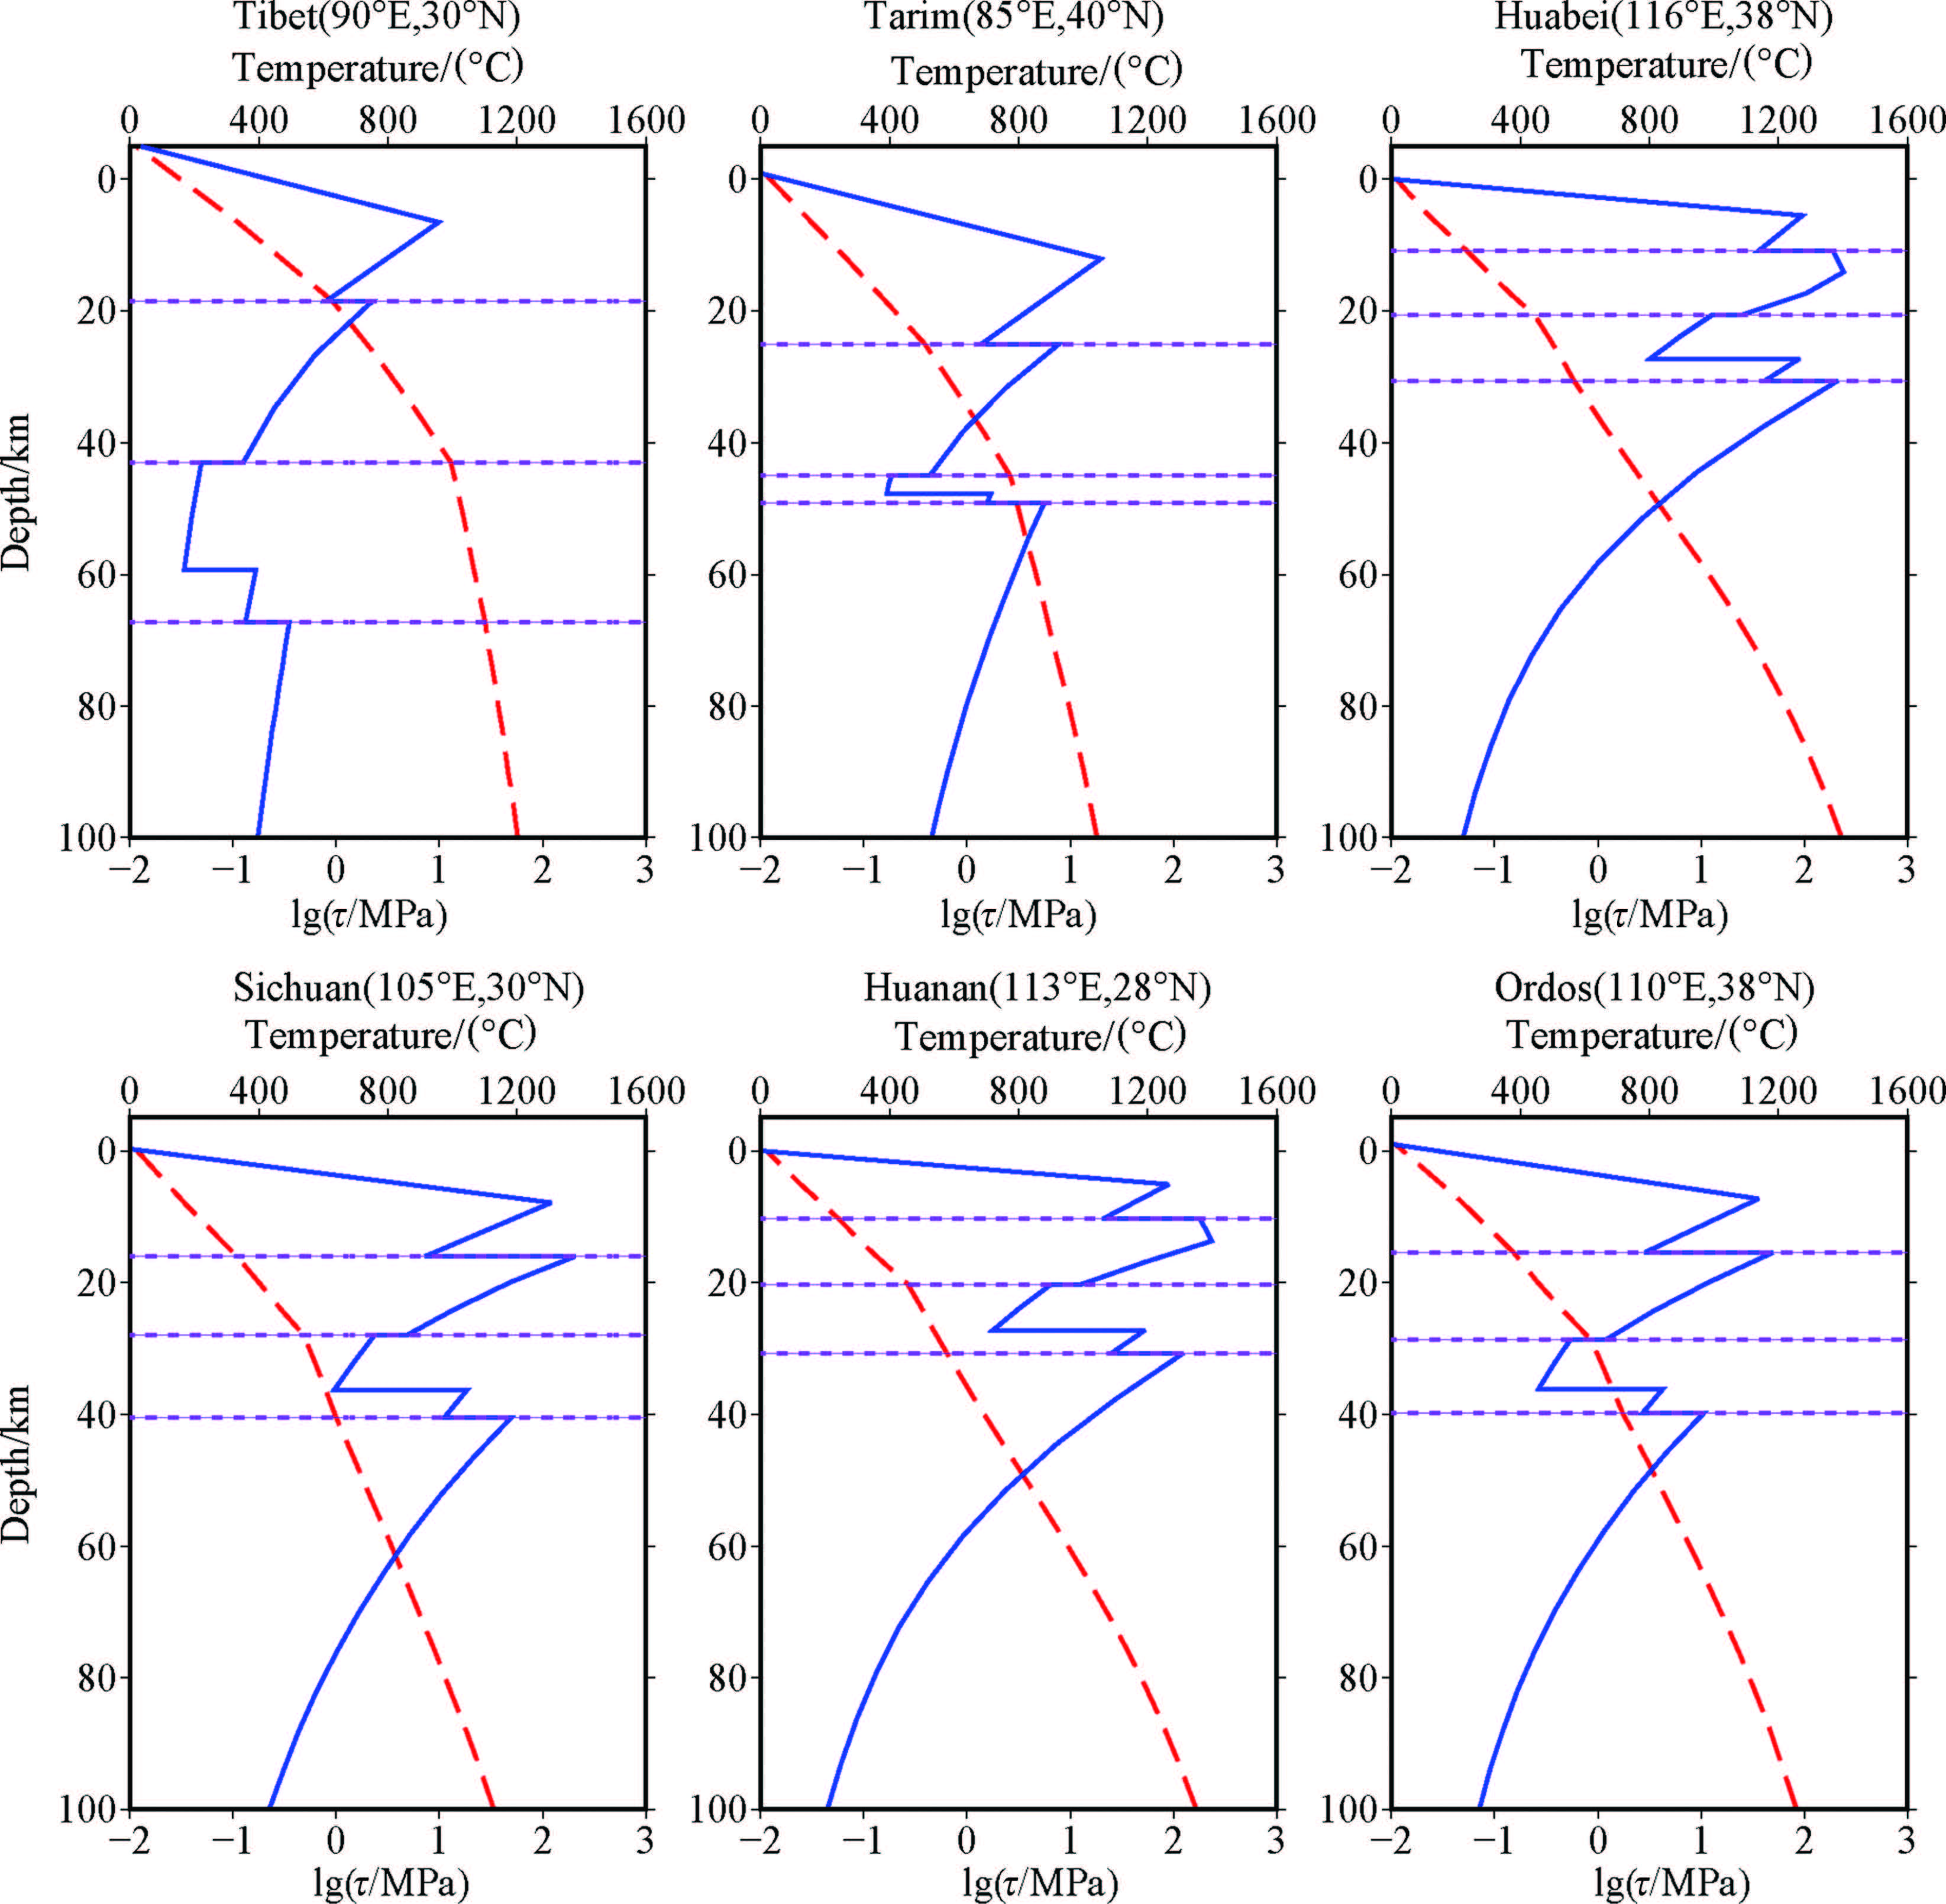
3.3 Creep ParametersIn this paper,we determine the vertical variations of rheological properties on the basis of the deformation laws of lithospheric materials[6]. Rheological stratification is very important in constructing the lithospheric rheological structure. Selecting different rheological parameters would have a great impact on the rheological structure. Therefore,in this study,we select the representative rheological parameters for each layer based on the summary of high temperature and high pressure test. A special note is that the rocks selected in our models are representative of rheological parameters,while it may not be the rock types of each layer. Using average P wave velocities derived from the crustal type sections,the estimated areal extent of each type of crust,and the average compositions of different types of granulites,Rudnick and Fountain estimated the average lower and middle crust composition[39]. The middle crust is composed of rocks in the amphibolite facies and is intermediate in composition and contains a significant proportion of the bulk silicate Earth’s incompatible trace element budget (35%~55% of Rb,Ba,K,Pb,Th,and U). The lower crust is composed of rocks in the granulite facies and is lithologically heterogeneous. Its average composition is mafic,approaching that of a primitive mantle derived basalt,but it may range to intermediate bulk composition in some regions. Christensen and Mooney summarized the structure of the continental crust based on the results of seismic refraction profiles and inferred crustal composition[40]. Their results show that velocities in the upper continental crust are matched by velocities of a large number of lithologies,including many low-grade metamorphic rocks and relatively silicic gneisses of amphibolite facies grade. In midcrustal regions,velocity gradients appear to originate from an increase in metamorphic grade,as well as a decrease in silica content. Tonalitic gneiss,granitic gneiss,and amphibolite are abundant midcrustal lithologies. The bulk of the lower continental crust is chemically equivalent to gabbro,with velocities in agreement with laboratory measurements of mafic granulite. Based on 18 seismic refraction profiles including 12 geoscience transects,the middle,lower and total crust compositions of East China are estimated by Gao et al.[41]. All the tectonic units except the Tarim craton and Qingling orogen show a four-layered crustal structure,consisting of the upper,middle,upper lower and lowermost crust. The upper crust mainly consists of granite and lower-grade metamorphic rocks. The middle crust is composed of felsic amphibolite-facies gneisses. The main composition of upper lower and lowermost crust are intermediate and mafic granulite,respectively. The bulk lower crust in East China is intermediate (more felsic compostiton)[41, 42]. This is contrast with generally accepted global models which shows mafic garnet granulite lower crust[39, 40]. According to these results,we select many rocks whose rheological properties can represent the composition of each layer (Fig.2). To test the effect of crust composition on the lithospheric rheology,we select two rock types for each layer (Fig.2). The lithospheric strengths of six sites are from different regions in China. For the upper crust,the lithospheric strength calculated with the granite is slightly higher than that with wet granite. For middle crust,the lithospheric strength calculated with the anorthosite is higher than that with quartz diorite. For the lower crust,the lithospheric strength calculated with the mafic granulites is higher obviously than that with felsic granulites. Thus,with the crust composition,the lithology choice in the upper crust and middle crust has little effect on the lithospheric rheology. However,the effect of lithology on the lithospheric strength is large for the lower crust (Fig.2). In the following results,the model is divided by five layers for the crust composition according to Gao’s results. The lower crust is characterized by a two-layer composition and the ratio of the thickness between upper lower and lowermost crust is 2:1. The rheological parameters of material for the upper crust,middle crust,upper lower crust,lowermost crust and lithospheric mantle are chosen by granite,anorthosite,felsic granulite,mafic granulite and wet olivine,respectively.
|
Fig.2 The effect of creep parameters on the lithospheric strength The blue lines show the lithospheric strength adopting granite,anorthosite,felsic granulite and peridotite in the upper crust,middle crust,lower crust and lithospheric mantle,respectively. The black dashed lines show the lithospheric strength adopting wet granite,quartz diorite,mafic granulites and peridotite in the upper crust,middle crust,lower crust and lithospheric mantle,respectively. The red dashed line represents temperature. Three pink dot lines in each figure show the bottom of upper crust,middle crust and lower crust,respectively (from Crust2.0). |
| Table 2 Rheological parameters used in the model for each layer in the lithosphere |
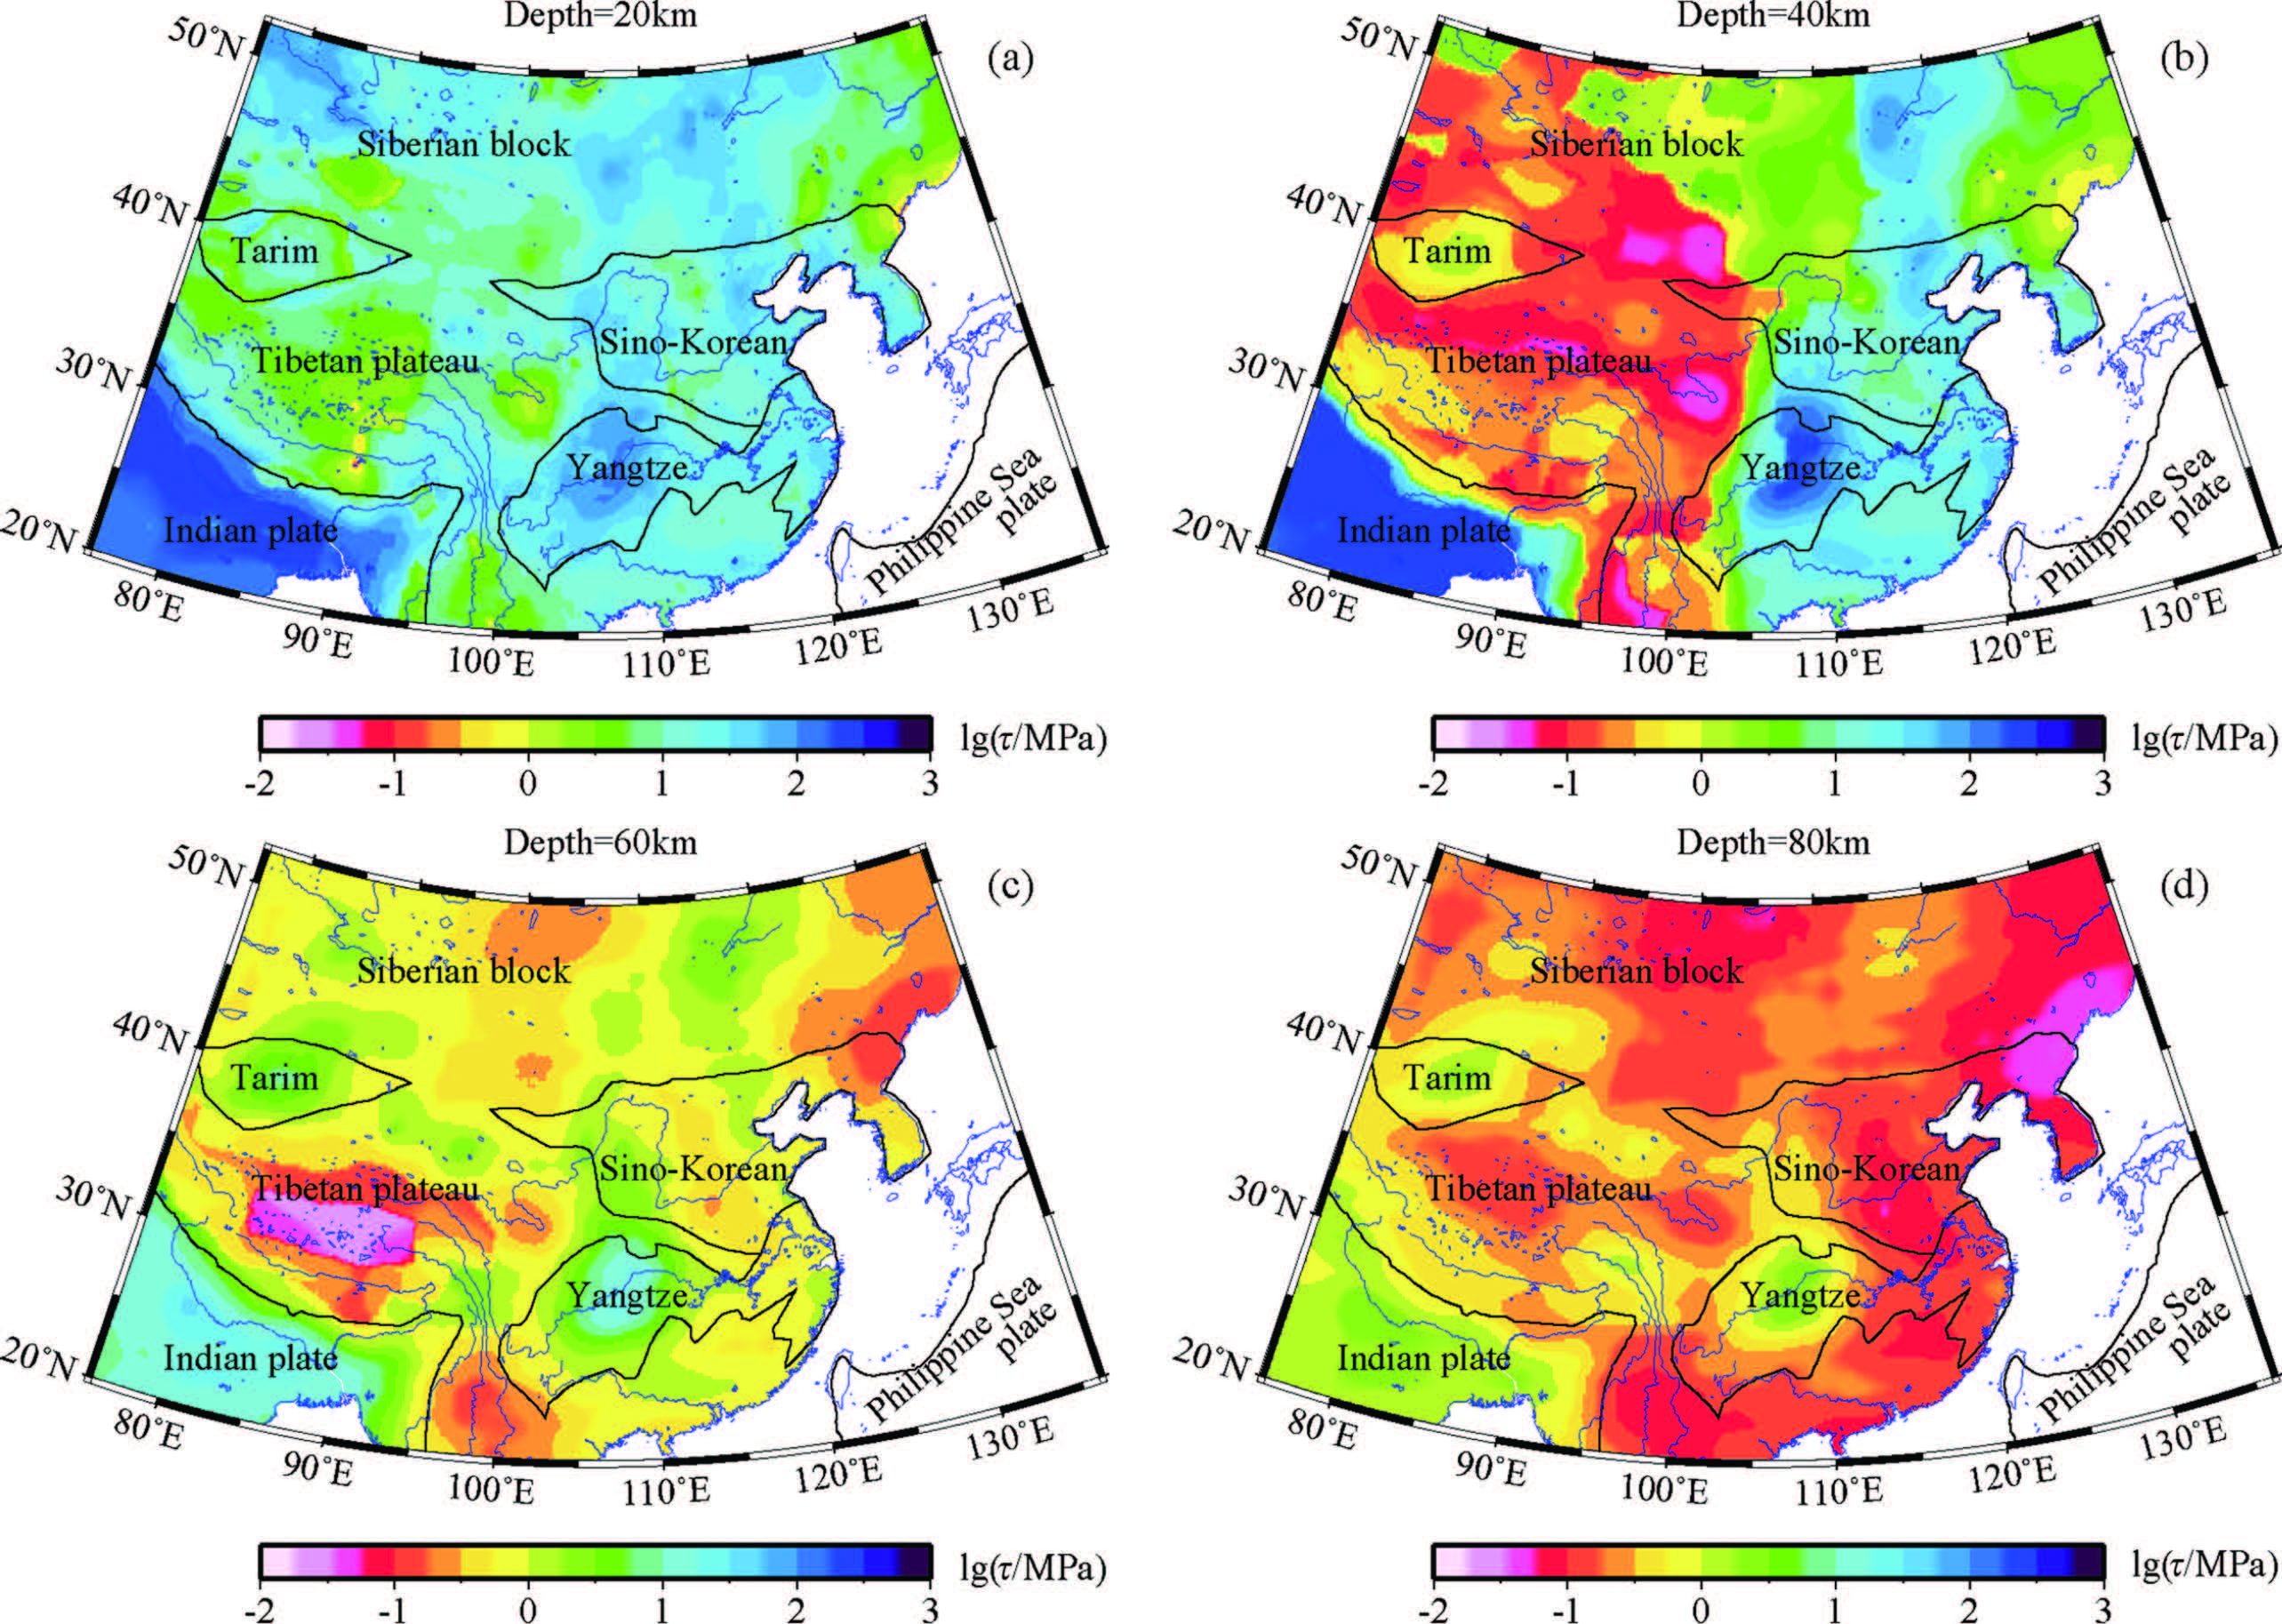
Based on the thermal structure,strain rate derived from GPS and lithospheric composition,the lithospheric strength is calculated with Eq.(6). The lateral heterogeneity of lithospheric strength is obviously (Fig.3). In the shallow lithosphere (less than 60 km),the strength of western part of Chinese continent is smaller than that of eastern part of Chinese continent and Indian plate. Generally,the strength is small than 10MPa. However,the strength in eastern part of Chinese continent and Indian plate is larger than 10 MPa. The transition zones,which are very obvious at around 40 km,are consistent with the plate boundary and terrain ladder. This is also denoted by the tomography. The high and low velocity is corresponding to the high and low strength,respectively[46]. Especially,the transition zones between eastern and western part of Chinese continent are consistent with the North-South seismic belt (Fig.3b). This may be caused by stress concentration along the transition zones,which is determined by the mutations of the lithospheric strength. In the deep lithosphere,the strength of some blocks is larger than 1 MPa,such as Tarim,Sichuan basin and Indian plate. The strength of their surrounding areas is less than this value. There are very weak layers (the strength is less than 0.1 MPa) beneath the Tibetan Plateau,Baikal Lake,northeastern China,eastern North China and Yunnan province. Extensional environment beneath Baikal Lake would cause upwelling of mantle material,which would decrease the strength because of high temperature. The dehydration melting of subduction zones beneath the Tibetan plateau,northeastern China,eastern North China and Yunnan province is consistent with the distribution of volcano,which is also lower strength[47, 48].
|
Fig.3 Lithospheric strength obtained in this study at different depths |
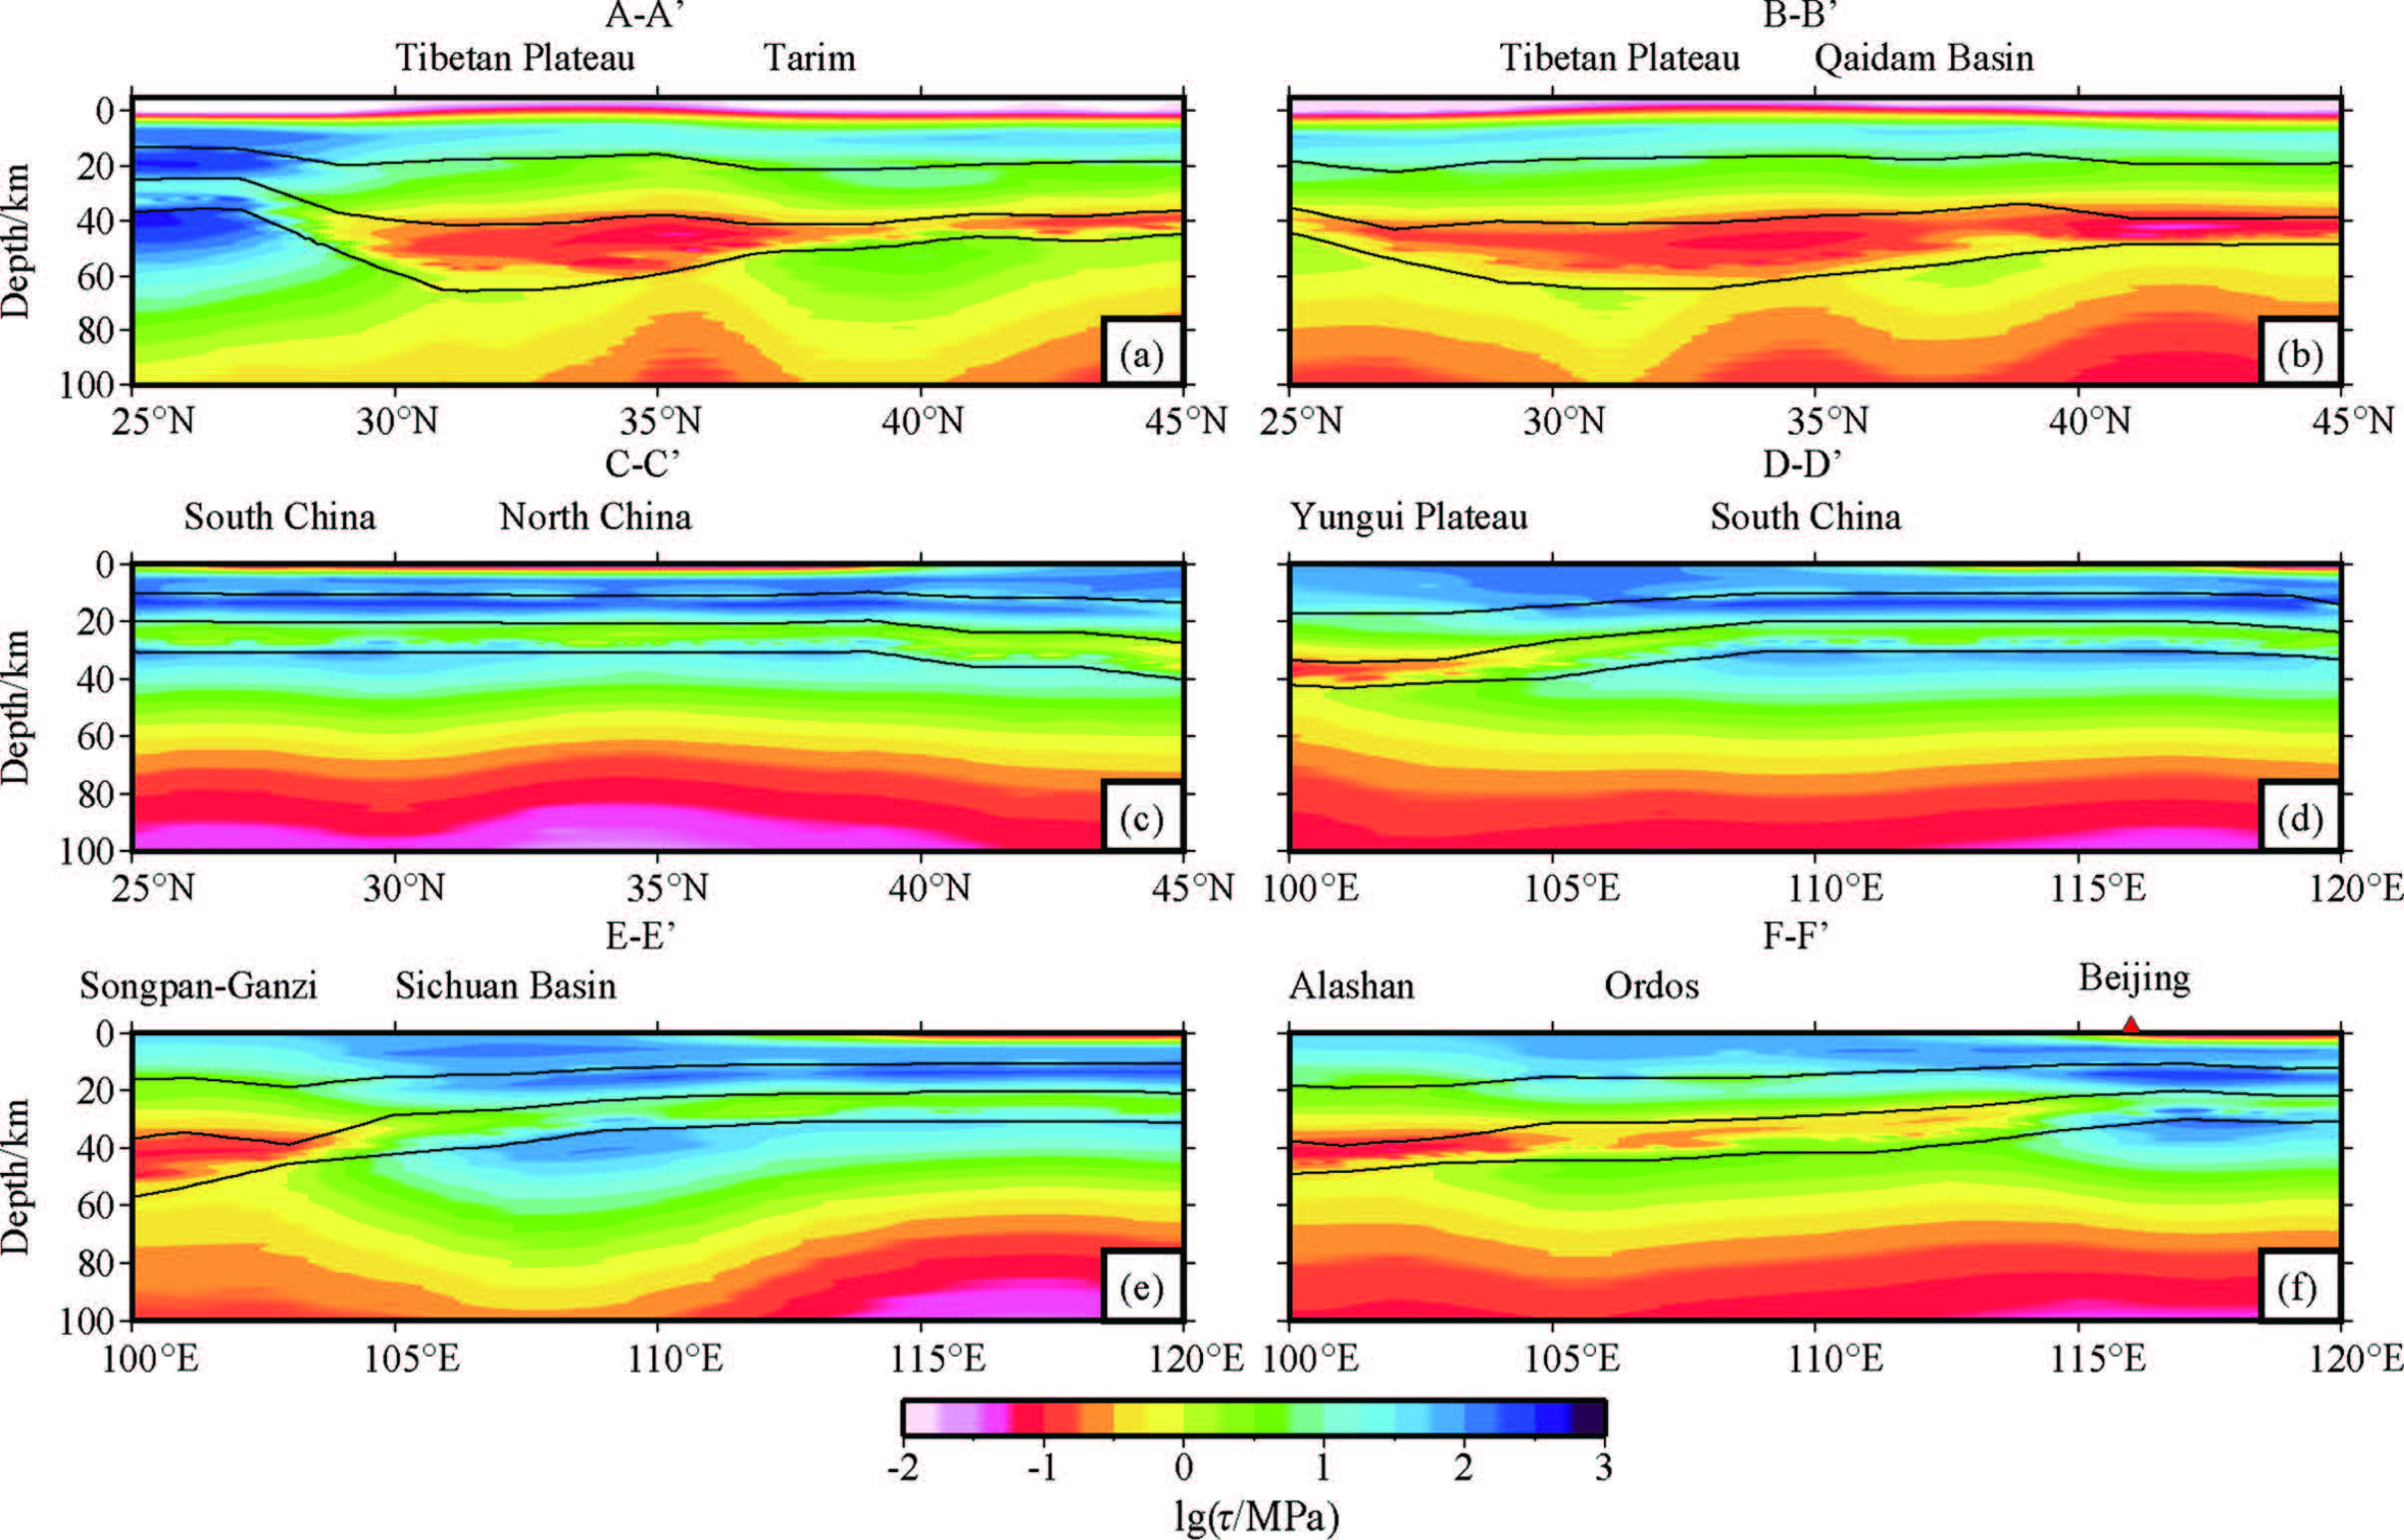
In the vertical profiles,the lithospheric strength shows that significant vertical stratification (Fig.4). In each site,the strength of lithosphere presents alternate distribution of brittle and ductile regime (Fig.5). The lithosphere of the Tibetan plateau is thick and weak. But the strength of it does not decrease significantly when the depth is larger than 80 km. However,the lithospheric strength beneath South China,North China,Sichuan basin and Ordos reduces significantly for the depth larger than 80 km. This distribution is consistent with the temperature (Fig.5). In all the selecting sites,the lower crust exhibit ductile regime. The strength profiles show that a weak ductile lower crust is widespread in continental China and its adjacent regions (Figs. 4-5). Generally,the strength of lower crust is less than that of upper crust and upper mantle for 1~2 orders of magnitude. The weakest and thickest lower crust is found beneath the Tibetan plateau,whose strength is approximate 0.1 MPa and thickness is 20~30 km. The depth of focal mechanism also indicates that the lower crust of Tibetan plateau is ductile[8].
|
Fig.4 Lithospheric strength along different profiles Three black solid lines in each profile show the bottom line of upper crust,middle crust and lower crust,respectively (from Crust2.0). |
|
Fig.5 Lithospheric strength and temperature vary with depth at different sites The red dashed lines indicate temperature. The blue lines show the lithospheric strength. Three pink dot lines in each figure show the bottom of upper crust,middle crust and lower crust,respectively (from Crust2.0). |
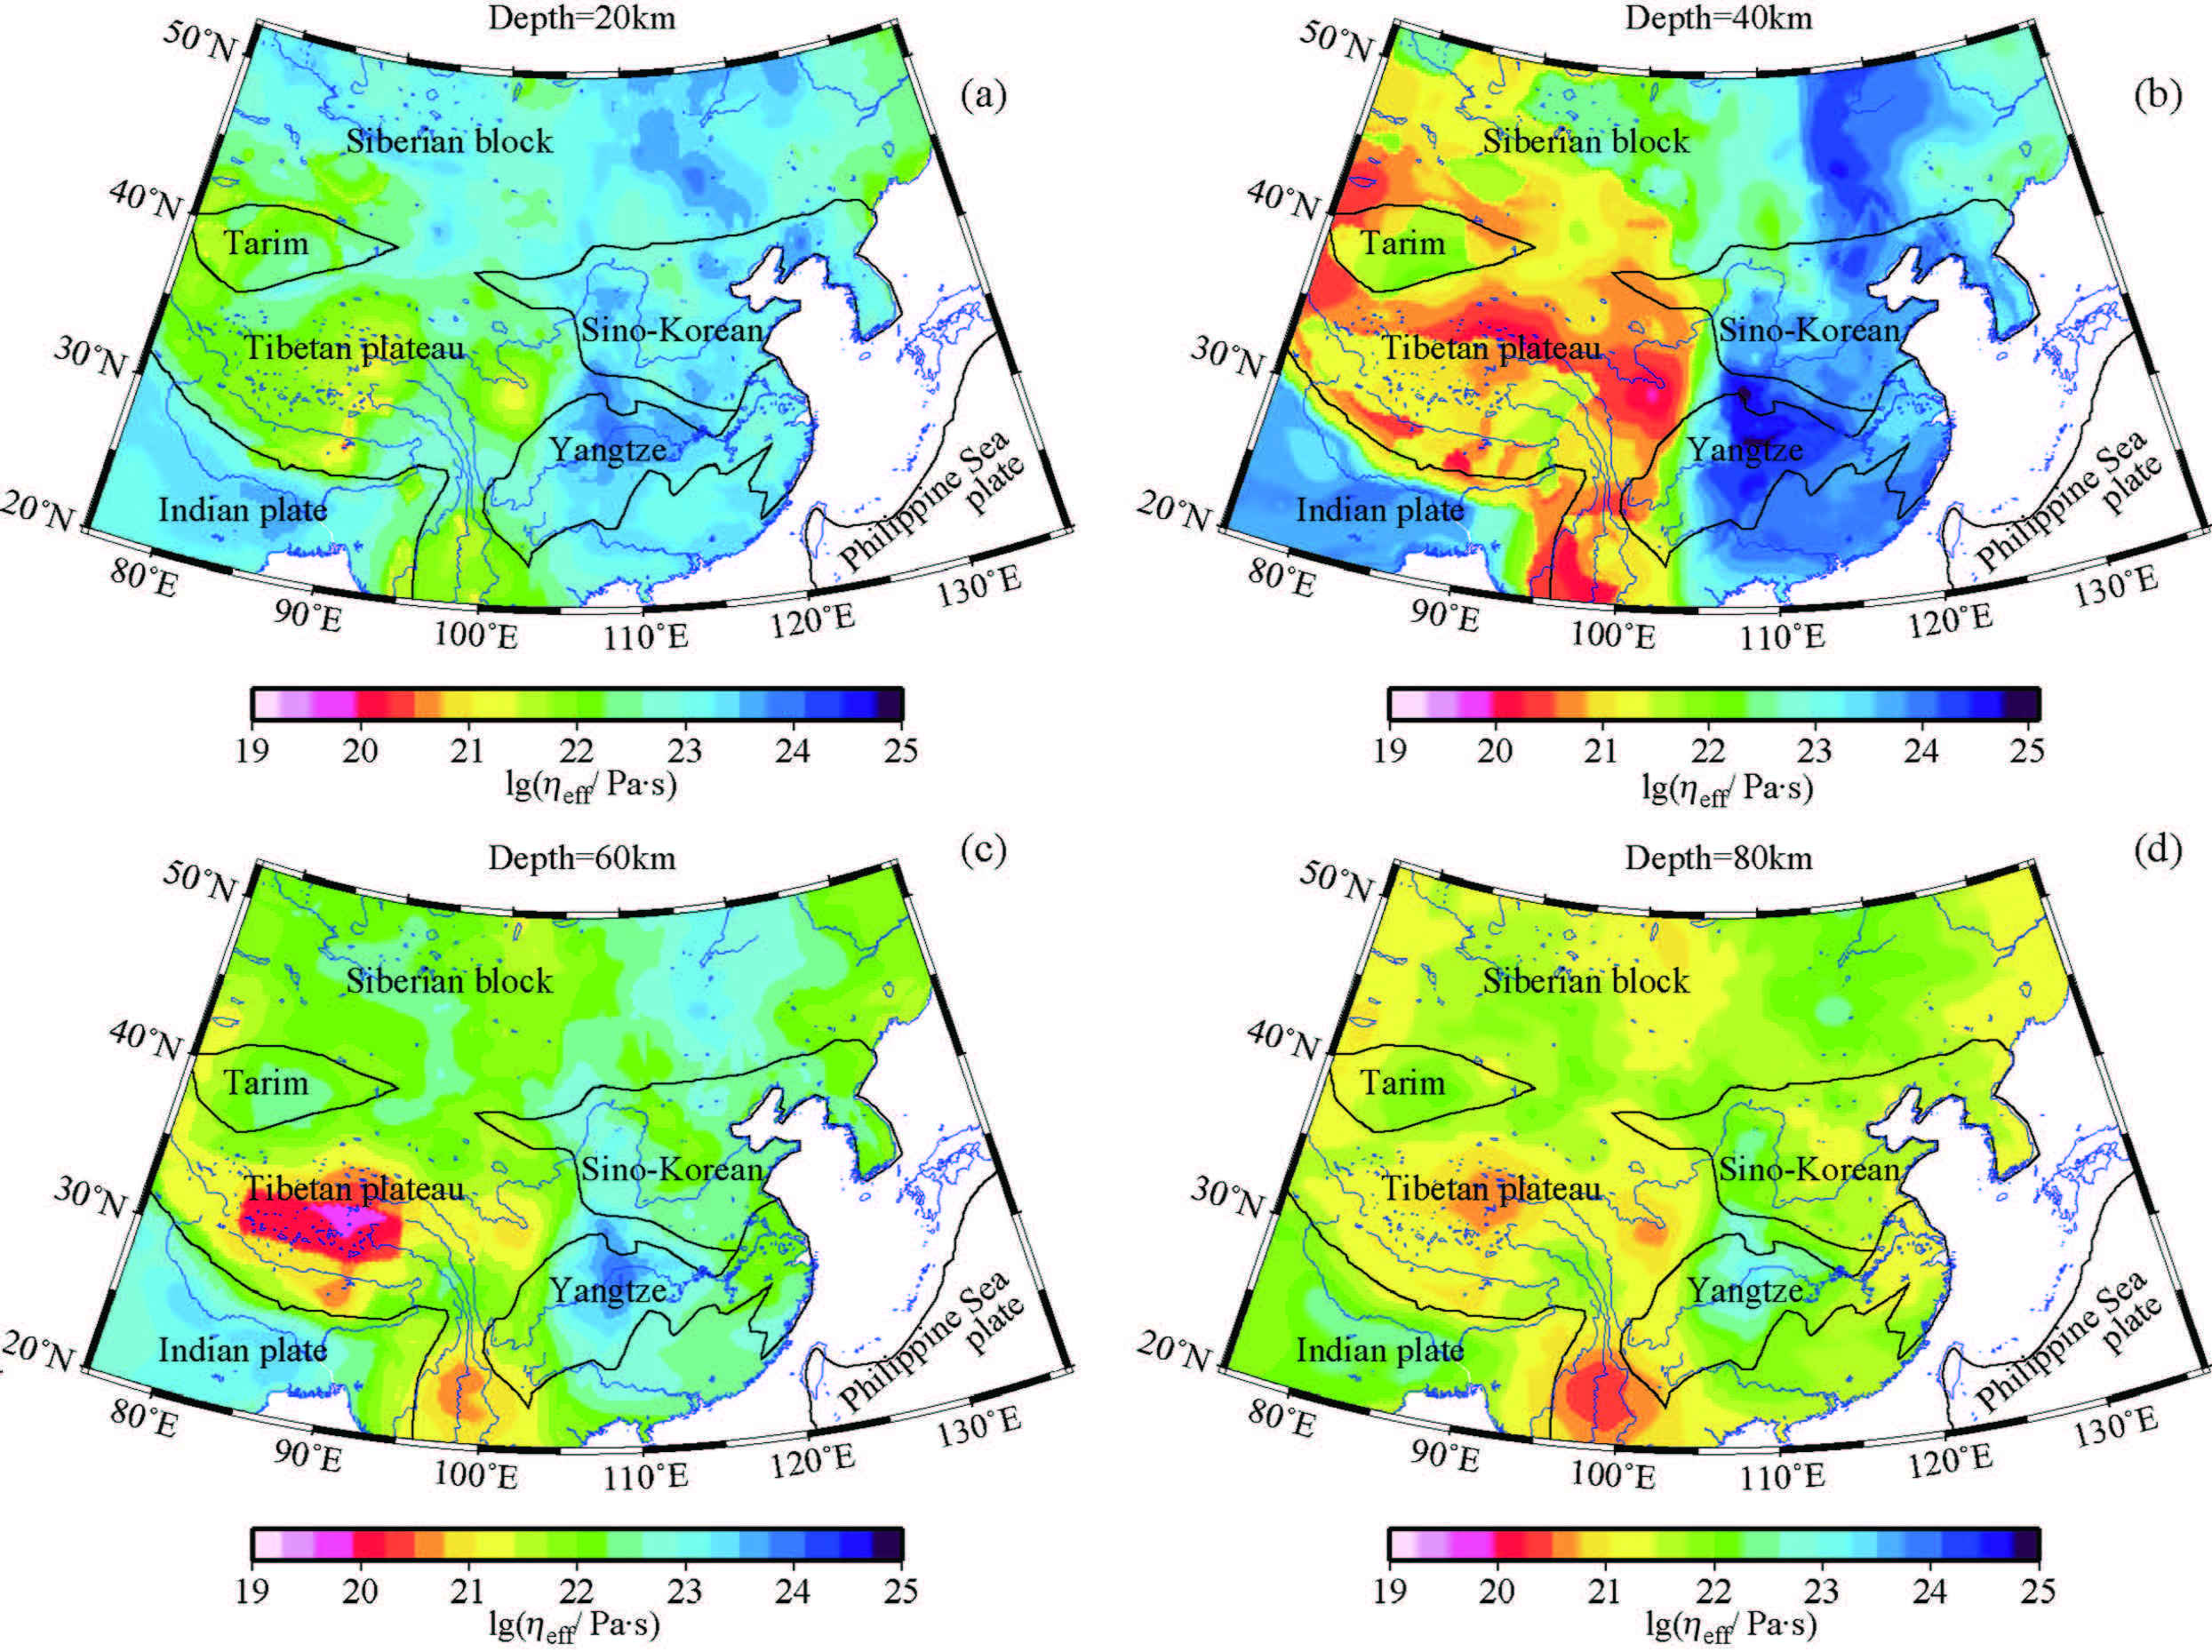
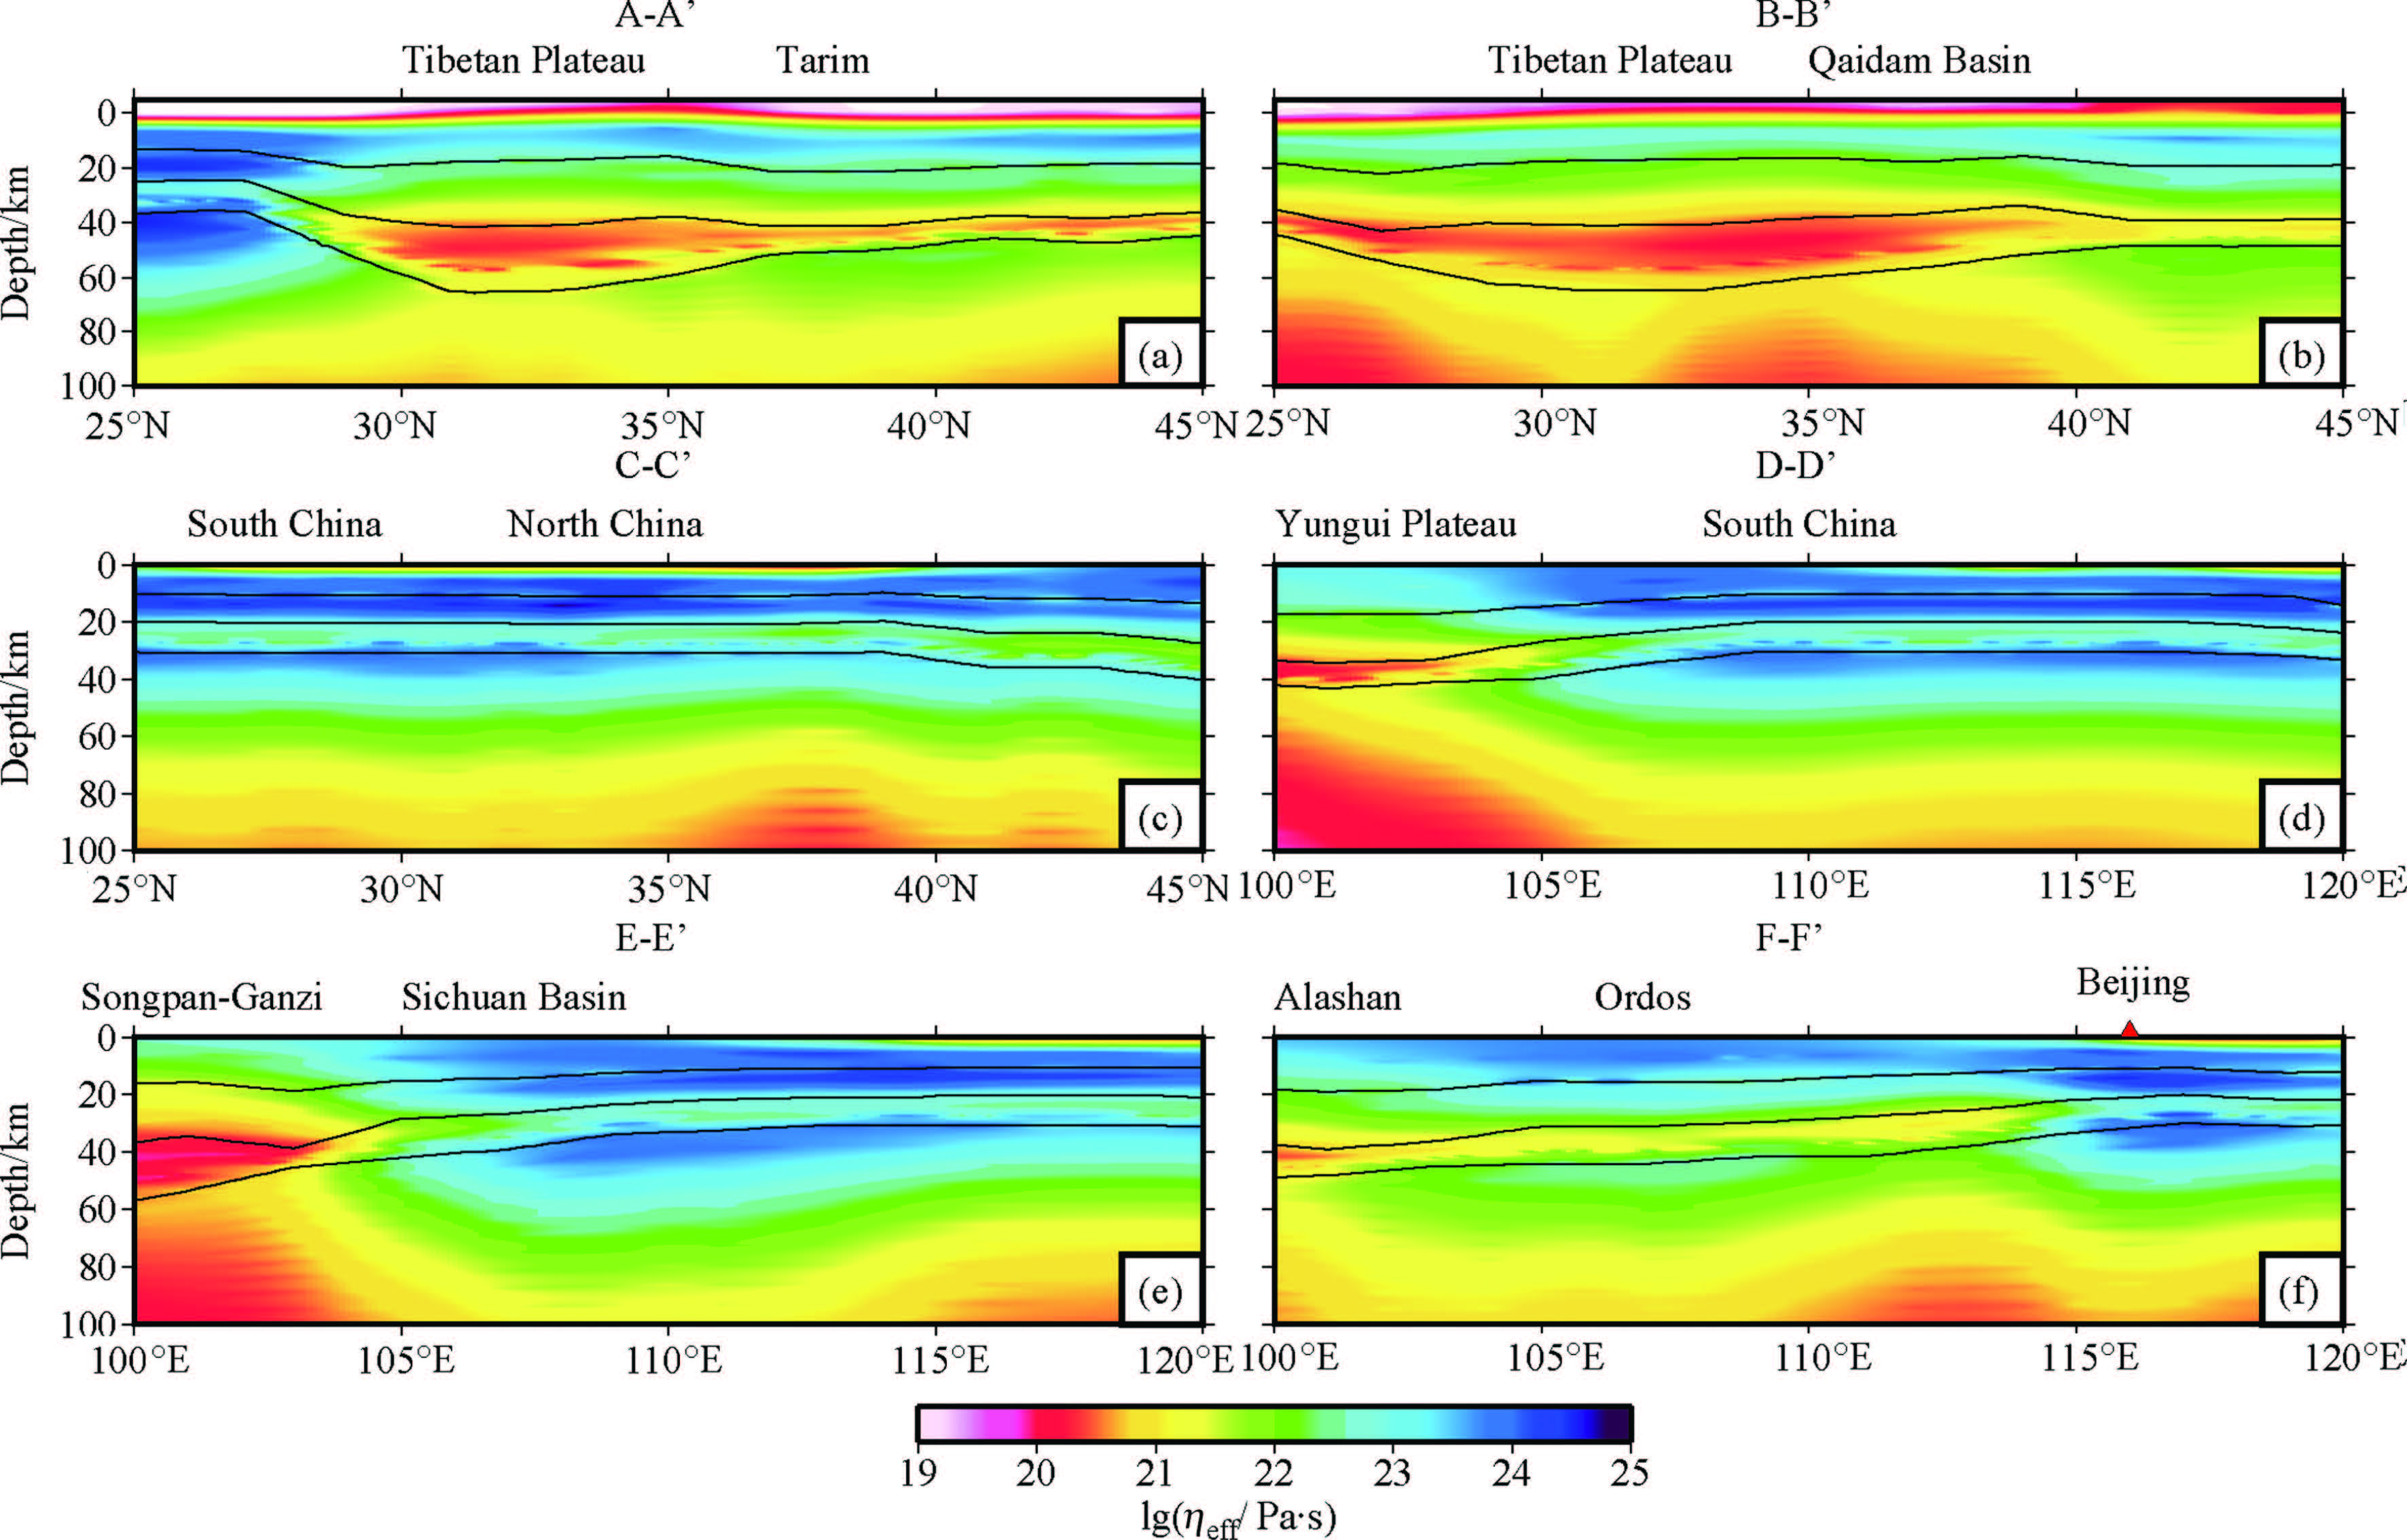
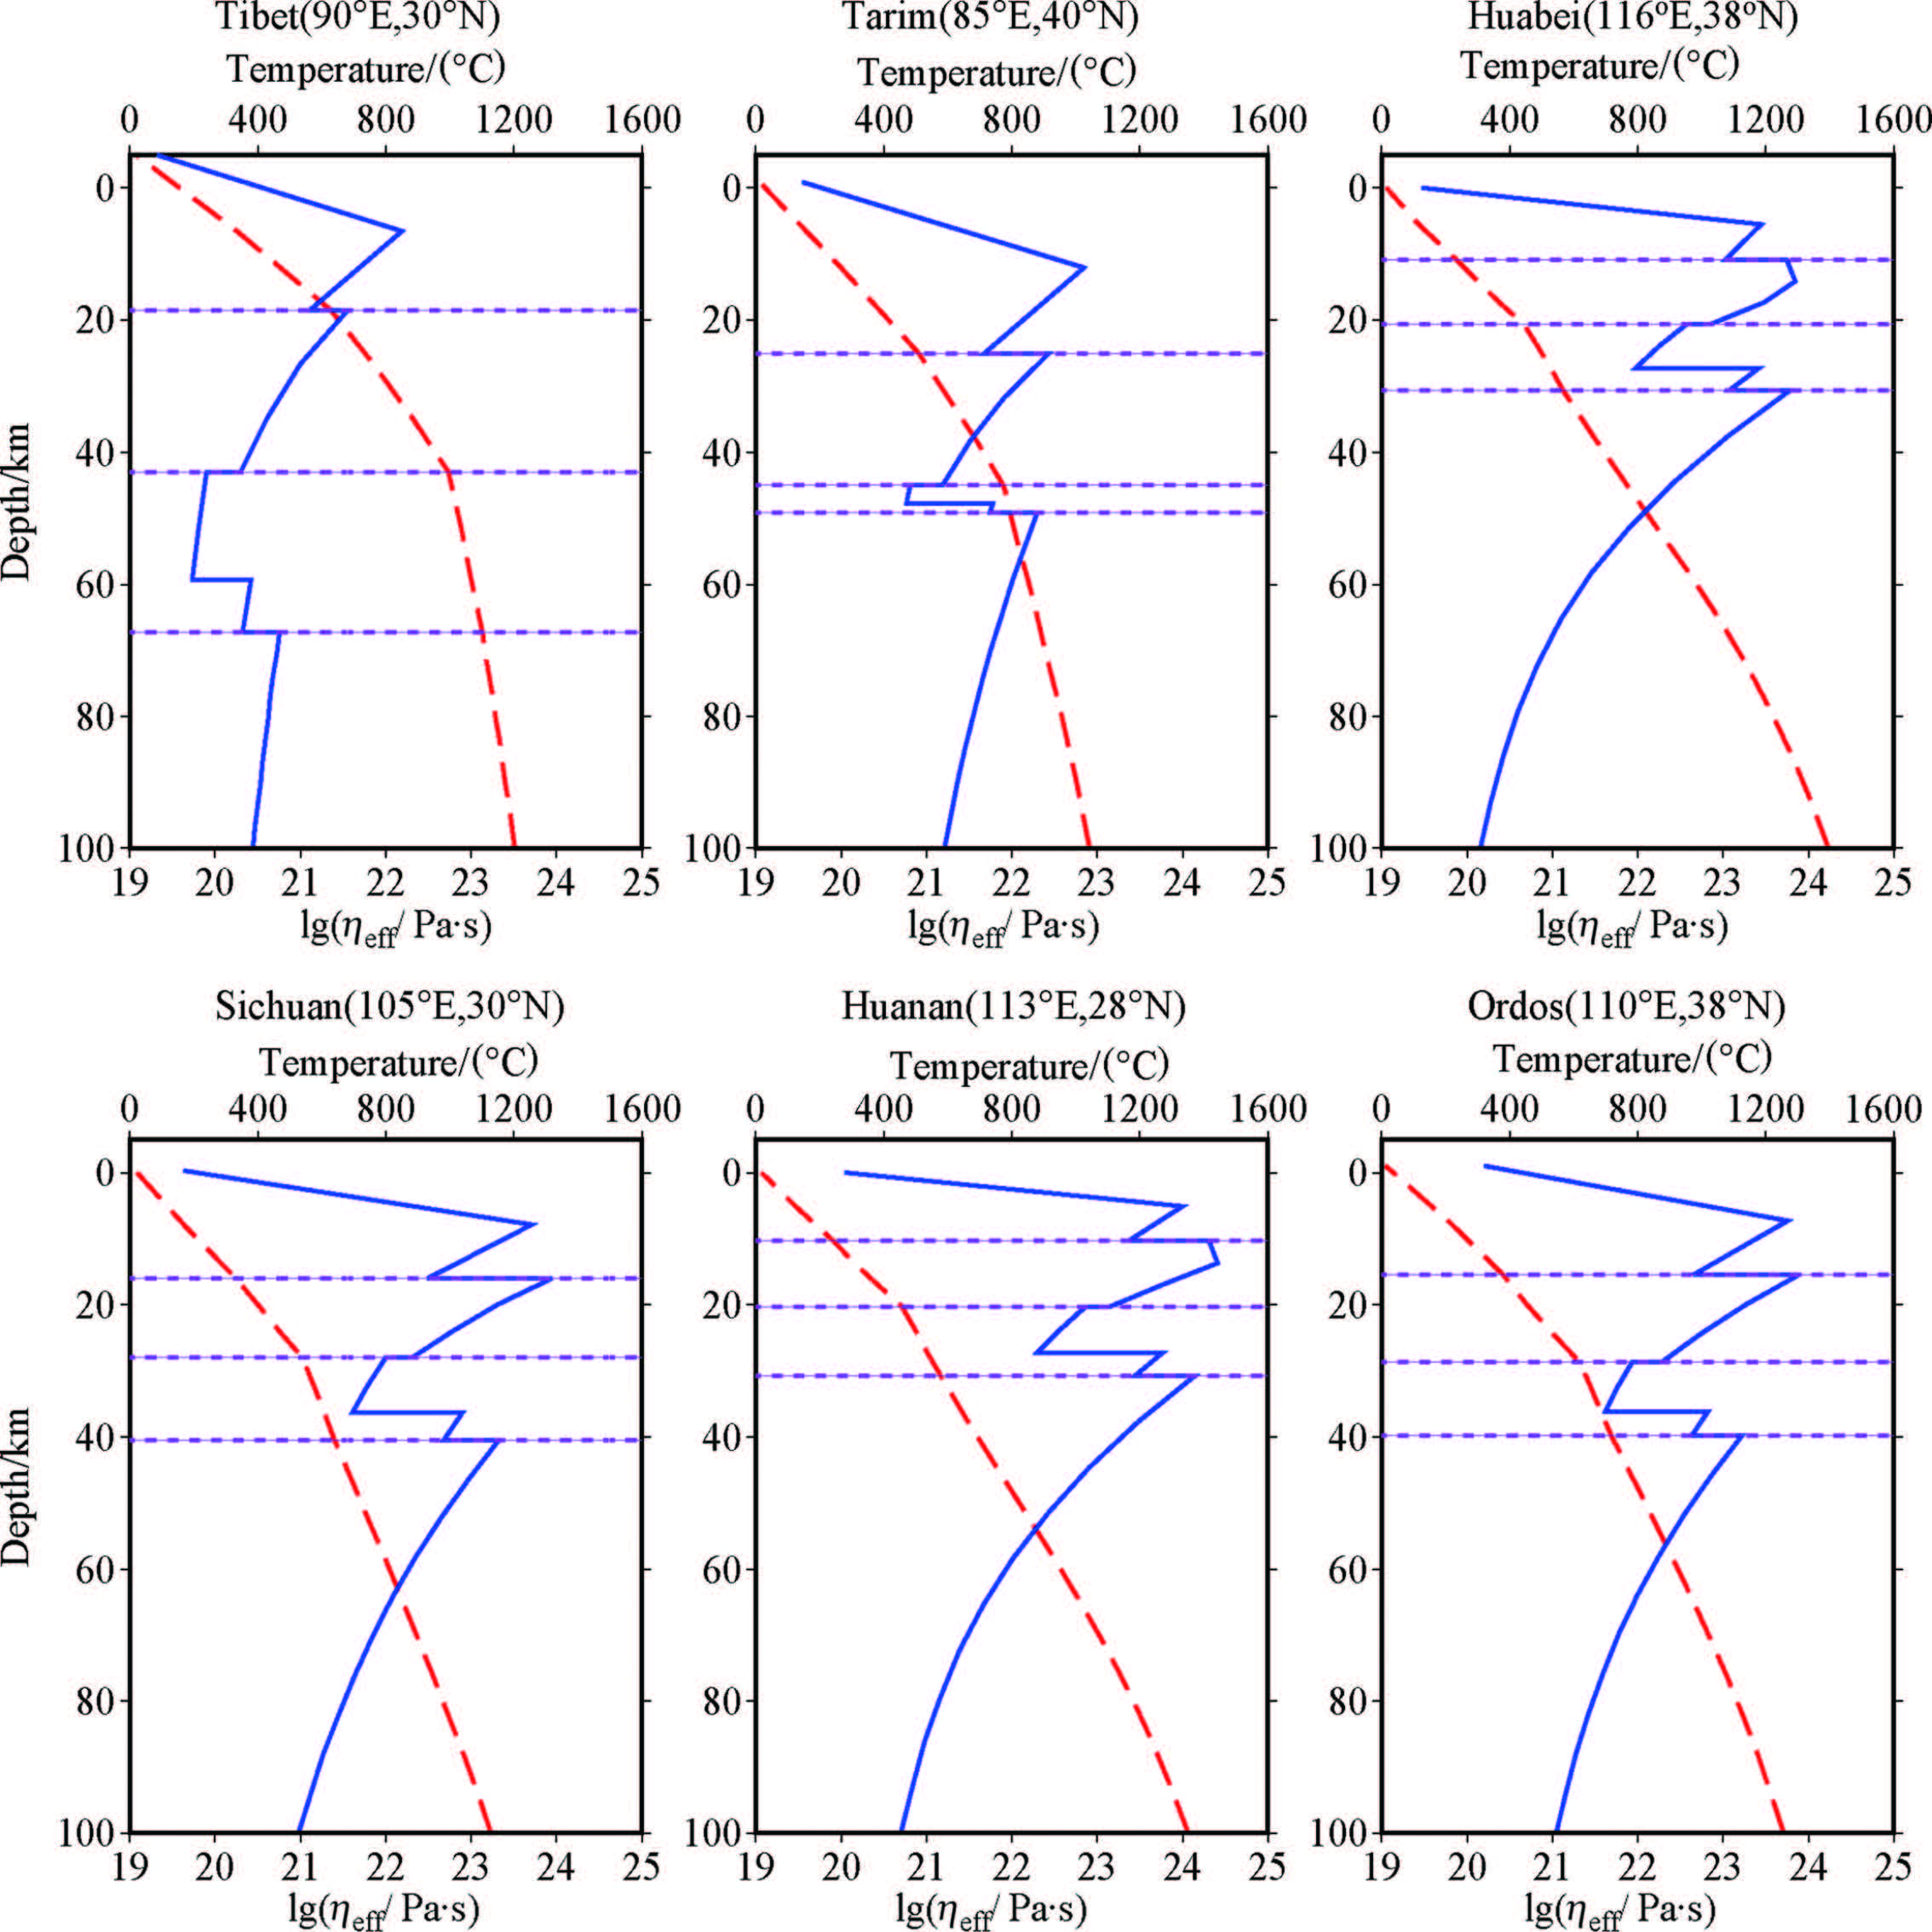
The distribution of effective viscosity is mainly consistent with that of lithospheric strength. In the horizontal direction,at the same depth (less than 40 km),the effective viscosity in the western part of Chinese continent (except Tarim) is smaller than that of North China,South China and Indian plate (Fig.6). For the eastern part of Chinese continent and Indian plate,the effective viscosity of the lithosphere in most area is larger than 1022 Pa·s. While at the same depth,the effective viscosity of the western part of Chinese continent (except Tarim) is smaller than 1022 Pa·s. The effective viscosity of some stable blocks is larger than surrounding area,such as Sichuan basin,Tarim,Ordos and Indian plate. This characteristic is more obvious when the depth is larger than 60 km. In the vertical direction,generally,the effective viscosity of lower crust is lower than that of the upper crust and the lithospheric mantle for 2 orders of magnitude (Figs. 7-8). The effective viscosity of upper crust and middle crust beneath Tarim and Tibetan plateau is 1021 ~ 1022 Pa·s. And the effective viscosity of upper crust and middle crust beneath North China,South China,Sichuan basin and Ordos is 1023 ~ 1024 Pa·s. The effective viscosity of lower crust in Tibetan plateau is only about 1019 ~ 1021 Pa·s,which is in agreement with the previous conclusion that there is ductile lower crustal flow in Tibetan plateau (Fig.6c,Fig.7a,Fig.8a)[49, 50].
|
Fig.6 Effective viscosity obtained in this study at different depths |
|
Fig.7 Effective viscosity along different profiles The black lines in each profile show the bottom of upper crust,middle crust and lower crust,respectively. |
|
Fig.8 Effective viscosity and temperature vary with depth at different sites The red dashed lines indicate temperature. The blue lines show the effective viscosity. Three pink dot lines in each figure show the bottom of upper crust,middle crust and lower crust,respectively. |
There are many effecting factors on the lithospheric rheology,such as temperature,strain rate,creep parameters and crustal structure. (Shi and Cao) studied the effect of temperature and strain rate on the lithospheric rheology[15]. When the temperature is 1000°C derived from seismic velocity with the seismicthermal method,the calculated effective viscosity will be 4 times or 0.25 times when the temperature is increase or decrease 150°C,respectively. If the strain rate calculated by the GPS data is increase to 10 times,the effective viscosity will decrease to 0.2 times. The error of temperature at 100 km used in this study is about 150°C[31]. The temperature of most sites is above 1000°C at this depth. And the maximum error of strain rate derived from GPS observation gets 1 order of magnitude[36]. Thus,the error of effective viscosity in this study is likely to reach 1 order of magnitude due to the uncertainty of temperature and strain rate. It is hard to estimate the temperature and strain rate accurately in the deep lithosphere. So the rheological structure of the lithosphere requires combination of a variety of methods,such as inversion methods through after-seismic deformation. There are many other alternative rock samples when calculated the strength of lithosphere. But the results are similar. The results in this study represent the characteristics of lithospheric rheology in the large scale. The heterogeneity of rock properties in the horizontal direction should be considered in the future work because we just give the vertical stratification. The precision of Crust2.0 is relatively rough,but this model mostly represents the characteristic of the entire lithosphere. The most important is that the finite element model in this study has good scalability. It can be continuously improved with higher accuracy lithospheric structure and more reasonable constraints. Based on the results,we find that the weak ductile lower crust is widespread in continental China and the adjacent regions. The effective viscosity of the lower crust is usually lower than that of the upper crust and the lithospheric mantle for two orders of magnitude. The weakest and thickest lower crust is found beneath the Tibetan plateau. The thickness of lower crust of Tibetan plateau is 20~30 km. The strength and effective viscosity are 0.1 MPa and 1019 ~ 1021 Pa·s,respectively. The lithospheric strength and effective viscosity of Tibetan plateau and western China (except Tarim) is lower than that of the Indian plate,North China and South China. In general,the lateral variations of lithospheric structure are consistent with the spatial patterns of late Cenozoic crustal deformation and seismicity.
ACKNOWLEDGMENTSThis study is supported by Deep Exploration in China (SinoProbe-08-01,SinoProbe-07),the Fundamental Scientific Research Foundation of the Institute of Geomechanics,Chinese Academy of Geological Sciences (DZLXJK201205) and the National Science Foundation of China (41204066). Thanks are given to Dr. Meijian An for providing the upper mantle temperature and Dr. Shoubiao Zhu for providing the strain rate derived from GPS. Some figures are generated by the Generic Mapping Tools (GMT).
| [1] Molnar P. Continental tectonics in the aftermath of plate tectonics. Nature, 1988, 335(6186): 131-137. |
| [2] Kohlstedt D L, Evans B, Mackwell S J. Strength of the lithosphere: Constraints imposed by laboratory experiments. J. Geophys. Res., 1995, 100(B9): 17587-17602. |
| [3] Goetze C, Evans B. Stress and temperature in the bending lithosphere as constrained by experimental rock mechanics. Geophysical Journal of the Royal Astronomical Society, 1979, 59(3): 463-478. |
| [4] Kirby S H. Rheology of the lithosphere. Reviews of Geophysics, 1983, 21(6): 1458-1487. |
| [5] Kirby S H, Kronenberg A K. Rheology of the lithosphere: selected topics. Rev. Geophys., 1987, 25(6): 1219-1244. |
| [6] Ranalli G, Murphy D C. Rheological stratification of the lithosphere. Tectonophysics, 1987, 132(4): 281-295. |
| [7] Sibson R H. Frictional constraints on thrust, wrench and normal faults. Nature, 1974, 249(5457): 542-544. |
| [8] Chen W P, Molnar P. Focal depths of intracontinental and intraplate earthquakes and their implications for the thermal and mechanical properties of the lithosphere. J. Geophys. Res., 1983, 88(B5): 4183-4214. |
| [9] Royden L. Coupling and decoupling of crust and mantle in convergent orogens: Implications for strain partitioning in the crust. J. Geophys. Res., 1996, 101(B8): 17679-17705. |
| [10] Meissner R, Mooney W. Weakness of the lower continental crust: a condition for delamination, uplift, and escape. Tectonophysics, 1998, 296: 47-60. |
| [11] Ren J S, Wang Z X, Chen B W, et al. The Tectonics of China from a Global View. Beijing: Geological Publishing House, 1999: 32. |
| [12] Unsworth M J, Jones A G, Wei W, et al. Crustal rheology of the Himalaya and Southern Tibet inferred from magnetotelluric data. Nature, 2005, 483(7064): 78-81. |
| [13] Wang Y. Heat flow pattern and lateral variations of lithosphere strength in China mainland: constraints on active deformation. Physics of the Earth and Planetary Interiors, 2001, 126(3-4): 121-146. |
| [14] Zang S X, Wei R Q, Liu Y G. Three-dimensional rheological structure of the lithosphere in the Ordos block and its adjacent area. Geophys. J. Int., 2005, 163(1): 339-356. |
| [15] Shi Y L, Cao J L. Effective viscosity of China continental lithosphere. Earth Science Frontiers (in Chinese), 2008, 15(3): 82-95. |
| [16] Sun Y J, Dong S W, Zhang H, et al. 3D thermal structure of the continental lithosphere beneath China and adjacent regions. Journal of Asian Earth Sciences, 2013, 62: 697-704. |
| [17] Byerlee J. Friction of rocks. Pure and Applied Geophysics, 1978, 116(4-5): 615-626. |
| [18] Zang S X, Li C, Wei R Q. The determination of rheological mechanics of lithosphere and the influencing factors on the rheological strength of lithosphere. Progress in Geophysics (in Chinese), 2002, 17(1): 50-60. |
| [19] Zang S X, Wei R Q, Ning J Y. Effect of brittle fracture on the rheological structure of the lithosphere and its application in the Ordos. Tectonophysics, 2007, 429(3-4): 267-285. |
| [20] Wei R Q, Zang S X. Effects of temperature and strain rate on the fracture strength of rock and their influences on the rheological structure of the lithosphere. Chinese J. Geophys. (in Chinese), 2006, 49(6): 1730-1737. |
| [21] Shimada M. Lithosphere strength inferred from fracture strength of rocks at high confining pressures and temperatures. Tectonophysics, 1993, 217(1-2): 55-64. |
| [22] Weertman J. The creep strength of the Earth's mantle. Reviews of Geophysics, 1970, 8(1): 145-168. |
| [23] Zang S, Liu Y, Ning J. Thermal structure of the lithosphere in North China. Chinese J. Geophys. (in Chinese), 2005, 45(1): 56-66. |
| [24] Liu S W, Wang L S, Li C, et al. Thermal-rheological structure of lithosphere beneath the northern flank of Tarim Basin, western China: Implications for geodynamics. Science in China (Series D), 2004, 47(7): 659-672. |
| [25] Liu S W, Wang L S, Gong Y L, et al. Thermal-rheological structure of the lithosphere beneath Jiyang depression: Its implications for geodynamics. Science in China (Series D), 2004, 47(7): 659-672. |
| [26] He L J, Hu S B, Wang J S. Thermal structure of lithosphere in the Eastern continental area of China. Progress in Natural Science (in Chinese), 2001, 11(9): 966-969. |
| [27] Wang L S, Li C, Yang C. The lithospheric thermal structure beneath Tarim basin, Western China. Chinese J. Geophys. (in Chinese), 1996, 39(6): 794-803. |
| [28] Goes S, Govers R, Vacher P. Shallow mantle temperatures under Europe from P and S wave tomography. J. Geophys. Res., 2000, 105(B5): 11153-11169. |
| [29] Goes S, van der Lee S. Thermal structure of the North American uppermost mantle inferred from seismic tomography. J. Geophys. Res., 2002, 107(B3): ETG 2-1-ETG 2-13. |
| [30] An M J, Shi Y L. Three-dimensional thermal structure of the Chinese continental crust and upper mantle. Science in China (Series D), 2007, 50(10): 1441-1451. |
| [31] An M J, Shi Y L. Lithospheric thickness of the Chinese continent. Physics of the Earth and Planetary Interiors, 2006, 159(3-4): 257-266. |
| [32] Hu S B, He L J, Wang J Y. Heat flow in the continental area of China: a new data set. Earth and Planetary Science Letters, 2000, 179(2): 407-419. |
| [33] Wilks K R, Carter N L. Rheology of some continental lower crustal rocks. Tectonophysics, 1990, 182(1-2): 57-77. |
| [34] Wang Q, Zhang P Z, Freymueller J T, et al. Present-day crustal deformation in China constrained by global positioning system measurements. Science, 2001, 294(5542): 574-577. |
| [35] Zhu S B, Cai Y G, Shi Y L. The contemporary tectonic strain rate field of continental China predicted from GPS measurements and its geodynamic implications. Pure and Applied Geophysics, 2006, 163(8): 1477-1493. |
| [36] Zhu S B, Shi Y L. Estimation of GPS strain rate and its error analysis in the Chinese continent. Journal of Asian Earth Sciences, 2010, 40(1): 351-362. |
| [37] Wei R Q, Zang S X. A new constraint on strain rate of the rheological structure of the lithsophere. Chinese J. Geophys. (in Chinese), 2004, 47(6): 1029-1034. |
| [38] Wei R Q, Zang S X. Progresses and problems in the study of the rheological structure of the continental lithosphere. Progress in Geophysics (in Chinese), 2007, 22(2): 359-364. |
| [39] Rudnick R L, Fountain D M. Nature and composition of the continental crust: A lower crustal perspective. Rev. Geophys., 1995, 33(3): 267-309. |
| [40] Christensen N I, Mooney W D. Seismic velocity structure and composition of the continental crust: A global view. J. Geophys. Res., 1995, 100(B6): 9761-9788. |
| [41] Gao S, Luo T C, Zhang B R, et al. Structure and composition of the continental crust in East China. Science in China (Series D), 1999, 42(2): 129-140. |
| [42] Kern H, Gao S, Liu Q-S. Seismic properties and densities of middle and lower crustal rocksexposed along the North China Geoscience Transect. Earth and Planetary Science Letters, 1996, 139: 439-455. |
| [43] Ranalli G. Rheology of the Lithosphere in Space and Time. London: The Geological Society, 1997. |
| [44] Carter N L, Tsenn M C. Flow properties of continental lithosphere. Tectonophysics, 1987, 136(1-2): 27-63. |
| [45] Hansen F D, Carter N L. Creep of selected crustal rocks at 1000 MP. EOS, Transactions, American Geophysical Union, 1982, 63(18): 437. |
| [46] Huang Z, Su W, Peng Y, et al. Rayleigh wave tomography of China and adjacent regions. J. Geophys. Res., 2003, 108(B2): 2073-2089. |
| [47] Zhao D P, Liu L. Deep structure and origin of active volcanoes in China. Geoscience Frontiers, 2010, 1(1): 31-44. |
| [48] Johnson J S, Gibson S A, Thompson R N, et al. Volcanism in the vitim volcanic field, Siberia: Geochemical evidence for a mantle plume beneath the baikal rift zone. Journal of Petrology, 2005, 46(7): 1309-1344. |
| [49] Royden L H, Burchfie B C, King R W, et al. Surface deformation and lower crustal flow in eastern Tibet. Science, 1997, 276(5313): 788-790. |
| [50] Royden L H, Burchfiel B C, van der Hilst R D. The geological evolution of the Tibetan Plateau. Science, 2008, 321(5892): 1054-1058. |
 2013, Vol. 56


