 2013, Vol. 56

 , DU Xue-Bin1, 2
 , YE Qing3, CHEN Jun-Ying1, 2, WANG Jian-Jun1, 2, AN Zhang-Hui1, 2, FAN Ying-Ying1, 2, LIU Jun1, 2
 2. Lanzhou Institute of Seismology, China Earthquake Administration, Lanzhou 730000, China;
3. China Earthquake Networks Center, Beijing 100045, China
Electric field of the earth medium (briefly: geo-electric field) mainly consists of the fast variation electric field,which is produced under the induction of the current system outside the solid earth and distributed on the earth surface,and the slow variation electric field,which resulted from the physical and chemical actions in the underground medium. Geo-electric field observation has been widely used in the resource exploration and geological survey. One of the main purposes of using fixed station to observe the geo-electric field is to carry out the monitoring and forecast for earthquake and other disasters and to study the electromagnetic environment of the earth. Since the early 20th century,domestic and overseas scholars have conducted geo-electric field observation and researches of fixed stations and great knowledge has been obtained on the distribution of the spatio-temporal variations of the geo-electric field[1, 2, 3, 4, 5, 6, 7, 8]. Gish and Rooney plotted the first distribution diagram of the eddy current on the earth’s surface (18 h UT,in 1936) after summarizing the long-term observation results[1]. Geo-electric field observation has also been widely used in the monitoring and forecast tests on earthquake,volcano activities and other disasters[9, 10, 11, 12, 13, 14, 15, 16, 17, 18]. Since the late years of the "ninth five-year plan" period,China has carried out continual and standardized geo-electric field observations at fixed sites in a big spatial scope[19, 20]. By 2011,China has built up the geo-electric network made up of more than 100 stations and the observation at some stations has continued more than 10 years. The geo-electric field observation in mainland China is very significant in the geo-electromagnetism domain at home and abroad. Although there are currently many test researches about the application of geo-electric field in the monitoring and forecast of earthquakes,the research on the spatio-temporal distribution regularity of the geo-electric field is rather weak at home and abroad. Refs.[21, 22, 23] have,based on the observation data obtained by some geo-electric stations of China,studied the time-frequency distribution characteristics of the geo-electric field diurnal variation (hereinafter mentioned as "GEFDV"). However,the application of such data doesn’t show the features of the large Chinese mainland region and thus the research achievements are limited and related understanding is different in certain degree,thus,such data is insufficient to tell the spatio-temporal distribution regularity of the GEFDV. Considering that Chinese geo-electric network is featured with high intensity and richly accumulated data in some regions,this paper has,based on the research achievements of Refs.[21, 22, 23],used the observation data obtained at geoelectric stations along two longitude chains in the east and west part of mainland China respectively and two latitude chains (at the middle to low latitude and the middle latitude),to study the spatio-temporal distribution regularity of the GEFDV,hoping to understand further the wide distribution characteristics of the GEFDV in mainland China.
2 DATA SELECTIONThe observation configuration of the geo-electric stations of China is laid on two orthogonal directions of NS and EW and an oblique-crossing direction,which consist of totally six measuring channels at the long and short electrode spacings[20]. Sampling rate of each measuring channel is 1 time/min while the resolution of instruments is 10 μV,and measurement is consecutive 24 hours daily. In order to study the temporal and spatial variation of the geo-electric field in the large-space region in mainland China,observation data obtained at the stations along the two longitude chains and two latitude chains in the geo-electric network of China is selected with the selecting principles: (1) The distribution range of the station is as large as possible and the spatial distance among stations is as equal as possible; (2) Try to select stations near to or on the latitude chains and longitude chains; (3) Observation data of the selected stations is of good observation quality. As shown in Fig.1,longitude chain a is made up of 14 selected stations along the 118°E line,including (from south to north) Quanzhou and Shaowu in Fujian Province,Hai’an and Gaoyou in Jiangsu,Jiashan in Anhui,Tancheng and Wudi in Shandong,Dabaishe and Changli in Hebei,Tongzhou in Beijing,Baochang in Inner Mongolian,Yushu in Jilin,Suihua and Manzhouli in Heilongjiang; Longitude chain b is made up of 12 selected stations along the 99°E line,including (from south to north): Tengchong and Eryuan in Yunnan,Lake Luguhu and Ganzi in Sichuan,Dawu and Dulan in Qinghai,Sitan,Gulang,Shandan,Gaotai and Jiayuguan in Gansu and Shizuishan in Ningxia; Latitude chain c is made up of 7 selected stations along the 40°N line,including (from west to east) Wushi in Xinjiang,Guazhou,Gulang and Jiayuguan in Gansu,Datong in Shanxi,Yanqing and Tongzhou in Beijing; Chain d is made up of 12 selected stations along the 34°N line,including (from west to east) Hetian in Xinjiang,Dulan and Dawu in Qinghai,Longnan and Jingning in Gansu,Zhouzhi and Qianling in Shaanxi,Luoyang and Zhoukou in Henan,Tancheng in Shandong,Gaoyou and Hai’an in Jiangsu. However,some stations near to the longitudes and latitudes are not selected due to the unsatisfactory observation environment at the stations.

|
Fig.1 The longitudinal and latitudinal chains on geoelectric network |
In recent years,along with the construction of the geo-electric network in China and the standardized operation of the network and strict measuring procedures on the observation quality,the overall quality of observation has been improved in certain degree. Therefore,the periods of selected data are mainly 2010 and 2011. However,due to the environmental disturbance of individual station,observation data of other years from 2008 is used.
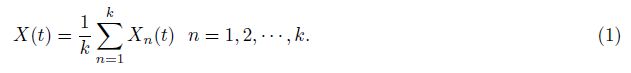
3 DIURNAL VARIATION WAVEFORM OF GEO-ELECTRIC FIELD 3.1 Waveform VariationAccording to the magnetic indices published by Helmholtz-Center Potsdam (GFZ),observation data on the monthly magnetically quiet days and on days which are close to the quiet days are selected as much as possible. Time sequence superposition method is adopted for data processing to highlight the diurnal variation waveform and suppress irregular noises. The time-sequence superposition formula is as follows:
The data observed on the stations along longitude chain a are chosen as the main subject for research. Fig.2 shows the time-sequence superposition curve of the observation data obtained at each of the eight geoelectric stations along chain a on the three magnetically quiet days (or generally magnetically quiet days) in February of 2010,from top down in order of increasing station latitude. It can be seen from Fig.2 that the geo-electric field diurnal variation is mainly reflected as the two-crest and two-trough fluctuations. Among the stations,the diurnal variation waveforms of stations Quanzhou,Hai’an and Gaoyou in the low latitude,stations Tancheng and Wudi at the middle-low latitude and station Suihua in the middle-high latitude appear mainly as the two-crest and two-trough fluctuations while that of station Manzhouli is seemingly one-crest one-trough fluctuation before and after the noon.

|
Fig.2 The time-sequence superposition curves of geo-electric field on magnetically quiet days in Feb.2010 |
Stations along chain a are distributed in the latitude range from 25.02°N to 49.57°N. Generally,it seems from Fig.2 that the higher latitude the station locates,the smaller the diurnal variation crest-trough amplitude |Ep| will be (for example,station Suihua has the highest latitude and its N-component |Ep| is 0.6 mV/km while the E-component is 0.4 mV/km); in contrast,the smaller the latitude is,the bigger the |Ep| amplitude will be (for example,station Quanzhou has the lowest latitude and its N-component |Ep| is 20 mV/km while its E-component is 15 mV/km). Furthermore,the crest-trough amplitude before the noon seems slightly bigger than that after the noon.
3.2 Relation with Local TimeIt can be seen from Fig.2 that diurnal variation wave crests and troughs appear at noon (around 12 h local time) in stations along chain a. A little phase difference appears among some stations,which is because that not all the stations along chain a lie in line 118°E. Taking this line as the center,phases of stations with longitude slightly eastward is earlier than that of stations with longitude slightly westward. Taking station Suihua (its longitude is 126.9°E) and station Manzhouli (its longitude 117.43°E) as examples,the crest to trough extreme values of station Suihua appear early than those of station Manzhouli and no phase difference appear among stations Manzhouli,Tancheng and Quanzhou which are similar in longitude.
Observation data of stations along chain d is selected and further research on the diurnal variation regularity with the local-time changes (namely,the "longitude effect") is carried out in sequence of Loyd D- (Nov,Dec,Jan and Feb),J- (May,Jun,Jul and Aug) and E seasons (Mar,Apr,Sep and Oct). One magnetically quiet day is chosen from each season in 2011,2008 and 2010 to compare the geo-electric field diurnal variation waveform among different stations along chain d on the same day. Stations in the Fig.3 are arranged in sequence from east to west and are distributed in 79.9°E-120.5°E,among which the biggest station distance exceeds 3700 km. From the auxiliary lines in the figure,it can be clearly seen that the daily variation phase shows longitude effect,that is,the diurnal variation phase lags behind with the longitude going westward. For example,the diurnal variation phases on Jan 5th 2011 and Mar 7th 2008 show the most obvious longitude effect. Longitude effect on Aug 22nd is relatively obvious also,but not as good as the former two figures (due to influence from data quality). It can be seen from the GEFDV on Jan 5th that: reaching time lag between the second wave valley of stations Hai’an (Jiangsu Province) and that of Hetian (Xinjiang Province) is 2.7 h,agreeing with the local time difference (about 2.7 h) and corresponding to the longitude difference (about 40.6°) between the two stations (see sublines in the figure); Wave phase between Gaoyou-Hetian and Tancheng-Hetian is about 2.6 h,agreeing with local time difference; Next,the time lag between Hai’an-Zhouzhi,Zhouzhi-Dulan and Dulan-Hetian are 0.82 h,0.9 h and 1 h respectively,correspondingly,the diurnal variation phase differences are 0.82 h,1.08 h and 1 h. Obviously,phase of the two fluctuations of the GEFDV has obvious longitude effect and the phase difference agrees greatly with local time difference among stations.

|
Fig.3 The phasic changes of geoelectrical field along with chain d |
It is also noticed that the fast variation geo-electric field component is rather synchronized,without time lag (see that around 0~240 min and 1320 min on Jan 5th 2011 and 0~120 min on Aug 22nd 2010). Actually,such fast variation phenomenon exists universally,especially during the geo-electric storm. It indicates that GEFDV phases have longitude effect and the fast variation synchronization seems to indicate that they have different ‘source’.
The GEFDV waveform and longitude effect at the stations along chain b and chain c are analyzed and the results are similar with that along chain a and chain d. It is noted that the GEFDV waveform and longitude effect at some of the stations along chains a and d don’t agree with the foresaid results very much,the possible reasons may be related to the observation environment and the operation of technical system at the stations; the diurnal variation waveform at a few stations along the four chains even shows the one-crest and one-trough character; and the observation data at very few stations is unacceptable and hasn’t been adopted here.
4 PERIODIC COMPONENT OF THE GEFDV 4.1 Data ProcessingIn the frequency domain analysis on the GEFDV,fast Fourier transform method (FFT) is used to process the minutely data of geo-electric field observed at 14 stations along the four longitude and latitude chains from 2010 to 2011,a total of 116 months of observation data. In order to reliably calculate the period components of the GEFDV,the geo-electric N-component Ex and E-component Ey observation data of 3~5 months is selected at each station,and the data observed through each channel each month in the selected data forms a time sequence with the data length of 43200 minute values,which covers many multiples of the GEFDV period,since the GEFDV frequencies are very low.
4.2 Period CharacteristicsFigure4a shows the FFT amplitude spectra of the Ex and Ey data observed at station Jiashan in Mar 2010. It shows clearly that the amplitudes of the preferred period components decrease in order of 12.4 h,8 h,24 h,12 h,6 h and 4.8 h,in which 12.4 h is the most preferred period. In the data processing for other stations,the periods of 25.6 h and 4 h appear in the relatively preferred periods but with obviously smaller amplitude when compared to the foresaid several preferred period components. Processing on observation data of other months at the station shows the similar results with Fig.4a. Fig.4b is the time-frequency diagram of the FFT amplitude spectra of the Ex and Ey data at station Jiashan throughout the year 2010. It can be seen that: (1) The spectrum amplitudes in the periods of 6 h,8 h,12.4 h and 24 h show advantages,in which the spectrum amplitude of the period of 12.4 h is in the ascendant throughout the year and the period of 24 h in summer looks more significant than that in other seasons; (2) The spectrum amplitude is big in summer and small in winter,especially component Ey.

|
Fig.4 The amplitude spectrums of geoeletrical field on Jiashan station (the above: channel-NS,the below: channel-EW) (a) The results of the data in Mar. 2010; (b) The time-frequency diagrams of the data in 2010. |
Table1 shows the statistical results for the preferred periods of FFT amplitude spectrum using the data observed through the two channels at each of the four stations along the chain a in five months (Jan,Feb,Mar,Jul and Oct) of 2011. Besides the four stations in Table1,the FFT spectra of the data observed at other four stations along the chain a,which are stations Tancheng,Wudi,Suihua and Manzhouli (not listed here due to the article length),is calculated. For the eight stations,taking the spectrum analysis result for per component of each of the eight stations in per month as a group,there are in total 80 groups of spectrum analysis results. There are totally 333 preferred periods which can be identified easily among the amplitude spectra. The amplitude spectra of each group are listed from big to small in Table1. It can be seen that 12.4 h,12 h and 24 h are preferred periods and the period 12.4 h is the period component having highest frequency among all the preferred periods. However,periodic components of 8 h and 6 h appear many times and the periodic component of 25.6 h appears occasionally. What else has been noticed is that the preferred periods of components Ex and Ey of the stations,expect for the station Quanzhou in Jan,Feb and Mar,are same or similar,and the preferred periods in different months are same also.
| Table 1 Preferred periods in amplitude spectra of 4 geoeletrical field stations |
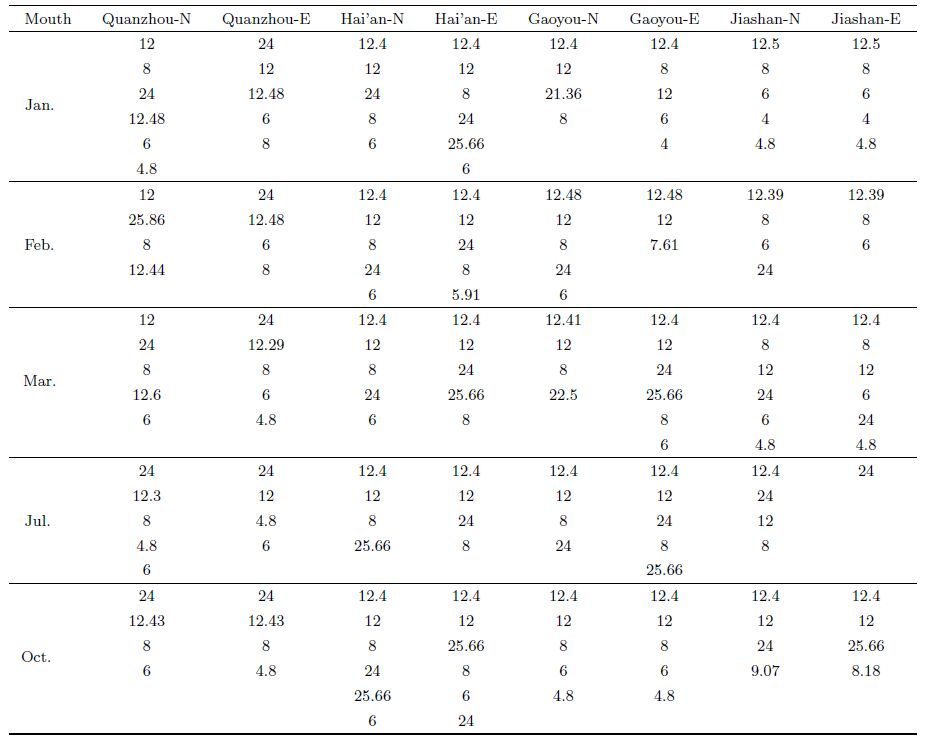
Table2 is the statistics on the FFT amplitude spectra of the stations along chains a and b (for the chain b,the data of stations Tengchong,Luguhu,Gulang,Shizuishan,Shandan and Gaotai in Feb,Aug and Oct of 2011 are selected). It can be seen that the 8h- and 12h-periods at each station along chain a in each month are the most frequent two,with incidence rate reaching 87.5% and 80% according to the frequency statistics,and the group incidence rate of the three periods,6 h,24 h and 12.4 h,are similar,all exceeding 60%,and the 4.8 h-,25.6 h- and 4 h-periods have high frequency also,but they are obviously inferior to the foresaid five periods.
| Table 2 The statistical table of preferred periods of geo-electric field along chains ‘a’ and chain ‘b’ |
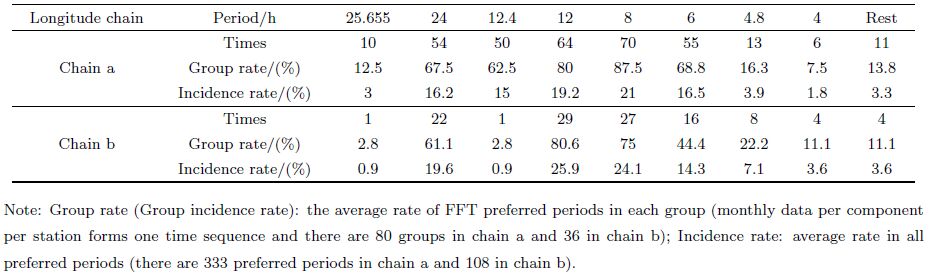
The group incidence rate of other periods reaches only 13.8% in total. A few unusual periods appear,and possible reasons maybe are due to some adverse factors such as the environmental disturbance,defective electrode stability,low insulation of measuring line or the electrical property changes of the underground medium. It should be pointed out that some period in the above-mentioned statistics means a range of such period ±0.1 h (for example,12.4 h means 12.4 h±0.1 h) considering the quality of observation data of the stations and spectrum estimate error. Compared with chain a,average number of preferred periods which can be identified in each group FFT spectra of the stations along chain b is 3.11,lower than 4.16 of the stations along chain a. The reason may be that the observation environment of the stations along the chain b,which are in the west part of China,is rough so the overall quality of observation data is not as good as that of stations along chain a. For example,station Tengchong in Yunnan and station Luguhu in Sichuan have some environment disturbances,which may cause fewer identifiable period components. Main periods of the stations along chain b is 12 h,8 h and 24 h in frequency sequence with group incidence rate greater than 60%,in which,the group incidence rate of 12 h-period is the largest,reaching 80.6%; And other periods with relatively high group incidence rate is 6 h and 4.8 h. Different to chain a,the frequency of 12.4 h-period appears frequently along chain a,with group incidence rate reaching 62.5%,while that is only 2.78% along chain b and the frequency of 25.7 h period is only 2.78% also.
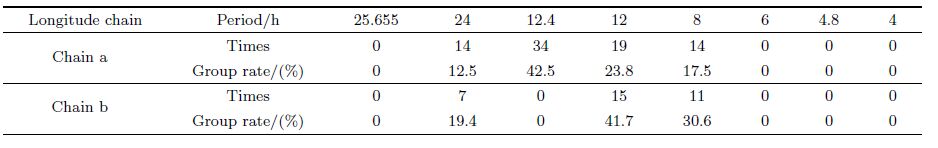
According to the frequency statistics of the biggest FFT amplitude spectrum (Table3),the 12. 4h period component enjoys the highest frequency among the 80 data groups of chain a (data of 80 months),reaching 42.5%,and then 12 h,8 h and 24 h. It shows that among the 8 stations along chain a,the GEFDV is made up mainly of the components with 12.4 h-,12 h-,8h- and 24 h- periods,in which the 12.4 h period has the most significant amplitude. Although the 4.8 h-,25.7 h- and 4 h- periods appear frequently,they do not exist universally and the amplitudes are not great,either; among the 36 data groups of chain b,the period component of 12 h with the largest spectrum amplitude has the highest group incidence rate,and the next periods are 8 h and 24 h.
| Table 3 The statistical table of the most preferred periods of geo-electric field in chains ‘a’ and chain ‘b’ |
In a word,the identifiable preferred periods of the GEFDV on the two longitude chains are mainly 12.4 h,12 h,8 h,24 h,6 h,4.8 h,4 h and 25.7 h according to the FFT spectrum amplitude of the period component. However,the preferred periods of the two longitude chains have slight difference,the 12.4 h period of chain a and 12 h period of chain b are the most significant one respectively.
For the FFT amplitude spectra of N-component of geo-electric field at station Tancheng in Jan 2010,the five harmonic waves with large amplitude are successively with the period 12.4 h,8 h,6 h,12 h and 24 h,from big to small amplitudes. The data of the N-component on three magnetically quiet days (from 6 to 8 this month) are selected to carry out the time-sequence superposition processing,and then the inverse transformation fitting are done using the first five-order harmonics with top amplitude. The grey curve in Fig.5 is the original timesequence superposition curve and the black one is the fitted curve which greatly goes similar to the former. The amplitudes of the top five periods are 1.67 mV/km,1.01 mV/km,0.88 mV/km,0.33 mV/km and 0.26 mV/km,in which the period components of 12 h and 8 h have the biggest amplitude.

|
Fig.5 The harmonic waves synthesis of 3-quiet-day average of Tancheng station channel N in Jan. 2010 |
Literature [24] shows the main periods of geo-magnetic field Sq diurnal variation of station Tucson (U.S.A) processed by FFT and the main period components are 24 h,12 h and 8 h according to amplitude size. This result shows that the main period component of geo-magnetic field Sq diurnal variation is one fluctuation daily. This paper uses the data of each channel of each station in each month to form a long time sequence and the period component estimation should be correct,that is,12.4 h/12 h,8 h and 24 h according to amplitude size,agreeing with the result that the main period components of the GEFDV at stations Changli,Baodi and Jiayuguan estimated by the maximum entropy method are about 12 h,24 h and 8 h[21, 22]. It proves that the GEFDV has mainly two fluctuations daily,complying with the waveform of the GEFDV shown in Fig.2 and Fig.3. It should be noted that the diurnal variation period of very few stations is not 12.4 h/12 h. For example,station Manzhouli has the main diurnal variation period of 8 h.
5 GEO-ELECTRIC DIURNAL VARIATION AMPLITUDEThe analysis on the diurnal variation amplitude focuses on 12 h/12.4 h semi-diurnal wave since the GEFDV is reflected mainly as two fluctuations daily. The data of the stations along chain a and on three magnetically quit days in a month of each astronomy seasons in 2010 is selected to calculate the crest-trough amplitude |Ep|. Feb,Aug and Oct are selected to represent D-,J- and E-seasons. Three colors in black,red and blue are used in Fig.6 to indicate |Ep|. If abnormal data appears in some month,the data of other month in the same astronomy season is used instead of the data of this month. Fig.6a shows the |Ep| changes of component Ex of the 11 stations along chain a with the station latitude; Fig.6b shows |Ep| changes of component Ey with the station latitude; Fig.6c shows the average result in three astronomy seasons. It can be seen that the |Ep| of the stations along chain a is approximately in the range from 1 mV/km to 23 mV/km and |Ep| generally decreases with increasing latitude,and yet,the Ex results as shown in Fig.6a are slightly in disorder. According to the Ohm’s law of resistance medium J = σ · E (Conductivity σ = 1/ρ),the electric field intensity is related with the medium resistivity ρ. Actually in China,the electrode used for geo-electric field observation is buried at about 3 m under the ground and the apparent resistivity ρs close to the ground surface can be used to replace ρ in the Ohm’s law. Literature [21] studies the relationship between |Ep| and the ground surface ρs of several geo-electric stations during the period of the "ninth five-year plan" and obtains that the bigger ρs is,the bigger |Ep| will be.

|
Fig.6 The changes of amplitude of geoelectrical field in chains "a" in 2010 |
The phenomenon that |Ep| shows slightly in disorder with the increase of latitude shown in Fig.6 may be caused by the different medium conductivity of the ground surface of the station site. For example,the apparent resistivity of the surface medium at stations Manzhouli,Quanzhou and Baochang is about 150 to 200 m in order of ρs size,greater than the 2~60 m at stations Wudi,Gaoyou,Tancheng,Hai’an,Tongzhou,Suihua,Yushu and Dabaishe. The |Ep| of stations Baochang and Manzhouli is relatively big and dispersed while |Ep| of stations Wudi and Gaoyou is small and dispersed. Stations Hai’an and Tancheng have similar ground surface apparent resistivity,station Tongzhou is similar to Suihua,Dabashe and Yushu have little difference,and correspondingly the higher latitude is,the smaller the amplitude |Ep| is.
Furthermore,it can be seen from Figs. 6(a-b) that the red curve of J-season is higher than the green and black (the lowest) curves in E- and D- seasons. Through the statistics of the average amplitude of each station |Ep| in the three seasons,we have gotten the following result (Figs. 6(a-b)): the average amplitudes of components Ex and Ey are 7.65 mV/km and 6.22 mV/km in season J,Ex and Ey are 6.28 mV/km and 4.92 mV/km in season E,and in season D they are 5.14 mV/km and 4.15 mV/km respectively. Obviously,|Ep| is the biggest in summer,J-season,among the three astronomy seasons and then the E-season and finally winter. This result agrees with the research results obtained by literature [21] using the observation data of several stations. Besides,in whichever astronomy seasons,the diurnal variation amplitude |Ep| of the N-component Ex is bigger than that of the E-component Ey.
The statistics on the latitude effect of |Ep| are done using the observation data at the 12 stations along chain b according to the method used in chain a,and the following results are gotten: |Ep| gradually decreases with the latitude increase and decreases from about 35°N (related diagram is not shown here due to the length of article). According to the appraisal result on the observation data quality of nationwide geo-electric stations,the observation quality of the stations along chain b is generally lower than that of chain a,and the stations along chain b are distributed in the active structure region of the North-South seismic belt. These factors have perhaps influenced the analysis on the normal GEFDV |Ep|. Compared with results of chain a,the stations along chain b whose data can be normally exploited are less and the statistical result is relatively dispersed and slightly in disorder. However,on the whole,the |Ep| of the stations along chain b decreases generally from about N35° to either higher or lower latitude.
We select the observation data of the geo-electric field components Ex and Ey at the 11 stations along chain d from west to east to study the |Ep| change with the longitude according to the method used in chain a. The result shows that the |Ep| of nine stations changes between 1 mV/km and 11 mV/km,not showing regular |Ep| changes relating to the longitude.
6 DISCUSSION
6.1 Changes of Diurnal Variation Amplitude with the LatitudeGish and Rooney have roughly plotted the general global earth eddy current distribution diagram at 18 h (UT) in 1936 based on the global geo-electric observation data[1]. Four eddy fields are distributed in the middle-to-low latitude area and other four distributed in the high latitude area,of the northern hemisphere. The eddy centers in middle-low latitude area are around 30°N and the eddy center in high latitude area is near to about 70°N. Relative position of each eddy center to the sun is fixed. The China mainland is roughly covered by two middle-low latitude eddy current fields with the eddy centers of 25°N,120°E and 35°N,70°E (18 h UT). The stations along the two meridian chains (the east chain a and the west chain b) are distributed in the middle- low to middle latitude range 25°-49.57°,and accordingly the two eddy current field covers the stations along chain a and chain b. Since the distribution position of each eddy field to the sun is fixed,at other time of the day,the stations along chain a and chain b will go through the two other eddy current fields in the middle-low latitude area. Given the circumstances,as for chain a,the diurnal variation amplitude |Ep| of the 14 stations from Quanzhou (25.02°N,118.51°E) to Manzhouli (49.57°,117.43°E),decreases gradually with increasing latitude; As for chain b,the diurnal variation amplitude |Ep| of the 12 stations from Tengchong (25°N,98.50°E) to Jiayuguan (39.80°,98.22°) decreases gradually with the latitude increasing and decreasing from about 35°N; and the phase difference of the GEFDV of the stations along the latitude chain is equal to the corresponding local time difference.
The above representation of the diurnal variation amplitude indicates that the eddy current field distribution located at the middle-low latitude area is closely related to the GEFDV amplitude of the stations along chain b and chain a. It is commonly believed that the current system which results in the quiet GEFDV is distributed mainly in the ionized layer over the middle-low latitude areas,and that the disturbed GEFDV corresponds to the eddy current in the ionized layer over the high latitude areas[7]. In the analysis on the GEFDV,it is noticed that the diurnal variation phase difference obviously corresponds to local time difference among the station sites. However,the fast geo-electric variation in the large spatial range along the latitude chain (distance between stations exceeds 3700 m) is in synchronization,which proves that the source inducing the diurnal variation and the fast variation may be different. The possible reason why |Ep| varies with the latitude could be that the current system inside the ionized layer causes the current intensity changes of the ground eddy current fields under the action of solar wind.
6.2 Period Component of Diurnal VariationThe geo-electric field Sq and the diurnal variation in the low geo-magnetic index days mainly consist of 12.4 h- (chain a),12 h- (chain b),8 h-,and 24 h-,as well as 6 h-,4.8 h-,and 4 h-period components,in which the period of 12.4 h is the principal lunar semi-diurnal constituent (wave M2),the period of 12 h is the principal solar semi-diurnal constituent (wave S2),the period of 24 h is the solar declination diurnal constituent (wave P1) and the periods of 8 h,6 h,4.8 h and 4 h are the tidal harmonic components. Among all these period components,24 h,12 h,8 h,6 h and 4.8 h periods are in keeping with the periods of the Sq harmonic wave components of the varying geo-magnetic field. Literature [24] has studied the above mentioned harmonic wave components in the varying geo-magnetic field,and it is believed that such components are closely associated with the tidal power generation in the medium-high atmosphere and the ionosphere. The moon and the sun are the main contributors in succession to the tidal phenomenon of the earth. The leading period for the GEFDV is M2 period for the stations along chain a and S2 period for that along chain b. These period components are the major tidal harmonic components,so it is believed that the main periods of the GEFDV are directly associated with the lunisolar tidal forces. The semi-diurnal tide constituent has twice high tides and twice low tides daily and the diurnal tide constituent has one high tide and one low tide per day. Under the action of the tidal forces,the solid earth,the atmosphere,the ionosphere,ocean and lakes have the tidal phenomenon which result in the cyclic variation of the ground current eddy field strength,and finally result in the above-mentioned main period components of the GEFDV. Thus,the diurnal variation amplitude of the 12.4 h-,12 h- and 24 hperiod components are the most significant.
Literature [23] studies the tidal response of geo-electric field that may be induced by the predominant arrangement of the underground rock fissure direction under the action of the tides and the fissure water transfusion. The anisotropy induced by the cracks in the earth’s crust medium exists generally[25]; Accordingly,literature [23] in fact discussed the geo-electric variation that is induced by the conduction current in the anisotropic medium composed of predominant orientation (or directional alignment) of the micro-cracks within the underground medium. The conductivity mechanism of the geo-electric variation is mainly the electrokinetic effects in the medium,among which the migration and redistribution of conducting solution,distribution of micro cracks and pore configuration are major factors. The geo-electric field station mainly observes the two horizontal orthogonal components on the ground surface,and this paper further discusses the influence of lunisolar tidal forces to the GEFDV observed on the ground surface using the above-mentioned anisotropic medium. In such medium,the Ohm’s law is a tensor expression and the geo-electric field strength |E| in the predominant arrangement direction of the micro cracks and perpendicular to the direction,which are the two horizontal electric principal axis direction in the anisotropic medium,is only related to the resistivity ρ and the current density |J| along the two directions.
Geo-electric measuring electrodes are buried in the underground 3m-depth soil and in the Ohm’s Law,|E| / ρs and |J|. Literature [26] gives the constitutive relation of the apparent resistance change △ρs/ρs,the solid resistivity ρs,the crack water resistivity ρf (in general,ρfρo),the crack ratio υ and its variation △υ/υ in the water-saturated anisotropic medium. According to this constitutive relation,when there is no additional load,the medium will have no deformation (△υ/υ ω 0) and the apparent resistivity of the medium doesn’t change (△ρs/ρs ω 0); and accordingly,|J| and |E| in the medium doesn’t change either; when the lunisolar tidal force is the maximum,the medium expands,which will cause that the micro cracks "opens" or new micro cracks appear,that is,△υ/υ > 0. Then,the water solution containing charged particle and electric charges will move along the predominant arrangement direction of the micro cracks,and connect the conductive channel in the medium,it brings about the △ρs/ρs change in negative direction to reduce ρs. Thus the additional current appears in the medium,and the electric field strength |E| will reach an extreme value. In those regions where the tidal force action is minimum,the medium is compressed,which will cause that the micro cracks "close",that is,△υ/υ < 0,then,the water solution hardly move and the conducting channel is blocked,it brings about the △ρs/ρs increase to make ρs increase,then the |E| will go through an inversive extreme value. Thus,the twice tide processes a day cause the periodic changes of the eddy current strength,and it results in the phenomenon that the GEFDV periods of 12.4 h and 12 h correspond precisely to those of the wave M2 and the wave S2.
On the other hand,the space current system is another important factor influencing the geo-electric diurnal variation. The GEFDVs before and after the noon are similar to those of the varying magnetic field Sq. According to literatures [24, 27],the asymmetry of the varying magnetic field Sq before and after the noon is caused by the low-latitude space current system and the high-latitude space current system. Next,it can be seen by analyzing and comparing the GEFDV waveform and the semi-diurnal tidal waveform observed by borehole strain,static water level and gravity stations that the semi-diurnal variation waveform of the GEFDV and that of boreholoe strain,static water level and gravity have an obvious phase difference and an apparent period difference. Such differences prove that the electrodynamic process in the ionosphere and the atmosphere are also important reasons influencing the geo-electric diurnal variation. Therefore,this paper believes that the variation of the ground eddy current intensity caused by lunisolar tidal forces and the space electromagnetic activity aroused by the solar wind jointly produce the GEFDV semi-diurnal period components.
The stations along chain a are generally located in eastern China where the elevation is lower than 500 m and are mostly located near to the water system,such as seas,lakes and river,etc. The semi-diurnal period of geo-electric diurnal variation is mostly 12.4 h. In contrast,the stations along chain b are generally located at plateau areas where the elevation is higher than 1500 m and the semi-diurnal wave period is mostly 12 h. The possible reason for such difference is that the water network in the underground medium of the stations along chain a is developed,the lunar tidal force is more significant,while the actions of the space electromagnetic activities have more influence for the stations along chain b.
7 CONCLUSIONS(1) Most of the geo-electric diurnal variation of the stations along the two longitude chains and two latitude chains show the fluctuation waveform with two wave crests and two wave troughs. The wave crests and troughs appear at the time intervals before and after the noon. In general,the GEFDV amplitude |Ep| before the noon is slightly greater than that after the noon.
(2) The geo-electric diurnal variation periods are 12.4 h/12 h,8 h,24 h,6 h,4.8 h,4 h and 25.7 h etc. in order of the appearance frequency of FFT amplitude peak. These periods are also the tidal harmonic components period. The chief period is the principal lunar semi-diurnal wave (M2) with the period of 12.4 h for the stations along chain 118°E and the principal solar semi-diurnal wave (S2) with the period of 12 h for the stations along chain 99°E.
(3) The semi-diurnal waveform phase difference of the geo-electric diurnal variation along the latitude chain agrees with the local time difference between the station sites and the longitude effect is generally reflected as that the semi-diurnal waveform phase of the eastside stations is earlier than that of the west stations.
(4) The amplitude of the semi-diurnal wave period components shows latitude effects. Roughly,for chain 118°E,the diurnal variation amplitude from station Quanzhou of Fujian to Manzhouli of Inner Mongolia decreases gradually,while for chain 99°E,the amplitude decreases with the increase and decrease of the latitude from about 35°N. The variation amplitude is biggest in summer among the Loyd astronomy seasons,next in spring and autumn,and weakest in winter; The diurnal variation amplitude of the north component Ex of most stations is greater than that of their east component Ey; and the geo-electric diurnal variation amplitude is positively related with the apparent resistivity in the shallow layer of the station site.
(5) The variation of the ground eddy current strength caused by lunisolar tidal forces and the space electromagnetic activity aroused by the solar wind jointly induce the semi-diurnal period components of the geo-electric diurnal variation.
ACKNOWLEDGMENTSMy sincere gratitude shall go to the two manuscript reviewers and the editing department for their hard work paid for this paper. The two manuscript reviewers have literally checked this paper and have given a lot of specific suggestions and advices for amendment,fully showing their scientific and rigorous academic attitude. This work was supported by National Key Technology Research and Development Program of China (2008BAC35B01-8 and 2006BAC01B02-04-03).
| [1] A П КP KRAEV. Geoelectrics Principle (in Chinese). Zhang K Q, Chen P G, Zhang Z C, et al. Trans. Beijing:Geological Publishing House, 1954:100-236. |
| [2] Lanzerotti L J, Sayres D S, Medford L V, et al. Response of large-scale geoelectric fields to identified interplanetary disturbances and the equatorial ring current. Adv. Space Res., 2000, 26(1):21-26. |
| [3] Pirjola R. Effects of space weather on high-latitude ground systems. Adv. Space Res., 2005, 36(12):2231-2240. |
| [4] Burns G B, Hesse M H, Parcell S K, et al. The geoelectric field at Davis station, Antarctica. Journal of Atmospheric and Terrestrial Physics, 1995, 57(14):1783-1797. |
| [5] Corney R C, Burns G B, Michael K, et al. The influence of polar-cap convection on the geoelectric field at Vostok, Antarctica. Journal of Atmospheric and Solar-Terrestrial Physics, 2003, 65(3):345-354. |
| [6] Fu C Y, Chen Y T, Qi G Z. Geophysical Fundamentals (in Chinese). Beijing:Science Press, 1985:203-254. |
| [7] Sun Z J, Wang H J. Introduction of Geoelectricity (in Chinese). Beijing:Seismological Press, 1990:3-95. |
| [8] Li J M. Geoelectric Field and Electrical Exploration (in Chinese). Beijing:Geological Publishing House, 2005:36-59. |
| [9] Uyeda S. Introduction to the VAN Method of Earthquake Prediction. Singapore:World Scientific Publishing Co., 1995:3-28. |
| [10] Varotsos P, Alexopoulos K. Physical properties of the variation of the electric field of the earth preceding earthquake. Tectonophysics, 1984, 110(1-2):73-98. |
| [11] Zlotnicki J, Kossobokov V, Le Mouël J L. Frequency spectral properties of an ULF electromagnetic signal around the 21 July 1995, M=5.7, Yong Deng (China) earthquake. Tectonophysics, 2001, 334(3-4):259-270. |
| [12] Li N, Du X B, Tan D C, et al. Imminent electro-magnetic phenomenon related to earthquakes recorded at the Songshan Station. Earthquake (in Chinese), 2007, 27(Supple):103-111. |
| [13] Fan Y Y, Du X B, Zlotnicki J, et al. The electromagnetic phenomena before the Ms8.0 Wenchuan Earthquake. Chinese J. Geophys. (in Chinese) 2010, 53(6):2887-2898. |
| [14] Liu J, Du X B, Zlotnicki J, et al. The changes of the ground and ionosphere electric/magnetic fields before several great earthquakes. Chinese J. Geophys. (in Chinese), 2010, 54(11):2885-2897. |
| [15] Tang J, Zhan Y, Wang L F, et al. Coseismic signal associated with aftershock of the Ms8.0 Wenchuan Earthquake. Seismology and Geololgy (in Chinese), 2008, 30(3):739-745. |
| [16] Huang Q H, Liu T. Earthquakes and tide response of geoelectric potential field at the Niijima station. Chinese J. Geophys. (in Chinese), 2006, 49(6):1745-1754. |
| [17] Hao J Q, Qian S Q, Gao J T, et al. ULF electric and magnetic anomalies accompanying the cracking of rock sample. Acta Seismologica Sinica (in Chinese), 2003, 25(1):102-111. |
| [18] Qian S Q, Lü Z, Ren K X. Experimental study on the mechanism of non-synchronism of seismo-electromagnetic radiation precursors. Acta Seismologica Sinica (in Chinese), 1998, 20(5):535-540. |
| [19] Qian J D, Guo Z W, Zhao J L, et al. Technical Requirement for Observational Environment of Seismic Stations-Part 2:Electromagnetic Observation (GB/T 19531.2-2004) (in Chinese). Beijing:Seismological Press, 2004. |
| [20] Du X B, Xi J L, Tan D C, et al. Specification for the Construction of Seismic Station Geoelectrical Station Part 2:Geoelectrical Field Observatory (DB/T 18.2-2006). Beijing:Seismological Press (in Chinese), 2006. |
| [21] Du X B, Ye Q, Zhao J, et al. Study on geoelectric field daily variation. Earthquake (in Chinese), 2007, 27(Supple):121-130. |
| [22] Ye Q, Du X B, Zhou K C, et al. Spectrum characteristics of geoelectric field variation. Acta Seismologica Sinica (in Chinese), 2007, 29(4):382-390. |
| [23] Tan D C, Wang L W, Zhao J L, et al. Influence factors of harmonic waves and directional waveforms of tidal geoelectrical field. Chinese J. Geophys. (in Chinese), 2011, 54(7):1842-1853. |
| [24] Xu W Y. Geomagnetism (in Chinese). Beijing:Seismological Press, 2003:221-349. |
| [25] Negi J G, Saraf P D. Anisotropy in Geoelectromagnetism. Elsevier Science Publishing Company, 1989:1-88, 175-232. |
| [26] Du X B, Li N, Ye Q, et al. A possible reason for the anisotropic changes in apparent resistivity near the focal region of strong earthquake. Chinese J. Geophys. (in Chinese), 2007, 50(6):1802-1810. |
| [27] Zhao X D, Du A M, Xu W Y, et al. The origin of the prenoon-postnoon asymmetry for Sq current system. Chinese J. Geophys. (in Chinese), 2008, 51(3):643-649. |